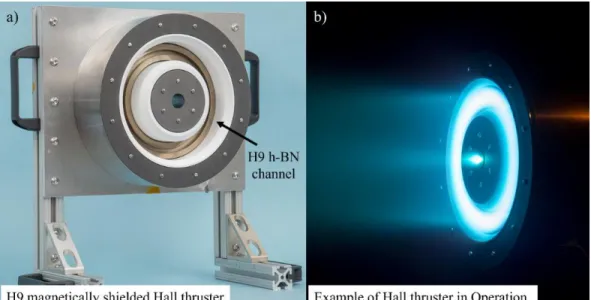
Introduction and Background
Ceramics Throughout History
Records of the manufacturing method and technologies used to make the figurine were lost over time. However, through a careful evaluation of the object using scientific analysis, details of the sintering mechanism of the Venus from Dolní Věstonica were discovered, providing context about the furnace technologies at the time [2].
Processing Methods for Ceramics
- Historic Ceramics
- Advanced Ceramics
- High-temperature Ceramic Coatings
- Ceramic Composites
The furnace firebox was located at the bottom of the hill, allowing heat to rise to the top of the sloping furnace. Calibration of ignition temperatures was quite rudimentary and relied on the expertise of the craftsman, or by tracking the color of the burning flame.
Performance and Degradation of Ceramic Surfaces
- Mechanical Erosion and Wear
- Chemical Erosion
For advanced ceramics in high-temperature environments, the oxidation resistance of the material is an important property of non-oxide ceramics such as SiC, AlN and BN. More precisely, the improved oxidant permeability in borosilicate glasses has been shown to accelerate the oxidation of the composite [17,31].
Thesis Outline
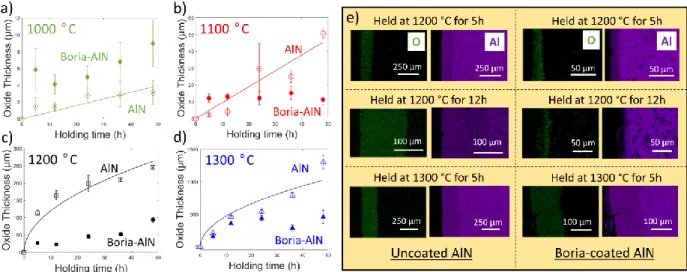
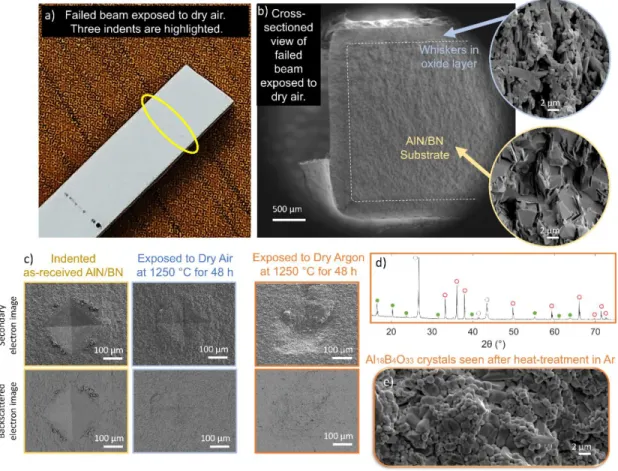
Faber, Oxidation resistance of AlN/BN via mullite-type Al18B4O33, Journal of the European Ceramics Association. H3BO3 powder was used instead of B2O3 due to the hygroscopic, volatile nature of the oxide. The resulting surface microstructures of the boria-coated AlN coupons, observed using SEM, can be seen in Figure 4.4a-g.
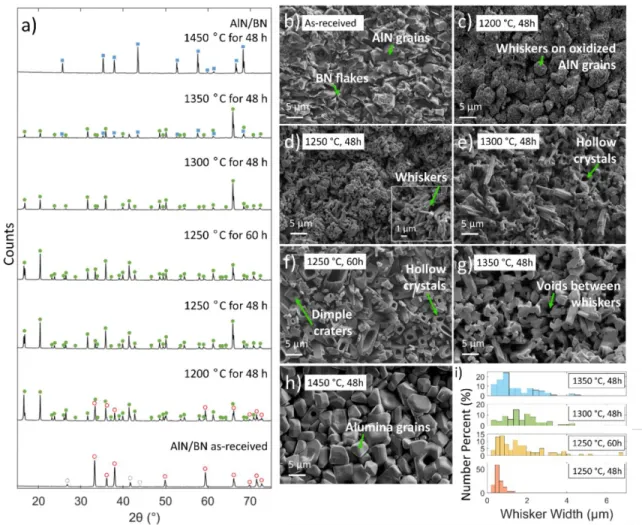
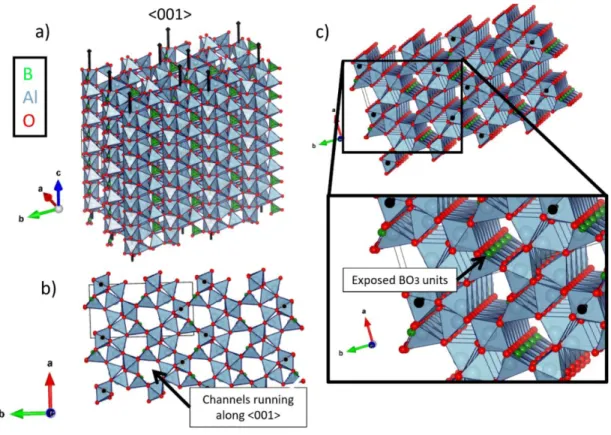
Such channels directly expose planar BO3 arrays along the length of the crystal, seen in Figure 4.8b,c. The porosity of the slabs, seen in Figure 5.7c, is similarly dependent on the annealing temperature of the slab. However, no such shift is observed in Figure 5.4b, potentially due to the placement of the acid bath.
The results of the overall cycle are depicted in Figure 5.12, which is a plot of ΔGtot vs. Three compositions of the lead-rich were investigated, referred to as: Baseline (based on STEM-EDX results of historical Meissen samples, modified so that it can start melting at 600 °C), High Ca/K (a Ca-rich version of Baseline) and High Pb (a Pb-rich version of Baseline). Crespo, Ionic-Exchange Mechanism in the Formation of Medieval Luster Decorations, Journal of the American Ceramic Society.
This chapter is temporarily embargoed
This chapter is temporarily embargoed
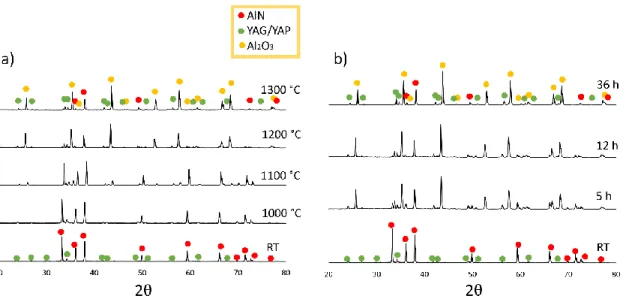
Aluminum Nitride/Boron Nitride Composites
Introduction
The gold nanoparticles are located near the surface of the lead-rich glaze, with a wide distribution of particle sizes and nearest neighbor separations as seen in Figure 6.2c,d. Photographs of the samples, shown in Figure 6.4a, show that the baseline composition of the lead-rich glaze produced the most iridescent sample.
Materials & Methods
- Materials & Processing
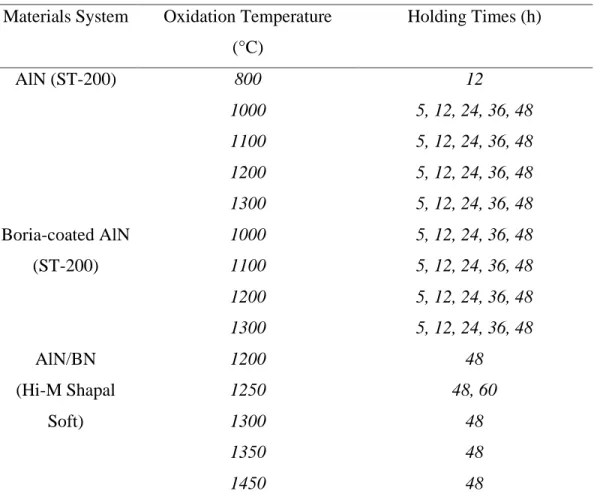
- Oxidation Studies
- Characterization
Results & Discussion
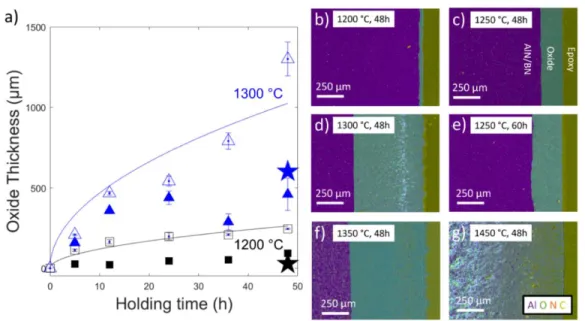
- Influence of B 2 O 3 on the Oxidation of Aluminum Nitride
- Oxidation of Aluminum Nitride
- Oxidation of Boria-coated Aluminum Nitride
- Oxidation of AlN/BN Composites
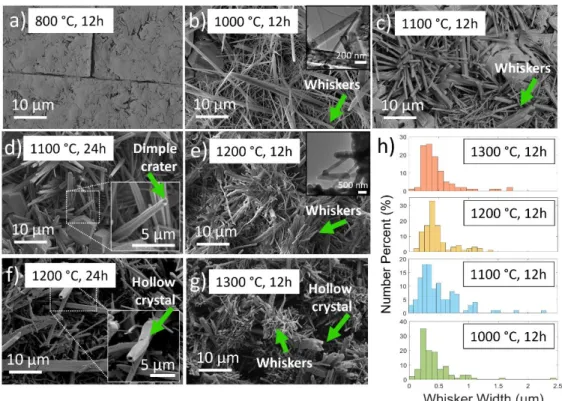
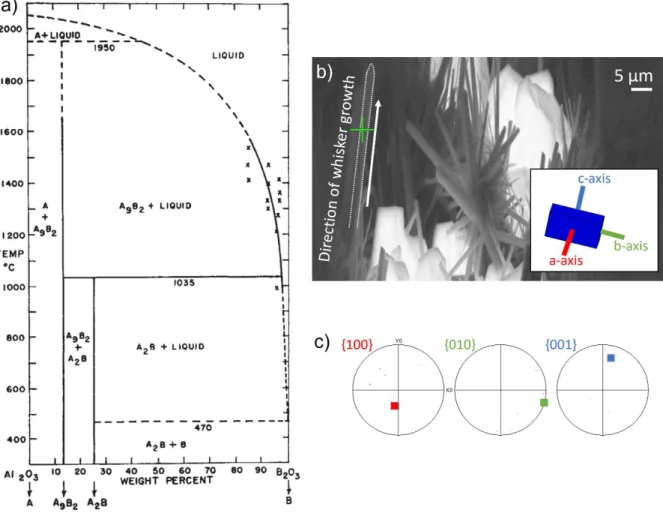
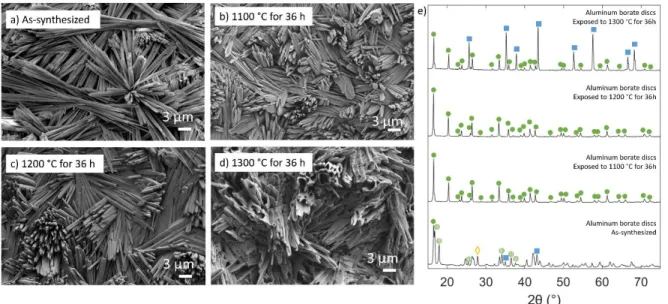
- Aluminum Borate Crystal Microstructures
- Self-healing in AlN/BN Composites
- Effective Strength of Whiskers
- Bend Strength of AlN/BN Composites
Summary
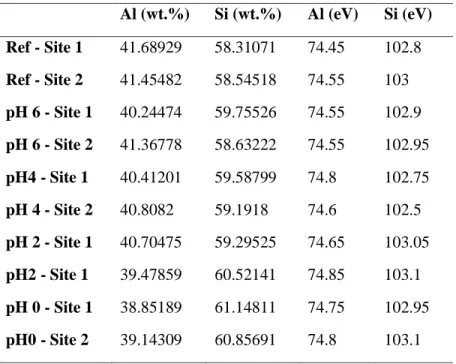
In fact, there is a gradual increase in the Si content at the surface of the powders with decreasing pH. An additional figure highlighting the locations of the removed atoms is provided in Appendix C. A camera was used to capture the iridescence of the samples at the macro scale (Nikon D7500, AF-S Micro Nikkor 40 mm lens, Nikon, Tokyo, Japan).
Faber, which was published in 2022 in the Journal of the European Ceramic Society [1], with the exception of Section 4.6. Bezur led the experimental part of the work on the historical samples, with the help of S.
Aluminosilicate Degradation in Acidic Environments
Introduction
These changing conditions will affect the surface structure, and modifications to the surface chemistry of 2D materials have been shown to be key to engineering tailored nanostructures and properties [8]. For example, the incorporation of specific functional groups on the surface could affect the electronegativity and adsorption affinity of the 2D material. Thus, chemical changes on the surface of clay minerals can greatly alter the desired properties of the material, making it undesirable for some applications.
The present study seeks to achieve a mechanistic understanding of the acid corrosion process of the phyllosilicates kaolinite and metakaolin using a combined experimental and computational approach. The results from the surface reactivity study are then combined with a thermodynamic model to better understand acid-induced transformations of the mineral surfaces.
Methods
- Materials
- Characterization
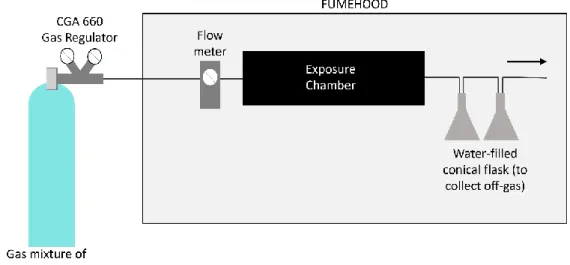
- SO 2 Exposure
- Materials
- Characterization
- Computational Details
- Bulk Structures
- Surface Models
- DFT + Thermodynamics
The spectrum of the partially dehydrated kaolinite sample (400 °C) is similar to the original, showing the same peak positions and absorption intensities, reminiscent of the results in Figure 5.4a. The elemental composition of individual layers was determined by energy dispersive X-ray spectroscopy (Oxford X-Max SDD X-ray Energy Dispersive Spectrometer). Details of the recipes used to make Böttger porcelain and Böttger basic glaze can be found in Appendix D.
Shown in Figure 6.5a, simulations of the tint, based on Kubelka-Munk Theory, are compared to the UV-Vis reflectance spectrum of historical Böttger glaze. Our simulations determined that the concentrated layer of gold nanoparticles near the surface of the glaze did not contribute to thin film interference.
Results & Discussion
- H 2 SO 4 Exposure
- Aluminosilicate Powders
- Remaining Acid Bath Solution
- SO 2 Exposure
- Firing Temperature
- Rehydroxylation
- Surface Reactivity Study
- Thermodynamic Analyses
Summary
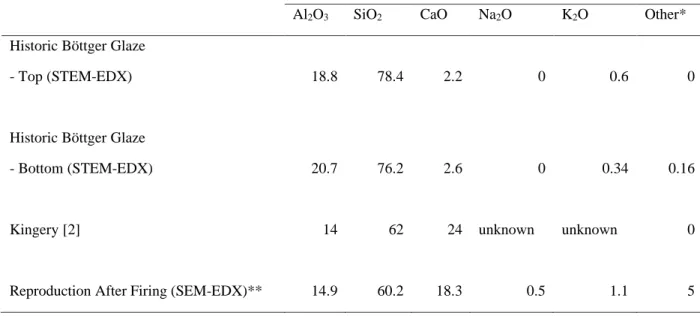
Taylor led the theoretical part of the work, supervised by Faber and co-supervised by Chari. The surface microstructure and overview cross-section of the lusterware samples were imaged using scanning electron microscopy (ZEISS 1550VP FESEM, Carl Zeiss Microscopy GmbH, Jena, Germany). The oxide compositions of the gold nanoparticle-rich region, the lead-rich layer and the base glaze layer were measured quantitatively using EDX (Figure 6.3b) and are shown in Table 6.1.
Taylor led the theoretical part of the work, supervised by Faber and co-supervised by Chari. In fact, the measured composition of the Böttger glaze is close to the composition previously reported for Böttger porcelain [2].
Synthesis and Characterization of Luster Glazes
Introduction
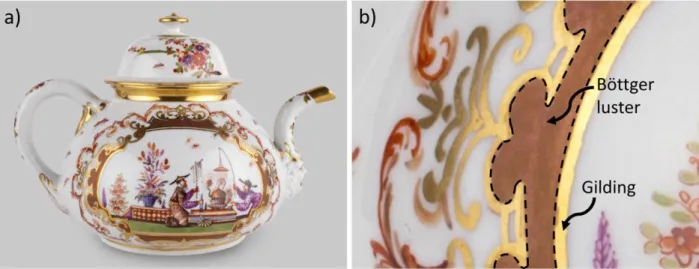
After numerous experiments, the factory eventually became famous for developing a purple, iridescent overglaze decoration known as Böttger glaze [7], also called mother-of-pearl glaze, opal glaze, and (somewhat confusingly) “copper color” [6,8], seen as the purple decoration in Figure 6.1 in the cartouche surrounding the central decoration. The recipe for Böttger gloss does not contain tin, but is also based on a lead-rich vitreous matrix. The focus of this study is to characterize the historic Böttger glaze and compare it to a purple overglaze glaze produced in Meissen using Purple or Cassius.
To further understand the materials and methods used in the original Meissen Manufactory, we attempt to reproduce the luster-glazed porcelain. Finally, we use experimentally determined size distributions of gold nanoparticles in Böttger luster and Purple of Cassius and consult models of Mie scattering and particle array interference to explain how the distribution, if properly adjusted, gives rise to luster by distinct optical effects.
Materials & Methods
- Characterization of Historic Meissen and Reproductions
- Production of Purple Lusters
- Spectroscopic Simulations of Lusters
The thickness of the applied lead-rich glaze played a critical role in obtaining the correct color and luster. Lead-rich glazes begin to soften at this temperature, facilitating the diffusion of gold ions into the glaze, where they are reduced to produce gold nanoparticles. As defined in Figure 6.2a, the oxide compositions of the gloss layer, the lead-rich layer, and the Böttger glaze layer were quantitatively measured using EDX and are shown in Table 6.1.
The compositions of the lead glazes were chosen so that they could soften at the glaze-forming temperature of 600 °C. The composition of the base glaze was initially chosen based on previous experiments by Kingery and Vandiver [2], and can be found in Table D.2.
Results & Discussion
- Historic Glazes
- Böttger Luster
- Purple of Cassius
- Analysis of Reproductions
- Optical Effects
Summary
Faber, Nanoscale Engineering of Gold Particles in 18th Century Böttger Glazes and Glazes, Proceedings of the National Academy of Sciences. Heuer, Plastic Deformation of Fine-Grained Aluminum Oxide (Al2O3): I, Interface-Controlled Diffusional Creep, Journal of the American Ceramic Society. Heuer, Oxygen and aluminum diffusion in α-Al2O3: How much do we really understand?, Journal of the European Ceramic Society.
Top-down view of the three surfaces highlighting the hydroxyl groups (orange circles) and protons (pink circles) removed at each dehydration step. Repeated measurements of the same nanoparticle will give roughly the same results, with some variation.
Conclusions and Future Work
Oxidation Kinetics of AlN
Knowing this, it is reasonable to assume that the rate of oxidation is in fact controlled by the faster of the two species; controlled by Al atoms rather than O atoms. As such, we can use the oxidation graphs of Figure 4.1a to estimate the diffusivity of Al within the porous oxide layer. Readey [2], which links the parabolic rate constant of the metal ion to the free energy of formation of the oxide and the diffusivity of the metal ion, as seen in equation B.1.
The free energy can be corrected by taking into account that the oxidation took place in air, as shown in Equation B.2. The results do not indicate the presence of aluminum oxynitride (AlON), despite previous reports [7] suggesting that AlON is a precursor of Al2O3 in the oxidation of AlN.
Hollow Minerals in Nature
Equivalent observations can be made for other lead-bearing minerals, such as vanadinite (shown in Figure B.3d) and crocoite (shown in Figure B.3e), which can also develop hollow cores.
Electron Backscatter Diffraction Patterns
DFT + Thermodynamics Analysis of Kaolinite, Partially Dehydrated
Forms SO4 bound to the surface; has a proton transfer; all neutral molecules - No need for Solvent-Ion Model here). Partially dehydrated (dehyd) kaolinite Step 1: Adsorption of SO3 on dehydrated kaolinite dehyd-Kaolinite + SO3 → dehyd-Kaolinite-SO3. Forms SO4 bound to the surface; no proton transfer; all neutral molecules - No need for Solvent-Ion Model here). Forms SO4 bound to the surface; no proton transfer; all neutral molecules - No need for Solvent-Ion Model here).
Kaolinite XPS data shows the relative weight percent of Al 2p and Si 2p, and their respective binding energies (eV). Metakaolin XPS data shows the relative weight percent of Al 2p and Si 2p, and their respective binding energies (eV).
XPS Analysis Depth Estimation
Additional Figures of Kaolinite Dehydration Process
Surface-Adsorbate Interfaces
Comments on Composition of Base Böttger Glaze in Historic
Böttger Porcelain and Böttger Glaze Reproduction
However, small amounts of feldspar were also added to increase the flow properties of the glaze, and to better match the vitreous phase of the porcelain body. The thickness of the Böttger glaze layer varied from 450 µm to 200 µm and did not seem to affect the color or gloss of the reproductions. Cross-sections of the samples were examined using scanning electron microscopy, as shown in Figure D.1a, and the oxide compositions of the reproduced Böttger porcelain, Böttger glaze and lead-rich glaze layers were calculated based on EDX elemental mapping.
In contrast, X-ray diffraction patterns of the unglazed Böttger porcelain body confirmed that the hard porcelain contains acicular mullite (3Al2O3.2SiO2) and quartz grains in a glassy matrix, as well as the Ca-rich aluminosilicates expected in early Böttger porcelain. Interlaced mullite crystals can be seen emerging from the porcelain body at its contact with the underlying Böttger glaze in Figure D.1b.
Role of Alkali Ions in Luster Forming Step
Comments on ImageJ Measurements and Error Analysis
Realistically, a random section through a nanoparticle will sometimes give a cross section smaller than the diametric cross section, so the measured radius will consequently be smaller than the true radius. That said, this statistical underestimation will evolve into a scale-invariant multiplicative prefactor that will be constant across samples and nanoparticles, so that Purple of Cassius glaze and Böttger glaze can be directly compared "apples-to-apples" and the true shape of their nanoparticle radius distribution will likewise be unaffected (simply stretched by the same amount along the x-axis).
Comments on Thin-film Interference Effects
Mazzoldi, Ionic transport model for hydrogen permeation causing silver nanocluster formation in silver-sodium exchanged glasses, Applied Physics A: Materials Science and Processing.