This book aims to make the reader aware of all these aspects of design and their integration. As the title of the book suggests, the subjects deal with the many and varied principles of design.
C. Misra
Development of Marine Vehicles, Structures and Facilities
In ancient times, human muscle power was the only source of power for ships in the form of movement of oars in water for forward movement. In the early nineteenth century, steam engines slowly replaced sails and mechanical power became available for ship propulsion.
Types of Marine Vehicles, Structures and Facilities
- Transportation
- Defence
- Resource Exploitation
- Tourism, Recreation and Sports
- Land–Sea Interface
- Support Services
The draft of the semi-submersible rig can be adjusted by ballasting and tank ballasting. TLP can be used for production in very deep water up to a depth of 2 km.
Design Definition and Marine Environment
It is necessary to define the limits within which the parameters of the problem can be manipulated to the advantage of the designer. Design Council (1991), Kuo (1991): "Engineering design refers to that activity necessary to ensure the efficiency, performance and safety of a product, project, process or system to meet market needs.
Oceans
- Ocean Bottom
- World Water Resources
- Straits and Waterways
- Freshwater Resources
This can change again from 200 nautical miles to the end of the continental shelf. Similarly, the Indus, the Brahmaputra and the Ganges are the lifelines of the northern Indian peninsula.
Properties of Water
- Physical Properties
- Density
- Temperature Distribution in the Oceans
- Transmission of Electromagnetic Radiation in Water
- Salinity
- Sound Properties in Water
The density of water at room temperature is about 1 g/cm3 and varies with temperature. Subsequently, the temperature of the water drops sharply with depth to about 1000 meters, and this drop is known as thermocline.
Atmosphere
- Coriolis Effect
- Atmosphere Circulation
Because of the Earth's rotation, every particle that makes up the Earth system—the Earth, the ocean, and the atmosphere—moves at a speed of one rotation in 24 hours, which corresponds to an angular velocity (ω) of s. Because of the intense radiation from the Earth's surface the atmosphere above the equatorial region is heated and rises upwards.
Ocean Circulation
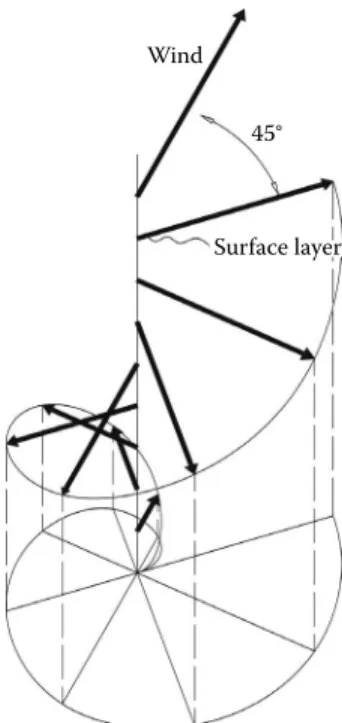
- Ekman Spiral
- Geostrophic Flow
- Gyres
- Thermohaline Circulation
- Circulation in Basins other than Deep Ocean
- Tides
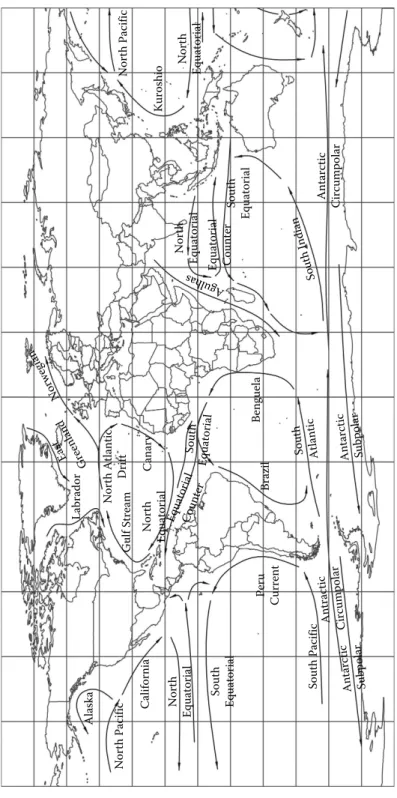
- Ocean Currents
Geostrophic flow is the result of the balance of the pressure gradient and the Coriolis force. If a river joins the sea in the region under consideration, the total flow is a combination of the tidal current and the flow due to the flow of water in the river.
Ocean Waves
- Potential Theory of Water Waves
- Regular Waves
- Irregular Waves
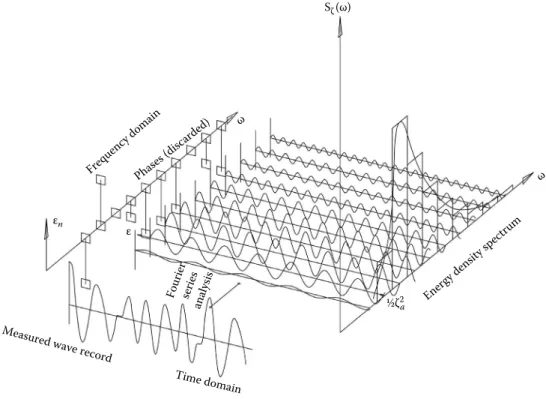
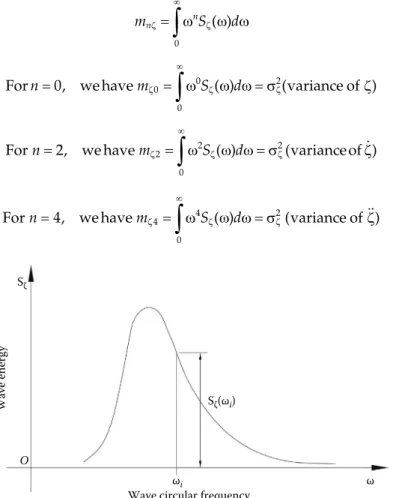
- Energy Spectrum
- Representation of an Irregular Seaway
- Shallow Water Waves
- Seiches
- Storm Surges
- Tsunamis
- Internal Waves
The average wave period T can be found from the average zero-crossing period or from the average period of the wave crests or troughs. Seiches are standing or stationary waves generally found in confined basins with steep sides (e.g. Red Sea) or in water tanks (e.g. wave pool for ship model testing).
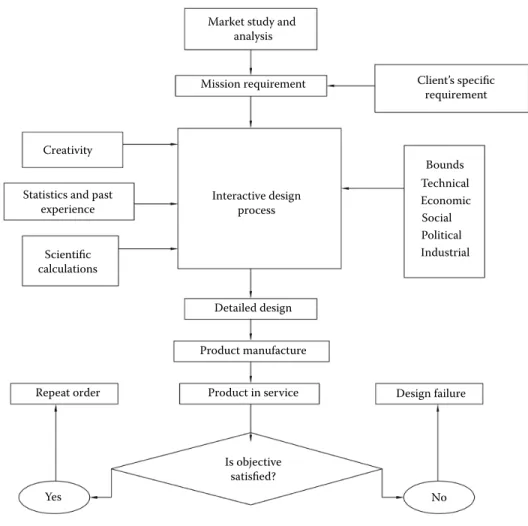
Mission Requirement
A maritime product or system design requires the understanding of the construction, maintenance, operation and decommissioning of the product (discussed in Chapter 1). Although the time spent on designing the product, sometimes only a few months, is relatively less compared to manufacturing and operating time, the design determines the efficiency and cost-effectiveness of the product or enterprise over the entire life of 15–25 years.
Market Study
- Identifying Customer Needs
- Product Design
- Relate Product to Enterprise
- Promotion
Market research also involves assessing current product availability and decommissioning existing products, thereby identifying future demand. Note: Merchant ships with marine movement of 100 GT and above; figures at the beginning of the year.).
System Design
- Features of a Marine Product
- Sustainability
- Subsystems and System Components
- System Integration
The subsystems/components at the lowest level must be designed correctly in the beginning. At a higher level of system integration, solutions for all subsystems must be integrated to provide overall system success.
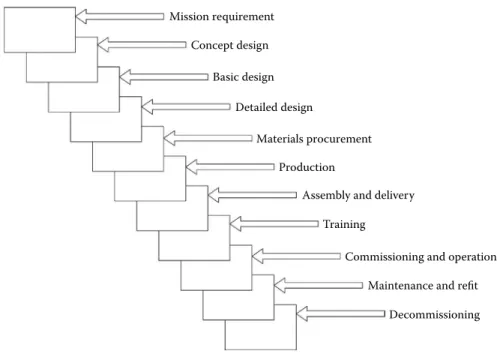
Design Process
- Sequential Design Process
- Concurrent Engineering in Design
- Point-Based Design
- Set-Based Design
Alternatively, if we view the design process as occurring within this frustum, all design activities can be seen at any interior point. To reduce the design time, concurrent engineering concepts can be adopted at different stages in a general way to get one workable solution.

Design Stages
This is done by cutting the design spaces so that the space common to all subsystems is identified. All information in the design drawings for production must provide detailed information up to the craftsman level.
Information Generation and Management
The better the design information at the detailed design stage, the better and more accurate the execution of work. To carry out the above functions and the design process efficiently, an efficient computer-based information management system is needed, which can collect, store and update information, selectively retrieve information as and when needed and utilize this information to generate further information.
Communication
Such an information system can be developed as life cycle modelling, commonly known as a 'product model'. Another definition of a product model is: 'A digital representation of a real or abstract object, described by a collection of graphic and non-graphic attributes, as well as relationships with other objects, such that the collection covers the full lifecycle of the product and is conceptually appears to reside in a single repository'.
Design Tools
- Data Collection and Statistical Analysis
- Scientific Knowledge Base and Computer Software
Collection of data and proper analysis can be used for future predictions and forecasts, although this should be done with care. For this, it is necessary to have sufficient knowledge to select the specialist or experimental facility where required simulation study and analysis can be performed and prediction can be performed.
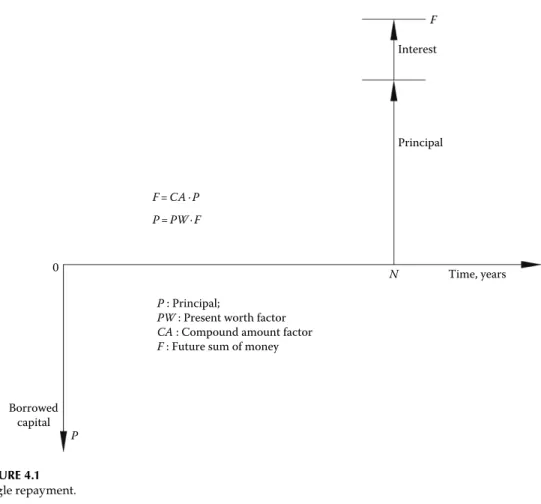
Interest Relationships
Similarly, a factor or multiplier called the present value factor PW can be used to convert a future sum of money F to the present value P, which is the inverse of the compound amount factor. The inverse of SF is the composite series amount factor SCA, which is used to obtain a future sum of money F from a series of annual investments A.
Economic Criteria
- Net Present Value
- Required Income
- Internal Rate of Return or Yield
- Permissible Price
- Payback Period
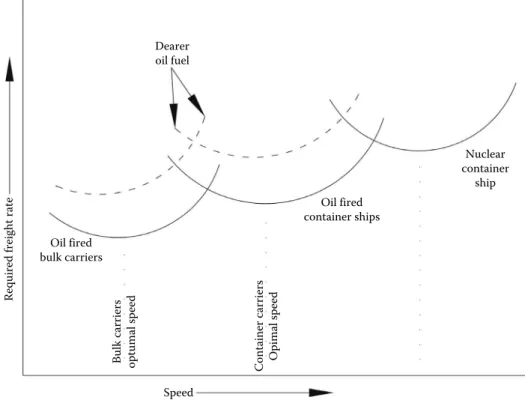
The NPV is a measure of net profit and therefore a good benchmark for evaluating product performance. In the case of a commercial ship, the required revenue can be further reduced to the required freight rate (RFR), which yields the required revenue to cover all costs, so that the NPV is zero.
Economic Complexities
- Loan
- Stage Payment
- Subsidy
- Escalation
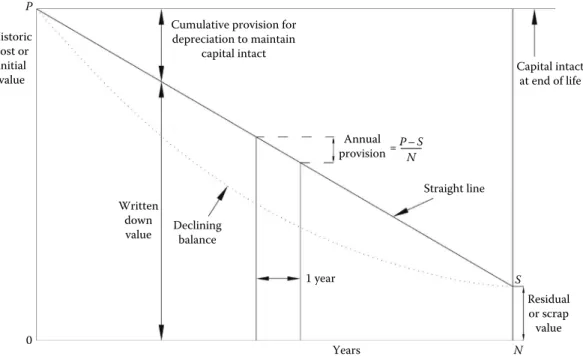
- Depreciation
- Taxes
The actual investment is the present value of money paid as owner's own contribution and that of the repayments made. In the declining balance method, the allowance is a fixed percentage of the remaining asset value.
Cash Flow Calculation
However, it is assumed that the invested capital is converted into assets of the company and a capital (or depreciation) deduction is made to reduce the pre-tax return. For products that require heavy investment, loan repayment is typically a large portion of the total annual cost.
Building Cost Estimation
- Material Cost
- Labour Cost
- Direct Cost
- Indirect Expenses
- Production Quantum
- Production Rate
- Financial Complications
- Labour Rate
- Stages of Building Cost Estimation
A large part of the total cost cannot be billed directly to the product account, but is incurred due to construction. The ratio of the highest to the lowest work rate can be up to 20 times.
Determination of Price
An order for the construction of a marine facility or vehicle is obtained on the basis of a bid price, which is a function of a pre-contractual cost estimate. This detailed cost calculation is required to create the required enterprise-based shipbuilding cost formulation.
Design versus Tendering and Contract
The contract is also a legal document which specifies how the developer and the developer can resolve disputes. The following are the reasons: (1) the real value of contractual money received by the client during the delayed periods decreases and there is a significant loss, (2) loss due to payment of penalty due to late delivery, (3 ) disruption of the construction schedule for the shipbuilder due to a delay in a ship and consequent expenses under "overheads".
Engineering Economics Application to Ship Design
- Ship-Operating Economics
- Application to Ship Design
- Comparison of Alternative Designs
- Uncertainties in Ship Design
- The Optimal Ship
Maximum NPV is achieved by CD with the maximum allowed size of the vessel for the trade. The initial cost of the machinery increases approximately as the square of speed, increasing the ship's capital cost.
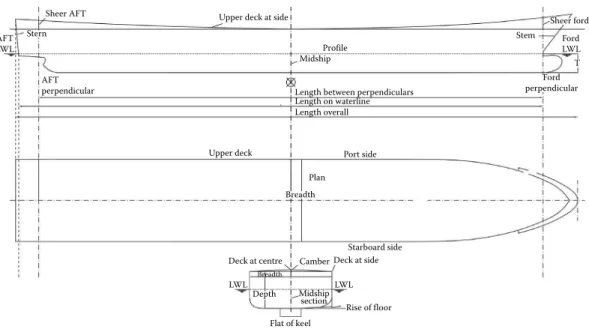
Ship Nomenclature
The longitudinal distance between AP and FP is the length between verticals (LBP) of the ship. The capacity or volume of a ship or of any compartment enclosed by molded dimensions is molded capacity.
Data Collection and Analysis for Parameter Estimation
- Midship Area Coefficient
- Water Plane Area Coefficient
B for load-bearing girders) Linear (LBP vs. LBP ratio–width and depth of load-bearing girders. volume-based designs) have different ratios. Maneuvering Longitudinal strength Hull volume Behavior at sea Vessel cost Width (B) Length (L/B ≤ 4 for small vessels and up to , 6.5 for merchant vessels) Resistance.
Basic Ship Method of Parameter Estimation
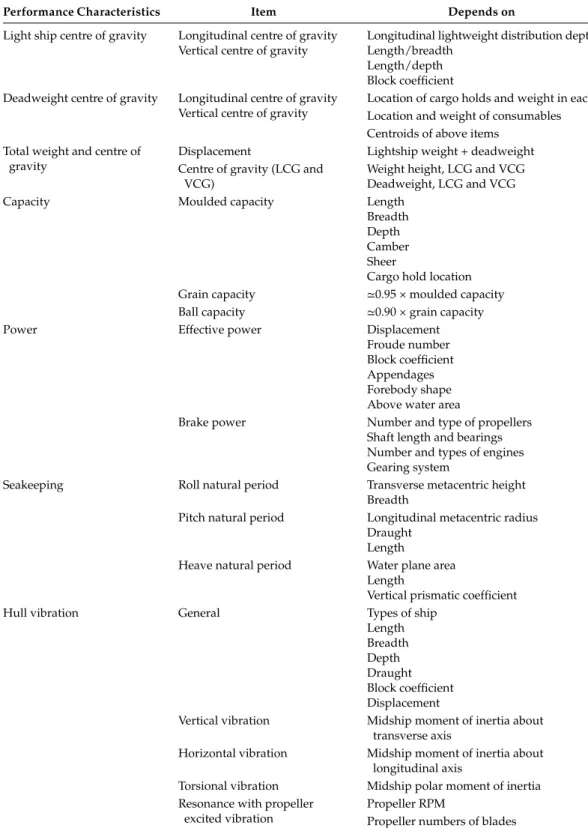
Preliminary Performance Estimate
- Moment of Inertia of Water Plane
Vertical center of gravity Location of cargo carriers and weight at each location and weight of consumables Centroids of above items. In the case of a body floating in water, this is achieved because the downward force, the body's weight, is equal to the upward force which is equal to the weight of the displaced water and the center of gravity and the center of motion. in the same vertical or, for a vessel, LCB = LCG.
Bonjean Curves and Hydrostatics
It is necessary to understand and estimate the geometric properties of the body so that its mechanics in water can be properly studied. The three-dimensional ship body can be cut by a plane that generates two bodies on either side of the cut plane.
Stability at Small Angles
GMT can be calculated knowing the hydrostatic characteristics of the ship and the height of the ship's center of gravity (CG) above the base (K) as follows. When the ship is in ballast, the ballast water is carried in the wing tanks at a considerable distance from the center of gravity, and the circulation radius is greater than that for the loaded condition.
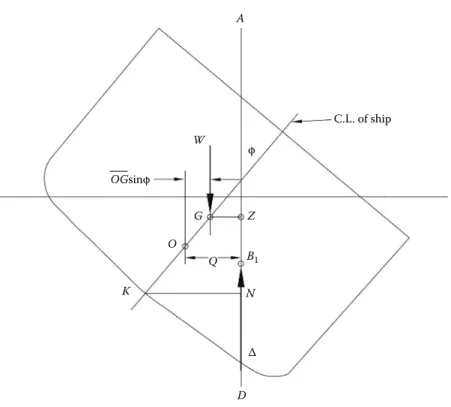
Stability at Large Angles
- Righting Lever of Floating Bodies
- Righting Lever of Submerged Bodies
- Free-Surface Effect
- Grain Shifting Moment due to Carriage of Bulk Dry Cargo
The area under the righting arm curve between 0 and ϕ is referred to as the ship's dynamic stability (sometimes referred to as dynamic stability) up to angle ϕ. A pitching moment due to crowding of passengers to one side varies in the same way as the cosine of the angle of inclination.
Intact Stability Requirements
It can be observed that each of the SOLAS intact vehicle stability conditions can only be satisfied up to a certain value of KG (VCG) and if the KG value exceeds this limit, the condition would be violated. The limiting envelope of the curves defines the maximum KG value that the ship should not exceed in any operating condition at this displacement.
Effect of Parametric Changes on Stability
- Effect of Change of Breadth on Stability
- Effect of Change of Depth on Stability
- Effect of Change of Form
Figure 6.11 shows that the increase in width causes an increase in the submerged volume, as a result of which the draft of the ship decreases to such an extent that W2 + W3 = W1. The cargo CG also goes up due to the increase in cargo volume in the upward direction.
Discussion on Stability
Waves can have a significant effect on static stability, particularly by following or overtaking waves of close ship length. Breaking seas impose a rocking heel-and-toe (roll-and-pitch) combination on the ship.

Damaged Stability
To perform damage stability calculations, the load (Δ,LCB,LCF etc.) in the original intact condition and the associated equilibrium draft and trim must be known. When a compartment is damaged, the rate at which water enters the damaged compartment depends on the degree of rupture of the outer hull.
Safety and Subdivision
The value of s is determined from the GZ curve and heeling moments due to passengers, wind or launching of rescue vessels. The obtained subdivision index is obtained by summing the values of p in si for each individual room and group of rooms.
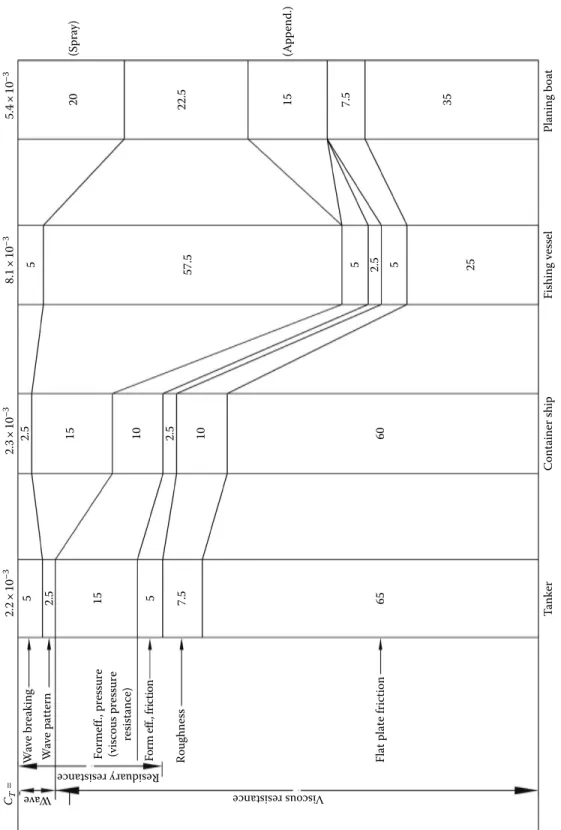
Resistance
- Components of Total Resistance
- Shallow-Water Effects
- Methodical Series
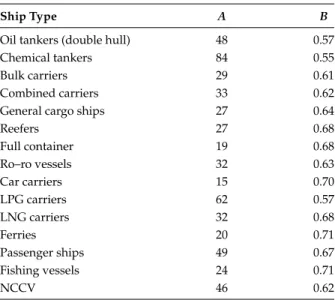
- Resistance Estimation by Statistical Method
- Resistance Estimation of Submersibles
- Experimental Fluid Dynamics
- Computational Fluid Dynamics
The transverse waves move in the same direction of the ship and at the same speed. The total resistance of the ship at speed VS is obtained as RTS = RVS + RWS.
Propulsion