9-9-2020
DESIGNING CENTRAL BANK DIGITAL CURRENCY FOR DESIGNING CENTRAL BANK DIGITAL CURRENCY FOR INDONESIA: THE DELPHI–ANALYTIC NETWORK PROCESS INDONESIA: THE DELPHI–ANALYTIC NETWORK PROCESS
Bastian Muzbar Zams Bank Indonesia - Indonesia Ratih Indrastuti
Bank Indonesia - Indonesia Akhmad Ginulur Pangersa Bank Indonesia - Indonesia Nur Annisa Hasniawati Bank Indonesia - Indonesia Fatimah Az Zahra Bank Indonesia - Indonesia
See next page for additional authors
Follow this and additional works at: https://bulletin.bmeb-bi.org/bmeb Recommended Citation
Recommended Citation
Zams, Bastian Muzbar; Indrastuti, Ratih; Pangersa, Akhmad Ginulur; Hasniawati, Nur Annisa; Zahra, Fatimah Az; and Fauziah, Indah Ayu (2020) "DESIGNING CENTRAL BANK DIGITAL CURRENCY FOR
INDONESIA: THE DELPHI–ANALYTIC NETWORK PROCESS," Bulletin of Monetary Economics and Banking:
Vol. 23: No. 3, Article 3.
DOI: [https://doi.org/]10.21098/bemp.v23i3.1351
Available at: https://bulletin.bmeb-bi.org/bmeb/vol23/iss3/3
This Article is brought to you for free and open access by Bulletin of Monetary Economics and Banking. It has been accepted for inclusion in Bulletin of Monetary Economics and Banking by an authorized editor of Bulletin of Monetary Economics and Banking. For more information, please contact [email protected].
Bastian Muzbar Zams, Ratih Indrastuti, Akhmad Ginulur Pangersa, Nur Annisa Hasniawati, Fatimah Az Zahra, and Indah Ayu Fauziah
This article is available in Bulletin of Monetary Economics and Banking: https://bulletin.bmeb-bi.org/bmeb/vol23/
iss3/3
DESIGNING CENTRAL BANK DIGITAL CURRENCY FOR INDONESIA: THE DELPHI–ANALYTIC NETWORK PROCESS
Bastian Muzbar Zams*, Ratih Indrastuti**, Akhmad Ginulur Pangersa***, Nur Annisa Hasniawati****, Fatimah Az Zahra*****, Indah Ayu Fauziah******
* Corresponding author. Payment System Policy Department, Bank Indonesia, Email: [email protected]
** Payment System Policy Department, Bank Indonesia, Email: [email protected]
*** Payment System Policy Department, Bank Indonesia, Email: [email protected]
**** Payment System Policy Department, Bank Indonesia, Email: [email protected]
*****Payment System Policy Department, Bank Indonesia, Email: [email protected]
******Payment System Policy Department, Bank Indonesia, Email: [email protected]
The emergence of stablecoins is a growing concern for authorities worldwide including Indonesia as it could affect financial stability. Thus, if a central bank chooses to develop a central bank digital currency (CBDC) to tackle this problem, the design should conform to the country’s characteristics and consumer needs. This study draws on experts’ opinions from various economic agents and utilises an amalgamation of the analytic network process (ANP) and the Delphi method to show that the cash-like CBDC model is the most appropriate digital currency design for Indonesia, since it could enhance financial inclusion and reduce shadow banking in Indonesia.
Article history:
Received : October 16, 2019 Revised : January 19, 2020 Accepted : July 16, 2020 Available online : August 21, 2020 https://doi.org/10.21098/bemp.v23i3.1169
Keywords: Digital currency; Central bank digital currency; Payment systems; Analytic network process; Delphi method.
JEL: E40; E42; C10; C80.
ABSTRACT
I. INTRODUCTION
In this study, we identify the most suitable CBDC design for Indonesia. The presence of digital currencies as a result of technological innovation and the need to reduce the use of cash presents new challenges for economic agents, including central banks. These changes in the payment landscape are marked by new players offering the provision of virtual currency, as well as, by big technology (big tech) and financial technology (fintech) firms providing financial services (BIS, 2020).1 While providing alternatives to traditional payment systems, which have the potential to lower transaction costs, digital currencies also pose significant risks and problems (Latimer & Duffy, 2019). Cryptocurrencies, such as Bitcoin and Ethereum, are highly volatile and lack guaranteed convertibility and security (Beau, 2020).2 The recent introduction of stablecoins solves this issue of price stability3. However, it does not offer services, in terms of asset settlements, especially those used interchangeably between commercial bank money and central bank money (Beau, 2020). Despite the fact that big tech and fintech firms are ushering in a more consumer-centric experience through the use of data analytics, customer omnichannels which overlay services, and lending provisions (P2P), the credit risks involved in using stablecoins are high (Petralia, Philippon, Rice, & Veron, 2019). These firms have grown significantly in China, and are starting to become more active in other developing countries, such as India and Indonesia (Petralia et al., 2019), although only concentrated in major cities for the latter (Iman, 2018).
Alongside with its prominent millennial population4, massive internet penetration5, immense electronic money adoption6 and 130 million Facebook users7, Indonesia is a huge potential market for stablecoins penetration, especially for the Facebook Libra platform. Although Indonesia prohibits the use of digital currency (including stablecoins) as a means of payment, the public has the opportunity to own and use Libra as a cryptoasset if the asset is traded in Indonesia through an official exchange (registered under the authority of Bappebti8). Thus, there is a risk of regulatory arbitrage in the use of cryptoassets that can still be used as a medium of exchange, especially for online/e-commerce transactions. Therefore, the risks to
1 Advances in financial technology (fintech) is one of the major drivers in the rapid growth of non- bank institutions that provide financial services, namely shadow banking (see Sheng & Soon, 2016).
2 The volatility of these digital currencies could worsen following the disruption of markets, which has been fueled by the COVID-19 pandemic (see Devpura and Narayan, 2020; Iyke, 2020a,b; Phan and Narayan, 2020; Vidya and Prabheesh, 2020; Narayan, 2020a, b, c; Salisu Sikiru, 2020; Narayan et al. 2020).
3 Stablecoins are digital currencies which rely on a set of stabilization method to minimize the fluctuation of its values (Bullman, Klemm, & Pinna, 2019). The first stable coin is “Realcoin” and later renamed into “Tether” which was first announced in July 2014.
4 Indonesia Central Bureau of Statistics projects that Indonesia’s millennials (i.e. the population age between 21 – 36) would be 63,5 million people by 2020 (IDN Research Institute, 2020).
5 Indonesia is the fourth largest country with the highest number of internet users in the world (171,26 million users), after China (854 million users), India (560 million users), and United States (313,2 million users) (Statista, 2020).
6 The growth rate of electronic money adoption is 70,7% per annum as at May-2020 (Bank Indonesia).
7 See Statista (2020).
8 The commodity futures trading supervisor in Indonesia.
the financial system stability and consumer protection issues need to be addressed if stablecoins become publicly accepted.
Various policies are embraced by central banks, so that households and businesses can still have secure and efficient payment choices (BIS, 2020). In China, the central bank improved information transparency and ensured that the circulation of money outside of the bank will return to the banking system, by providing payment system infrastructure, as well as, imposing prudent regulations (Qian, 2019). However, these proved to be costly, in terms of its regulation and policy. Meanwhile, other central banks chose the CBDC in smoothing the payment system and improving the soundness of monetary policy (Qian, 2019). Since developing the CBDC is also very costly and risky for central banks (Zang, 2020), proper planning is required.
These issues triggered several central banks to develop their CBDCs and spurred a growing research on CBDCs. Initially, there were two major types of CBDC studies: firstly, those which focused on the definition and characteristics of CBDCs (see, for example, CPMI, 2015; Gouveia et al., 2017; Bech and Garratt, 2017) and secondly, studies which explored the use of CBDCs (see, example, Boar et al., 2020; Meaning, 2017). However, the literature is still at the nascent stage and does not explore the design process of CBDCs. Nevertheless, understanding what goes into the designing of CBDCs is necessary to meet the everchanging public needs and to conform to a country’s unique characteristics.
Like in other countries, the literature on CBDCs in the Indonesian context is limited and is dominated by the central bank’s studies.9 In general, the Indonesian CBDC literature can be divided into three major group of studies: those focusing on the description of the CBDC and its uses worldwide (such as, Peranginangin et al., 2006; Hutabarat et al., 2016, 2018); those focusing on the potential implications of CBDC implementation (Yosamartha et al., 2017); and those focusing on designing the CBDC scheme for Indonesia (Bank Indonesia, 2018). The last group is quite unique, because such studies are very scarce. In fact, to our knowledge, only Bank Indonesia (2018) offered recommendations for implementing the CBDC scheme in Indonesia. However, since all these studies were conducted by the monetary authority, they did not offer a conceptual CBDC model that fits Indonesian conditions because they were mainly derived from regulators’ perspective.
Moreover, these studies only relied on literature review and excluded a systematic approach to designing the CBDC model. Therefore, further research is necessary to better understand the motivation and design criteria of the CBDC.
Hence, this study constructs a conceptual framework to identify the most suitable CBDC design for Indonesia. Based on this conceptual framework, the study also analyses and proposes a specific CBDC model, which corresponds to the Indonesian conditions by utilizing primary data, unlike previous studies.
We expand the CBDC literature, in general, by exploring the CBDC design through systematic decision-making process, and by taking into consideration the perspective of regulators, academicians and market practitioners in Indonesia. To achieve this goal, we introduce a novel method, which combines the ANP and
9 It should be noted that even though the central bank have extensive research on CBDC, it cannot be concluded that Indonesia will implement CBDC in the near future.
the Delphi method, robust to the endogeneity problem. Our Delphi–ANP method involves regulators, academicians, and experts, prioritizing the best model criteria by considering interdependencies between the criteria. We then further refined the model using the Delphi method to identify the CBDC model criteria appropriate for Indonesia.
The study revealed that the CBDC model best suited for Indonesia is the cash- like CBDC model, a general-purpose (retail) CBDC, which shares very similar characteristics to traditional currencies, in that it is universal, anonymous, peer-to- peer, and non-yield bearing. This finding is similar to the CBDC models currently developed by the People’s Bank of China (PBoC), which PwC (2019) suggests is similar to the current Indonesian fintech landscape.
Regulators and market practitioners can benefit from this study, since it designs and implements a suitable CBDC model for the Indonesian environment.
Our study offers a fresh perspective on CBDCs as it develops a novel approach, combining the Delphi method with the ANP method, and uses experts’ opinions to derive the most suitable CBDC model for Indonesia. Our approach can therefore be combined with existing exploratory-based approaches to design robust CBDC platforms for countries like Indonesia.
The remainder of this paper is organized as follows. Section 2 explores the literature on CBDCs and how it relates to the implementation of a CBDC in Indonesia, Section 3 explains our methodology, Section 4 discusses the findings, and Section 5 concludes the paper.
II. LITERATURE REVIEW
The development of digital currency is inseparable from the thought of Friedrich Hayek10, a Nobel Laureate in economics, who suggested that the government should not have monopoly over the issuance of money (Hayek, 1990). The introduction of Bitcoin in 2008 could end the monopoly of money creation from the central bank as Hayek thought (Nabilou, 2019; Gans & Halaburda, 2015)11. Since 2008, Bitcoin and several other digital currencies12 have become alternative means of payment, despite state money (Dwyer, 2015). On the whole, these currencies brought upon major innovations to the traditional payment system: changing physical currency to its digital form, private issuance, and technological innovation (Auer & Bohme, 2020; Velde, 2013). Currently over 600 digital currencies operate throughout the internet and substantially borderless system (Latimer & Duffy, 2019).
In response to the global spread of digital currencies, international agencies and central banks published reports assessing their shortcomings. The European Banking Authority (EBA), Financial Action Task Force (FATF), European Central Bank (ECB), and the Deutsche Bank focus on the fact that virtual currency is an unregulated digital money that can be transferred, stored, and traded electronically
10 Friedrich Hayek was an English-Austrian economist and a Nobel Laureate in economics for his theory of money and economic fluctuations (Schrepel, 2014).
11 The digital currency named Bitcoin was conceived by Satoshi Nakamoto (pseudonym identity) and made available to user group on the internet in 2008 (Elendner et al., 2018) (Dwyer, 2015) (Bohme et al., 2015).
12 Digital currencies are cryptocurrencies or virtual currencies, which do not physically exist as a coin or note (Latimer & Duffy, 2019; Motsi-Omoijiade, 2018; Michaels & Homer, 2018).
and does not have legal tender status (Mobert, 2018; ECB, 2012). Additionally, even though virtual currency operates like a currency in some environment, it could not give the public confidence that its value is relatively stable over time (Tapscott & Tapscott, 2017; Gerstein & Hervieux-Payette, 2015). As such, there is no common consensus on the definition of digital currency but a profound similarity is that it is not issued or guaranteed by any jurisdiction and is unable to perform the essential functions of money (McKinney et al., 2015). Digital currency is also too volatile to be a reliable store of value, is not widely accepted as a means of exchange, and is not used as a unit of account (BOE, 2020)
As technology continues to develop, new forms of money are also emerging.
Some privately issued stablecoins aim to overcome the shortcomings of digital currencies and provide stability of value via some form of backing (Mancini- Griffoli & Adrian, 2019). However, the emergence of stablecoins13 have become a growing concern for authorities worldwide. Stablecoins could affect financial stability, if many people make the switch, especially if a depreciation in domestic currency seems imminent (Mancini-Griffoli & Adrian, 2019).14 For example, stablecoins, such as Libra, could have broader impact because people tend to be global followers. Moreover, the use of multiplatform Libra through social media could escalate the adoption rate of stablecoins. Indonesia’s status as the third largest Facebook user in the world15 has made the country a potential market for Libra but has also exposed it to the risks associated with this currency. Stablecoins could potentially be widely adopted over existing payment systems, according to a recent study.16 But given the risks they could pose, it may be worth asking whether the CBDC can be designed to better meet people needs and conform to a country’s characteristics.17
Although the term of CBDC includes the words digital currency, CBDC is fundamentally different from digital currency. As a Central Bank Money (CeBM), CBDC is a central bank’s liability denominated in the local unit of account, which can be used as a medium of exchange and store of value (CPMI, 2018). The main difference between CBDC and digital currency is the level of centralization in the creation, settlement and destruction process, which is centralized under the control of the central bank and its status as a legal tender (Mohamed, 2020; Bohme et al., 2015; Nabilou, 2019). Bech & Garratt (2017) divide CBDC into two models, namely wholesale and general-purpose CBDC. They combine the dimension of digital currency with the taxonomy of money, known as the Money Flower.18 This taxonomy was then further developed by CPMI (2018), which stated that CBDC
13 Stablecoins create digital tokens or coins and are intended for use either in retail or wholesale payment systems, i.e. thether, libra, JPM coin, and signet (Mohacsi, 2020; G7 Working Group on Stablecoins, 2019).
14 See also G7 Working Group on Stablecoins (2019).
15 Leading countries based on Facebook audience are India (280 million), USA (190 million), and Indonesia (130 million) (Statista, 2020).
16 See G7 Working Group on Stablecoins (2019).
17 The emergence of stablecoins brings potential risk on financial integrity, anti-money laundering regime, consumer and data protection, cyber resilience and tax compliance (G7 Working Group on Stablecoins, 2019).
18 For early CBDC concept and the development of money flower taxonomy, see CPMI (2015), Bech &
Garratt (2017) and Bjerg (2017).
can be account-based or token-based. According to CPMI (2018) there are three CBDC models, namely general-purpose token, wholesale token, and general- purpose accounts.19 The motive of CBDC issuance might differ in each jurisdiction.
This motive leads to the design of CBDC based on its features, namely anonymity, availability, interest-bearing, limits on holding, and transfer mechanism (CPMI, 2018).
Over the last decade, there are more authorities working on the design and implementation of CBDC, focusing on either the wholesale or general-purpose models. Bank of Canada’s Jasper Project, Bank of Thailand’s Inthanon Project, the South African Reserve Bank’s Khokha Project, and the Deutsche Bundesbank’s Blockbaster Project are wholesale-based CBDCs used for interbank payments (Lannquist, 2019; Deutsche Bundesbank, 2018). Moreover, the wholesale CBDC in cross-border payments has been explored by the European Central Bank and the Bank of Japan in the Stella Project, as well as, by the Monetary Authority of Singapore in Project Ubin (Lannquist, 2019). These CBDC projects are generally running on the Distributed Ledger Technology (DLT) based platforms.
Unlike the wholesale CDBC model, the general-purpose CBDC is conducted either on the DLT or non-DLT platforms. The Riksbank, People Bank of China, and governments of Tunisia and Venezuela utilised the DLT on their CBDC pilot (Shirai, 2019). In contrast, the Dinero Electronico Project by Bank of Equador and the e-Peso Project by Bank of Uruguay were conducted on non-DLT based platforms (Barontini & Holden, 2019). All in all, the chosen CBDC model has a correlation with the motive of the central bank or government as the issuer. The general-purpose CBDC model is broadly related to issues around cash, responding to dwindling use, dollarization, shadow banking or financial inclusion, while the motivation for using wholesale CBDC is to improve payment efficiency and safety (Barontini & Holden, 2019).
Prior studies on CBDC focused more on its implications, particularly on the stability of the financial system, monetary policy, as well as, on the payment system (CPMI, 2018; BOE, 2020). Besides, most of these studies only provide an overview of the CBDC models that are being implemented in emerging economies (Boar et al., 2020; Shirai, 2019; Barontini & Holden, 2019; Hileman & Rauchs, 2017). As an emerging economy, there is also a growing interest to deepen the understanding of CBDCs in Indonesia.
The literature discussing CBDCs in Indonesia is scarce, and the few studies are mostly conducted by the central bank. This literature covers the description of CBDC concept and its worldwide use (Hutabarat et al., 2018; Bank Indonesia, 2017; Perangingangin et al., 2016), the potential implications of CBDCs, with respect to monetary policy, financial stability, payment system, information technology, and legal aspects (Kinanthi et al., 2019; Sahabat et al., 2017; Harahap et al., 2017; Yosamartha et al., 2017; Trianti et al., 2017; Bank Infonesia, 2017), and the design of CBDC for Indonesia (Bank Indonesia, 2018). However, none of these
19 Following CPMI (2018), the term ‘general purpose (GP)’ refers to the CBDC that is intended for use by anyone (broad access) and ‘wholesale’ refers to the CBDC, which accessible to selected parties.
The GP model could be arranged in a token or account based, while the wholesale CBDC can ideally be implemented in token form only.
studies utilised primary data. We add to these studies using primary data and a systematic approach in order to propose the most suitable CBDC model for Indonesia. This CBDC model takes into account the country’s conditions and will therefore minimize the risks associated with digital currencies.
Nugroho (2018) evaluates CBDCs based on their transaction cost.20 He focuses on finding which economic agent will bear most transaction costs when CBDCs are introduced. Our study follows Nugroho (2018), in that it involves the opinions or perspectives of other entities—beside central banks—to minimize biases in the determination the most suitable CBDC design for Indonesia. However, unlike Nugroho (2018), our study involves a wide range of experts, in order to better represent various agents in the economy. The range of respondents are from the fiscal regulatory, diverse divisions of the central bank (monetary, macroprudential, and payment system divisions), commercial banks, academicians, and payment system providers (fintech), since Indonesia is one of the countries, whose fintech industry is growing rapidly in Southeast Asia (Euromonitor, 2020; PwC, 2019;
Minerva, 2016). These experts’ opinions formed the foundation on which we devised the CBDC model that conforms to the country’s characteristics.
Our study is also in line with Auer & Bohme (2020), who contended that the design of a CBDC model should be based on an approach that caters for consumer needs. We show that the cash-like CBDC model is the most applicable design for Indonesia using the Delphi–ANP approach, which draws on experts’ opinions.
This general-purpose model could enhance financial inclusion and reduce shadow banking that tend to be challenges in emerging economies (Boar, Holden, &
Wadsworth, 2020; Qian, 2019).
III. DATA AND METHODOLOGY A. Data
The study uses primary data derived from in-depth interviews, Focus Group Discussions (FGD) and questionnaires. Our sample involved 18 respondents, who represent economic agents, such as the government (central bank and fiscal regulator), firms (commercial banks and payment system providers/fintech providers), and individual/households (academicians). The number of respondents in this study outweighs the ideal number for organising small FGD, which generally range from four to six respondents (Gibbs, 1997). However, according to Ascarya (2014), Sakti et al. (2019), and Ziglio (1996), mastery and competence in their respective fields are the most important factors to be considered when selecting respondents for the ANP–Delphi method. Hence, the number of respondents does not matter.
20 Nugroho (2018) use transaction cost economics (TCE) framework to evaluate CBDC design. The coverage of transaction costs consists of three transactional dimensions: uncertainty, transaction frequency, and asset specificity.
B. Research Methodology
Our study can be considered as a frontier research, since the CBDC has not yet been implemented in any country. Therefore, the ANP method is utilised to organise thoughts, experiences, and to elicit judgments recorded in memory and quantify them in the form of priorities, as well as, allow for the representation of diverse opinions after discussion and debate (Saaty & Vargas, 2006). The ANP method helps by providing a decision-making framework for choosing the best CBDC model for a country. While Boar et al. (2020), Shirai (2019), Barontini & Holden (2019), and Nugroho (2018) used a survey to conduct further analysis about CBDC designs in certain jurisdictions, we use the ANP method to gain a deeper understanding about a CBDC design which conforms to a country’s characteristics and any other important criteria. The model is then be further refined using the Delphi method to identify the CBDC model criteria that accommodate local wisdom in Indonesia.
We discuss the Delphi–ANP method, in more detail, in what follows.
C. The Delphi–ANP Method
The ANP is a mathematical theory that is able to analyse the effect of elements which interact by using an assumptions approach to solve problems. The ANP method explains the dependent factors and the network feedback for decision- making through the consideration and validation of empirical experience (Saaty, 2001). By using network feedback, elements can depend on components, such as the hierarchical network, but can also be relied on by other elements (Saaty L. T., 2005). The ANP can easily be applied to decision-making, evaluation, forecasting, mapping, strategising, and the allocation of resources (Saaty & Vargas, 2006).
The Delphi method uses a survey approach, consisting of two or more repetitive processes to collect data and refine data, with the series of processes and analyses accompanied by feedback (Hsu & Sandford, 2007). This method encourages participants to give an opinion and an initial assessment of the formation of the CBDC model in Indonesia. The main characteristic of the Delphi method is the participant feedback process that can be controlled to reduce noise through a problem-solving orientation. The Delphi method contains a scope for evaluating, finding facts, exploring problems, and being a flexible tool for analysis.
As discussed in III.1, we collected data through FGDs made up of regulators, academicians, and practitioners. By combining the Delphi method with the ANP method, we involved experts in a participatory and consensus development process to eliminate inaccurate information about CBDC with respect to the Indonesian economic conditions. Following Ascarya (2014), the Delphi–ANP method is displayed Figure 1.
We delivered questionnaires to respondents in order to establish the criteria and elements formed. After receiving the responses from the respondents, we refined the questionnaires, redistributed, and recollected them to ensure that they are well-structured. We then reused the compiled questionnaires as a questionnaire instrument in the second round of data collection. The construction of the ANP model is based on theoretical and empirical literature reviews and poses questions to respondents through in-depth interviews. At the in-depth interview stage, we carried out the Delphi method to obtain the final results that will determine the criteria in the ANP model.
The quantification stage of the model uses the questions in the ANP questionnaires in the form of a pairwise comparison between elements in the cluster to establish which of the two has a greater influence, where the size of the difference is on a numerical scale from 1 to 9 (Saaty, 2005; Saaty & Vargas, 2006). The influence of feedback in ANP framework requires a large matrix named supermatrix, which is outlined as follows:
Figure 1.
Delphi-ANP Method
RESEARCHER
Literature
Review Focus Group
Discussion Indepth Discussion Semi Structured Delphi
Questionnaire Structured Delphi
Questionnaire Delphi Ranking
ANP Construction Model ANP Validation Model
Pairwise Questionnaire Data Synthesis and Analysis
Result Validation Result Interpretation
EXPERT
Stage 1
Stage 2
Stage 3
Stage 4
This figure shows the Delphi–ANP method used in our study. Stage 1 starts from literature review and terminates at Delphi ranking. In Stage 2, we construct and validate the ANP model. Stage 3 designs pairwise questionnaires and synthesises and analyses data. Stage 4 validates and interprets the results.
Assume that cluster h, denoted by Ch, h=1,..., N, has nh elements. Elements in cluster h, denoted by eh1, eh1, … , , where wij is named a block of the supermatrix.
To produce the ratio scale, we use three calculations from the supermatrix (1), consisting of: (i) Unweighted Supermatrix, which is the original of column eigenvectors obtained from the paired comparison matrix of elements; (ii) Weighted Supermatrix, where each block of column eigenvector from a cluster is weighted with priority of the influence of each cluster; and (iii) Limiting Supermatrix, obtained by lifting a weighted supermatrix with a large rank (Saaty
& Vargas, 2006).
D. The Benefit, Opportunity, Cost, Risk Approach
Our Delphi–ANP method entails the Benefit, Opportunity, Cost, Risk (BOCR) approach, which helps in determining the priorities for selecting the best CBDC model based on calculating the desired criteria (benefits) and unwanted criteria (costs), as well as, the criteria based on events in the future, which may occur as positive things (opportunities) and things that can lead to negative effect (risks) (Saaty & Vargas, 2006; Simelyte et al., 2014).
The prioritised alternatives are obtained from three results: standard condition (B/C), pessimistic (B/(C×R)), and realistic ((B×O)/(C ×R)). To make the final decision, Wijnmalen (2007) and Simelyte et al. (2014) recommend employing five different synthesis methods as follows:
Additive method:
(1)
Probabilistic additive:
(2)
Subtractive:
(3)
(4)
Multiplicative
Multiplicative priority powers:
(5)
where b, o, c, and r are normalised weights of merits B, O, C, and R, respectively;
Bi, Oi, Ci, and Ri represent the synthesised results of the alternative I under merit B, O, C, and R, respectively.
Equation (2), the marginal value for short-term decision formula, in which benefit is multiplied by opportunity, divided by costs multiplied by risk for each alternative is expected yield negative results. This method obtains marginal value, and is considered as a method to synthesise a short-term decision. Meanwhile, Equation (3), the marginal value for long-term decision formula, is considered as a method to synthesise a long-term decision (Saaty and Özdemir, 2005; Saaty and De Paola, 2017).
E. Model Construction and Robustness Checks
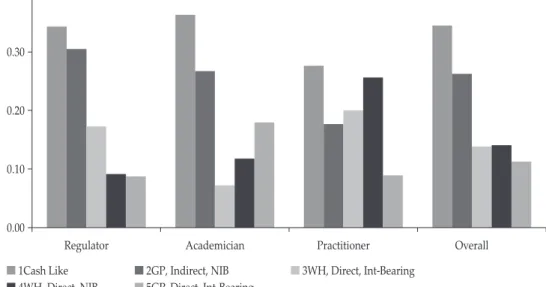
We employed a the two-layer ANP model. The first layer includes two main clusters, namely (i) strategic criteria cluster and (ii) BOCR cluster, where each of the cluster has four sub-clusters with different elements. The design of the elements are derived from the identification of problems carried out through the literature review process and strengthened through the FGD process. The second layer is BOCR cluster, which consists of sub-clusters, namely benefits, opportunities, costs and risks. Each of the sub-clusters is linked to the respective CBDC design alternative clusters consisting of model 1 (cash-like), model 2 (general purpose, indirect, non-interest bearing), model 3 (wholesale, direct, interest bearing), model 4 (wholesale, direct, non interest bearing), and model 5 (general purpose, direct, interest bearing). The two-layer ANP model is displayed in Figure 2.
In a robustness check, we analyze how the model behaves when the specifications are changed. We utilize two approaches in order to perform the robustness check. In the first, we use a conceptual framework for the one-layer ANP model to check whether the two-layer ANP model is robust. If the results change due to changes in the model are not significant or are relatively small, then we can interpret this as evidence of the structural validity of our model (Xun &
Halbert, 2014). Unlike the two-layer ANP model, the one-layer ANP model does not distinguish between alternatives in each aspect of benefit, opportunity, cost, and risk. The second approach involves using sensitivity analysis on the chosen alternative model, also understood as a dynamic analysis, used to examine the effect of variations in assessment of the stability of the final result. We performed the sensitivity analysis to determine whether the overall results (obtained using the alternative models) vary, if there is a change in the relationship, in terms of benefits, opportunities, costs, and risks (Saaty & Vargas, 2006).
(6)
IV. RESULTS AND ANALYSIS
A. Model Validity: Rater Agreement of Delphi-Likert and Delphi-ANP
The initial assessment of the Delphi-Likert process is carried out to validate the convergence of the respondents’ opinions from the Delphi FGD and to obtain a valid model construction. The assessment is processed to display the level of agreement (rater agreement) or Kendall’s W to the clusters and elements that have been formed.
The first half of Table 1 shows that, in the first round, 10 of the 11 clusters in the model reached the same consensus (or converged), as indicated by the significance (p-value) on the Kendall’s W value, which is a reflection of the value of the rater agreement. In the second round, after adjusting for outlier answers, the cluster function attains significance at the 10% level when it had previously been insignificant. Thus, there has been consensus in all clusters in the construction of the ANP model. This shows that the construction of the ANP model in this study can be considered valid.
The Delphi–ANP process is carried out to determine the consistency of the respondents’ assessment in the level of agreement of each cluster. The ranking results and opinions were recapitulated for elimination based on the five elements
Figure 2.
ANP 2-Layer Model
This figure shows the 2-Layers ANP model construction Delphi Strategic Criteria Ojective
Smooth Payment SystemEff-Safety Payment System Accurate-Transparant Account Cost of printing and handling money Access for Unbanked Centralized Fin Surveillance KYC.AMI./CFT Limiting PDC Financial Inclusion Reduce Asymmetric Inf Non Conv Monetary Infrastructure Initial Costs-Infrastructure Access of Tech New Tech & Mechanism Socialization Unsafe from, Tech, Issues Tech-Dependance Cvber Risk People Behavior Speed up Bank Run Impaired Lending Surveillance of National Efficient Money Distribution Interoperability Strengthen Financial System Medium of exchange Medium of Payment Store of Value Unit of Account Standard of Deffered Payment Universally Accepted Non-vield Bearing Anonimity Peer to peer Pseudonimus Transaction Interparty Trust Saving/Invesment Precautionary Philantropy
Function
BOCR
ANP
Cash-Like GP, Direct, NIB WH, Direct, In-bearing WH, Direct, NIB GP, Direct, Int-bearing
Benefit Opportunity Costs Risk
Characteristic Motive
that obtained the highest geometric ranking values for each cluster. The second half of Table 1 shows that 9 of the 11 clusters in the model reach convergent answers. In the second round, after adjusting the outliers among the respondents’
answers in the opportunities and cost clusters, the value becomes significant at the 10% significance level. The consensus in all clusters shows that the ANP model can be considered valid.
Table 1.
Rater Agreement of Delphi–Likert and Delphi–ANP
This table shows the value of the level of agreement (rater agreement) or W-Kendall for clusters and elements that have been formed in Delphi-Likert and Delphi-ANP. A significant level of agreement value can also be seen from the p-value at *, **, and *** denote significance at the10%, 5%, and 1% levels, respectively.
CLUSTER
Delphi- Likert Delphi-ANP
Round 1 Round 2 Round 1 Round 2
dall’s Ken-
W p-value Ken- dall’s
W p-value Ken-
dall’s
W p-value Ken-
dall’s
W p-value
Strategic
Criteria 0.175 0.098* 0.175 0.098* 0.265 0.002*** 0.265 0.002***
Objective 0.225 0.005** 0.225 0.005** 0.153 0.026** 0.153 0.026**
Function 0.098 0.272 0.147 0.088* 0.427 0.000*** 0.427 0.000***
Characteristic 0.284 0.001*** 0.284 0.001*** 0.426 0.000*** 0.426 0.000***
Motives 0.471 0.000*** 0.471 0.000*** 0.588 0.000*** 0.588 0.000***
Bocr Criteria 0.316 0.006*** 0.316 0.006*** 0.211 0.009*** 0.211 0.009***
Benefit 0.318 0.000*** 0.318 0.000*** 0.165 0.018** 0.165 0.018**
Opportunities 0.306 0.000*** 0.306 0.000*** 0.099 0.128 0.129 0.054*
Costs 0.228 0.003*** 0.228 0.003*** 0.058 0.382 0.128 0.055*
Risk 0.182 0.008*** 0.182 0.009*** 0.134 0.047** 0.134 0.047**
Alternative
(Design) 0.155 0.018** 0.155 0.018** 0.169 0.016** 0.169 0016**
B. Priority Cluster and Sub-Cluster B1. Priority Cluster in Strategic Criteria
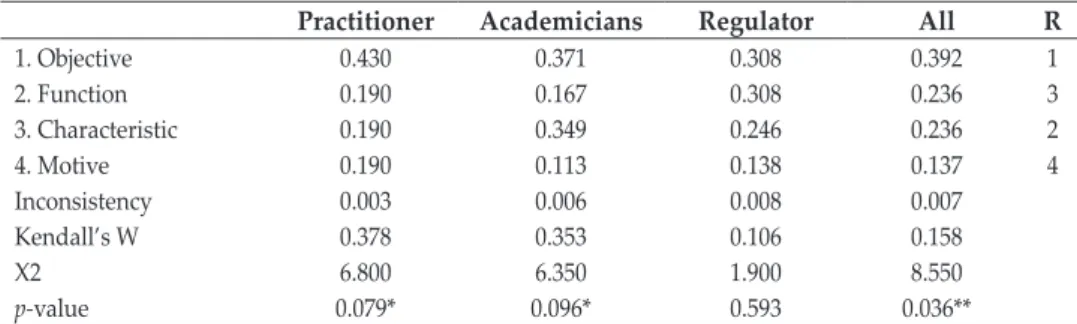
The results of the two-layer ANP with BOCR approach for the whole of the strategic criteria cluster, shown in Table 2, reveal that the main priority of the strategic criteria when establishing the CBDC model in Indonesia is objective (39%), followed by characteristic and function clusters, which have the same value (24%), and motive (14%). Meanwhile, the value of the rater agreement in the criteria strategy cluster shows the agreement value for practitioners, academician, and overall respondents. This is also indicated by the statistical significance at 10%
level (see the p-values).
Table 2 also displays the highest inconsistency values of the respondents’
pairwise comparison of answers for the relationships between clusters in the ANP network. It can be concluded that the cluster strategy consistency test results for the two-layer ANP with the BOCR approach meet the consistency requirements of the respondents’ answers because the inconsistency value is less than 10%.
B2. Priority Sub-Cluster in Strategic Criteria
The results for the two-layer ANP with the BOCR approach, in Table 3, show that the respondents generally agreed that the main strategy using the objective cluster for CBDC issuance is a smooth payment system (25%), strengthening the stability of the financial system, and interoperability (25%), followed by the supervision of national financial transactions, and efficiency of money distribution (12%). The value of the rater agreement in the objective cluster shows the agreement value for the practitioner category and overall respondents per category, as indicated by the p-values, which are significant at 5% and 10% levels.
Table 2.
Strategic Criteria Two-Layer ANP Model
This table shows the geometric mean values for the priority values of each category of respondents, the value of agreement level based on Kendall’s W and the value of the consistency of answers based on the inconsistency value in the strategic criteria cluster. Note that, *, **, and *** denote significance at the 10%, 5%, and 1% levels, respectively.
Practitioner Academicians Regulator All R
1. Objective 0.430 0.371 0.308 0.392 1
2. Function 0.190 0.167 0.308 0.236 3
3. Characteristic 0.190 0.349 0.246 0.236 2
4. Motive 0.190 0.113 0.138 0.137 4
Inconsistency 0.003 0.006 0.008 0.007
Kendall’s W 0.378 0.353 0.106 0.158
X2 6.800 6.350 1.900 8.550
p-value 0.079* 0.096* 0.593 0.036**
Table 3.
Detailed ANP Strategic Criteria Results
This table shows the geometric mean value to see the priority value of each category of respondents, the value of agreement level based on Kendall’s W and the value of the consistency of answers based on the value of inconsistencies in the Strategic Criteria cluster in detail. Note that, *, **, and *** denote significance at 10%, 5%, and 1% levels, respectively.
Practitioner Academicians Regulator All R OBJECTIVE
1. Smooth payment system 0.106 0.464 0.274 0.250 1
2. Surveillance of national transaction 0.153 0.102 0.239 0.125 5
3. Efficiency in printing & handling
money 0.294 0.123 0.062 0.125 4
4. Interoperability 0.294 0.123 0.150 0.250 3
5. Strengthen financial system stability 0.153 0.189 0.274 0.250 2
Inconsistency 0.008 0.000 0.000 0.000
Kendall’s W 0.329 0.257 0.185 0.219
Table 3.
Detailed ANP Strategic Criteria Results (Continued)
Practitioner Academicians Regulator All R
X2 7.900 6.167 4.433 15.75
p-value 0.095** 0.187 0.351 0.003***
FUNCTION
1. Medium of Exchange 0.167 0.264 0.356 0.255 1
2. Means of Payment 0.263 0.264 0.236 0.221 2
3. Store of Value 0.287 0.144 0.130 0.221 3
4. Unit of Account 0.158 0.264 0.200 0.221 4
5. Standard of Deferred Payment 0.124 0.065 0.078 0.081 5
Inconsistency 0.000 0.000 0.000 0.000
Kendall’s W 0.163 0.201 0.171 0.144
X2 3.900 4.833 4.100 10.367
p-value 0.420 0.305 0.393 0.035**
CHARACTERISTIC
1. Universally Accepted 0.430 0.377 0.397 0.442 1
2. Non-Yield Bearing 0.274 0.225 0.275 0.191 2
3. Anonymity 0.068 0.068 0.063 0.068 5
4. Peer to Peer 0.114 0.262 0.165 0.191 3
5. Pseudonymous 0.114 0.068 0.100 0.109 4
Inconsistency 0.000 0.004 0.000 0.000
Kendall’s W 0.161 0.426 0.263 0.243
X2 3.867 10.233 6.313 17.46
p-value 0.424 0.037** 0.177 0.002***
MOTIVE
1. Transaction 0.341 0.475 0.348 0.392 1
2. Interparty Trust 0.341 0.124 0.348 0.255 2
3. Saving/Investment 0.142 0.204 0.091 0.145 3
4. Precautionary 0.094 0.124 0.149 0.145 4
5. Philanthropy 0.082 0.072 0.063 0.063 5
Inconsistency 0.000 0.004 0.000 0.000
Kendall’s W 0.513 0.490 0.518 0.451
X2 12.30 11.78 12.43 32.47
p-value 0.015** 0.019** 0.014** 0.000***
The ANP results for the CBDC issuance sub-cluster function demonstrate that respondents generally agreed that “medium of change” (25%) is the most important element, followed by “means of payment”, “unit of account” and “store of value”, all of which had the same value (22%) and, finally, the “standard of deferred payment” element (8%). The value of the rater agreement in the function sub-cluster shows the value of the agreement for the overall respondent or by category, which is indicated by the significant p-value.
Regarding the CBDC motive sub-cluster, the respondents generally agreed that “transaction” (40%) is the most important element, followed by “interparty trust” (25%), then the “saving/investment” and “precautionary” (14%), and finally the “philanthropy” element (6%). Meanwhile, the value of the rater agreement in
the motive sub-cluster conveys the value of the agreement for the categories of academician, practitioners, regulators and overall respondents or per category, as shown by the p-values, which are significant at 1% and 5% levels.
The “characteristic sub-cluster” ANP results show that “universally accepted”
(44%) is the most important element, followed by “non-yield bearing” and “peer to peer” (19%), “pseudonymous” (10%) and, finally, the element of “anonymity”
(7%). The value of the rater agreement in the characteristic sub-cluster shows the agreement value for the academic category and overall respondents or per category, as shown by the significant p-values at 1% and 5% levels.
Based on the highest inconsistency score of the respondents’ pairwise comparison answers for the relationship between clusters in the ANP network, we conclude that the consistency of the objective, function, characteristic and motive sub-cluster index results for the two-layer ANP with BOCR approach meet the consistency requirement because the inconsistency value is less than 10%.
B3. Priority Cluster in BOCR
The ANP results (see Table 4) for the entire BOCR cluster that has been processed and analysed show that the top priority or the most important sub-cluster in the formation of the CBDC model in Indonesia is benefit (34%). This is followed by the risk sub-cluster (30%), then opportunities and costs (18%). The value of the rater agreement in the BOCR cluster shows the agreement value for all respondents or per category, as indicated by the significant p-value at 5%.
Table 4.
Two-layer ANP with BOCR Cluster
This table shows the geometric mean value to see the priority value of each category of respondents, the value of agreement level based on Kendall’s W and the value of the consistency level of answers based on the inconsistency value in the BOCR Criteria cluster. Note that, *, **, and *** denote significance at the 10%, 5%, and 1% levels, respectively.
Practitioner Academicians Regulator All R
1. Benefits 0.272 0.415 0.360 0.340 1
2. Opportunities 0.185 0.189 0.214 0.182 3
3. Costs 0.185 0.172 0.190 0.178 4
4. Risks 0.357 0.225 0.237 0.300 2
Inconsistency 0.000 0.004 0.000 0.004
Kendall’s W 0.144 0.189 0.186 0.156
X2 2.600 3.400 3.350 8.450
p-value 0.457 0.334 0.341 0.038**
Based on the highest inconsistency value of the respondents’ pairwise comparison answers for the relationships between sub-clusters in the ANP network, as shown in Table 4, we conclude that the consistency of the BOCR cluster index test results for the one and two-layer ANP satisfies the consistency requirement because the inconsistency value is less than 10%.
B4. Priority Sub-Cluster in BOCR
The ANP results for the BOCR sub-criteria (see Table 5) show that the respondents generally agreed that the most important element in the benefit cluster is
“payment system security efficiency” (31%), followed by “accounting records and transparency” (23%), “unbanked public access” and “centralised financial supervision” (16%), and finally “cost of printing and handling money” (13%).
Furthermore, the value of the rater agreement in the benefit cluster shows the value of the agreement for the overall respondent or per category, as indicated by significant p-value at 5%.
Table 5.
Detailed ANP BOCR Results
This table shows the geometric mean value to see the priority value of each category of respondents, the value of agreement level based on Kendall’s W and the value of the consistency level of answers based on the inconsistency value in the BOCR Criteria cluster. Note that, *, **, and *** denote significance at 10%, 5%, and 1% levels, respectively.
Practitioner Academicians Regulator All R BENEFIT
1. Efficiency & safety 0.273 0.294 0.314 0.315 1
2. Accurate & transparant 0.268 0.232 0.237 0.230 2
3. Efficiency in cost of printing & handling
money 0.158 0.147 0.100 0.135 5
4. Acces for unbanked 0.139 0.180 0.160 0.160 4
5. Centralised financial surveilance 0.162 0.147 0.188 0.160 3
Inconsistency 0.003 0.003 0.006 0.003
Kendall’s W 0.154 0.249 0.286 0.153
X2 3.700 5.967 6.867 11.033
p-value 0.448 0.202 0.143 0.026**
OPPORTUNITY
1. KYC principles & AML/CFT 0.146 0.098 0.130 0.116 1
2. Limiting private DC 0.084 0.055 0.130 0.086 4
3. Financial inclusion 0.102 0.124 0.094 0.116 3
4. Reduce asymmetric info 0.111 0.140 0.073 0.116 2
5. Monetary instrument 0.057 0.082 0.073 0.065 5
Inconsistency 0.003 0.007 0.006 0.008
Kendall’s W 0.111 0.140 0.358 0.130
X2 2.667 3.367 8.600 9.389
p-value 0.615 0.498 0.072* 0.052*
COSTS
1. Initial infrastructure cost 0.213 0.174 0.243 0.196 3
2. Access on tech 0.213 0.210 0.376 0.214 1
3. New tech & mechanism 0.196 0.125 0.127 0.196 5
4. Socialization 0.182 0.334 0.127 0.196 2
5. Technological issues 0.196 0.157 0.127 0.196 4
Inconsistency 0.000 0.007 0.003 0.003
Kendall’s W 0.155 0.167 0.203 0.090
X2 3.713 4.000 4.867 6.449
p-value 0.446 0.406 0.301 0.168
In the BOCR sub-criteria, respondents agreed that the most important elements in the opportunity cluster are “KYC AML/CFT” (12%), “reducing asymmetric and financial information” (12%), “limiting private digital currency” (9%), and “Non- conventional monetary policy instruments” (7%). The value of the rater agreement in the opportunity cluster shows the value of the agreement both in the regulator category, as well as, the overall respondents or per category, as indicated by the p-values.
Besides, the detailed ANP results for the BOCR sub-criteria indicate that the respondents generally agreed that the most important element in the costs cluster is “technology access” (21%), followed by “unsafe from technology issues”,
“socialisation and community communication”, “initial costs-infrastructure”, and
“new mechanism technology”, all recording the same value of 20%. The value of the rater agreement in the costs cluster shows the value of no agreement for the overall respondent or by category, which is supported by the insignificant p-values. The other detailed ANP results for the BOCR sub-criteria (see Table 5, “All” Column) show that the respondents generally agreed that the most important element in the risks cluster is “cyber risk” (33%), followed by “technology-dependent” (25%),
“speed up bank run” (18%), “people behaviour/mindset” (15%), and “impaired lending” (10%). The value of the rater agreement in the risks sub-cluster shows the value of the agreement for the category, as indicated by the significant p-value at 10%.Based on the highest inconsistency value of the respondents’ pairwise comparison answers for the relationships between clusters in the ANP network (see Table 5,”all” Column), we conclude that benefit, opportunity, cost and risks sub-cluster index for the two-layer ANP with BOCR meets the consistency requirements because the inconsistency value is less than 10%.
C. The Selected CBDC Design: A Synthesis of the BOCR Approach
To select the best CBDC design from the different alternatives, we use Saaty and Vargas’s (2006) approach, which compares the benefits with costs instead of using a supermatrix. We modified their benefits–costs ratio by including opportunity and risk. Table 6 shows the results of the BOCR assessment for alternative
Table 5.
Detailed ANP BOCR Results (Continued)
Practitioner Academicians Regulator All R RISKS
1. Tech-dependence 0.219 0.310 0.243 0.246 2
2. Cyber risk 0.27 0.310 0.376 0.328 1
3. People behavior 0.205 0.126 0.127 0.148 4
4. Speed up bank run 0.219 0.126 0.127 0.176 3
5. Impaired lending 0.087 0.126 0.127 0.103 5
Inconsistency 0.003 0.004 0.003 0.000
Kendall’s W 0.354 0.224 0.199 0.084
X2 8.500 5.367 4.767 6.022
p-value 0.075* 0.252 0.312 0.197
specifications of the CBDC model. The best specification of the CBDC model is the one with the highest estimated value.
In order to evaluate the best model for the BOCR approach, we use several BOCR-based formulas, following the Naenna and Jiamruangjarus (2016), Simelyte et al. (2014), and Wijnmalen (2007), namely additive, probabilistic additive, subtractive, multiplicative priority powers, and multiplicative formulas. The results are shown in Table 6. We use a multiplicative formula in order to determine short-term priorities and the probabilistic additive method to synthesise long-term decisions.
Table 6.
BOCR Synthesis Results
This table shows the BOCR synthesis group values for alternative models based on the type of their respective formulas.
Alternatives
BOCR Probabilistic
additive Subtractive Multiplicative
priority powers Additive Multiplicative
1. Cash Like 0.2076 0.3468 0.2048 0.2923 0.2035
2. GP-Indirect-NIB 0.1987 0.1757 0.2004 0.2440 0.1731
3. WH-Direct-IB 0.1937 0.0780 0.1914 0.1487 0.1766
4. WH-Direct-NIB 0.1939 0.0823 0.1925 0.1490 0.1823
5. GP-Direct-IB 0.2061 0.3171 0.2109 0.1660 0.2643
Figure 3.
ANP Results–Short-Term Alternative
This figure shows the best alternative models in the short run based on multiplicative formula
0.00 0.05 0.10 0.15 0.20 0.25
0.30 1Cash Like 2GP, Indirect, NIB 3WH, Direct, IB 4WH, Direct, NIB 5GP, Direct, IB
Based on Figure 3 above, we conclude that the most prominent model chosen by respondents in the short term is Model 5, namely GP, direct and interest-bearing.
In addition, the second most prominent is Model 1 (cash-like), followed by Model 4 (WH, direct and non-interest-bearing), Model 3 (WH, direct and interest-bearing), and Model 2 (GP, indirect and non-interest-bearing). Thus, when it comes to the initial appeal of CBDC use from the community’s perspective, Model 5 can be a
public alternative to replacing the private digital currency. However, this model cannot be used in the long-run because it can potentially cause the transfer of bank deposits to the CBDC (bank deposit outflow) and change the banking system to narrow banking. If there is a significant bank deposit outflow, then banks can no longer rely on liabilities in the form of public savings.
Figure 4.
ANP Results – Long Term Alternative
This figure shows the best alternative models in the long run based on subtractive formula
0.185 0.190 0.195 0.200 0.205 0.210
1Cash Like 2GP, Indirect, NIB 3WH, Direct, IB 4WH, Direct, NIB 5GP, Direct, IB
From Figure 4, we can conclude that the best model chosen by the respondents in the long term is Model 1, namely cash-like, which is followed by Model 5 (GP, direct and interest-bearing), Model 2 (GP, indirect and non-interest-bearing), Model 3 (WH and interest-bearing), and Model 4 (WH, indirect and interest- bearing).
The choice of the cash-like model is appropriate because the cash-like CBDC design involves high fees and thus requires a relatively long period of preparation.
Besides, the chosen cash-like CBDC design is in accordance with the predictions of Six Group (2019), which argues that cash-like currency will replace currency as a medium of exchange. However, currency will continue to be used as a store of value and thus physical money will still be used. This is based on a consideration of the need for business process sustainability in the event of power disruptions, natural disasters, and others. Therefore, PwC (2019) added that any consideration for issuing CBDC by the central bank should not ignore currency but rather develop alternative payment methods and options for saving money.
Furthermore, the cash-like design chosen by experts in Indonesia is in line with the notion of CBDC issuance as a method of payment that is not concerned with convenience for consumers based on digitalisation trends. This is in line with the view of RBNZ (2018), which argue that the most suitable characteristics of CBDC are the cash-like model. These relate to the characteristics of digital currency in that it can be exchanged in cash, it can be accessed by the public without certain
restrictions, the public cannot borrow from the central bank, and the central bank does not pay interest on digital currency.
D. Robustness Checks
We examine the robustness of our results using two methods. First, we vary the BOCR approach to see whether the results are sensitive to this variation. Second, we compare the two-layer ANP results with the one-layer ANP results.
D1. Sensitivity of the Results to Variation in BOCR
In this sensitivity analysis, we examine whether the results are sensitive to the specification of the BOCR. Following (Saaty, 2006), we vary the relationship in terms of benefits, opportunities, costs and risks, and report the results in Figure 5. Figures 5 shows that each model experiences insignificant changes when the relationship changes (i.e. benefit, opportunity, cost, and risk). The changes that arise do not alter the order and we thus conclude that Model 1 is the best result based on the ratings given by the respondents.
Figure 5.
Sensitivity BOCR Graph
This figure shows the value of the sensitivity of the model when it is connected to the sub-cluster of benefits, opportunities, costs and risks.
0 100000 200000 300000 400000
1 2 3 4 5 6 7
Sensitivity Benefit Graph
1Cash-like 2GP, Indirect, NIB
5GP, direct, IB
3WH, direct, IB 4WH, direct, NIB