Development of a Bending Fatigue Testing Method for Rings from a CVT-Pushbelt
Master of Science Thesis
February 15, 2013 L.J. van Leeuwen
Delft University of Technology
II
III
Title: Development of a Bending Fatigue Testing Method for Rings from a CVT-Pushbelt.
Author: L.J. van Leeuwen
Date: February 15, 2013
Student nr.: 1324969
Institute: Delft University of Technology Faculty of Mechanical Engineering
Department of BioMechanical Engineering Board of Examiners:
Prof. Dr. Ir. J.L. Herder, BioMechanical Engineering, TU Delft Dr. Ir. D.H. Plettenburg, BioMechanical Engineering, TU Delft
Dr. Ir. E.J.H. de Vries, Precision and Microsystems Engineering, TU Delft Ing. J.P. Elkhuizen, Bosch Transmission Technology B.V.
Ir. M.D. Tran, Bosch Transmission Technology B.V.
IV
V
P REFACE
This thesis contains the research that is done for the development of a bending fatigue testing method for rings from a CVT-pushbelt. It is the conclusion of the master education Mechanical Engineering at Delft University of Technology.
The thesis starts with the paper that is written as a result of this research and is followed by the appendixes. The appendixes mainly contain smaller researches that are done to support and to elaborate on the global research discussed in the paper. At the end of this thesis a literature study can be found that was carried out earlier which forms a basis for this thesis.
The research is done in collaboration with Bosch Transmission Technology B.V. formally known as Van Doorne Transmissie in Tilburg, The Netherlands. This company is the inventor and manufacturer of the pushbelt that is used for continuously variable transmission in cars.
I would like to thank Duc Tran and Jan-Peter Elkhuizen of Bosch Transmission Technology for their supervision and for giving me the opportunity to do this research at the company. Also I would like to thank test operator Jean-Pierre van Eijndhoven for helping me with the practical side of this research. From Delft University of Technology I would like to thank Just Herder for the guidance and feedback I received during this graduation project.
L.J. van Leeuwen
February 2013, Delft
VI
VII
T ABLE OF C ONTENTS
Paper: Development of a Bending Fatigue Testing Method
with Application on Rings From a CVT-Pushbelt ... 1
Appendixes ... 9
A. Proof of Concept ... 11
B. Proof of Concept in Simulink ... 15
C. Construction Options ... 19
D. Testing of Concept Model ... 25
E. Concept Model in Simulink ... 31
F. Current Fatigue Test ... 37
G. Concept Model Fatigue Test until Failure ... 39
H. Test Variations ... 43
I. Bose ElectroForce Machine Specifications ... 47
J. Design Proposal for Bosch Transmission Technology B.V. ... 49
Literature study: A Comparative Study on Cycle Fatigue Testing Methods and Machines ... 57
Appendixes for Literature study ... 66
VIII
1
Development of a Bending Fatigue Testing Method with Application on Rings from a CVT-Pushbelt
L.J. van Leeuwen
Department of Biomechanical Engineering,
Faculty of Mechanical, Maritime and Materials Engineering, Delft University of Technology,
Delft, The Netherlands
Abstract—Fatigue tests are a very time consuming process in engineering, in which also a lot of energy is required. Speeding up fatigue tests and making them less energy consuming, would lead to major profits. The aim of this study is to obtain these profits by the development of a new bending fatigue test. In addition, the objective is to apply this new method to the bending fatigue test of rings from a CVT-Pushbelt.
A new bending fatigue testing method is developed and is successfully applied to the bending fatigue test of the CVT- pushbelt rings. The new method makes use of spring capabilities of the ring for displacement amplification via resonance. A concept model is created with which tests are done to validate the new method. It is concluded that the speed is increased by almost 60% and the energy requirement is reduced by 95%. Tests until specimen failure show similar results as current tests, while the conditions of the fatigue test remain the same.
I. INTRODUCTION
Fatigue testing is a widely used test in engineering to find out if materials or constructions hold after a certain amount of cyclic loads. During a fatigue test, forces are cyclically applied to the material to introduce stresses in the material in order to find the number at which it fails or to study the crack growth. The constant need of making products smaller and lighter, while it still needs to withstand the same circumstances, makes that fatigue tests are more commonly executed nowadays.
The problem with fatigue testing is that these tests take often a very long time to finish. Especially when tests are executed that will load the specimen with a high number of
load cycles to the Very High Cycle Fatigue regime (VHCF >107 cycles). Since the existence of a never ending horizontal asymptote in a Stress vs. Number of cycles to failure Curve (S-N curve) is seriously doubted, more fatigue tests are done which reach the VHCF regime [1].
In addition, these tests most often require a large amount of energy to be executed. The machines used for the fatigue tests are generally high powered machines. Since the fatigue tests are wanted to be executed at a maximum rate, the machines are pushed to their limits to load the specimen at the maximal realizable frequency. And with these machines operating day in day out for months, at maximal power, it speaks for itself that fatigue tests are rather energy consuming.
An example of such a fatigue test is the bending fatigue test on rings from a pushbelt of a Continuously Variable Transmission (CVT) for a car. The CVT system with the pushbelt works with two pulleys over which a V-shaped belt runs, that allows changing ratio without steps. The CVT- pushbelt is the V-shaped belt consisting of a couple hundred metal elements and around twenty metal rings in two packs that hold the elements together. This belt transmits the torques over the pulleys by pushing forces via the elements rather than pulling. The configuration of the pushbelt in a CVT and its structure can be seen in Fig. 1 [2]
During the use of a CVT-pushbelt in a car, it is loaded with several forces. [3] One of the load cases that this belt has to withstand is bending of the rings when the belt runs over the pulleys. Bending fatigue tests are done to find the fatigue behaviour of the ring under these bending stresses. By help of
2
this test, adjustments to the ring can be proved on their lifetime under the cyclic bending stresses.
This fatigue test is one of the earlier mentioned tests that take a long time to finish and require a large amount of energy.
The high number of cyclic loads car components have to withstand [4], make the fatigue test a long lasting process. In order to reduce the testing time, the specimens of ring material are bent at the maximal achievable frequency. However, this is limited by the power of the machine. The fixed stroke it has to make for the required bending stresses together with the maximal power of the machine, result in a limited bending frequency, hence equation (1).
Power = mass ∙ acceleration ∙ velocity (1) This brings us to the objective of this study. The objective is twofold: first this research is aimed at developing a new method for bending fatigue testing for thin plates at low energy consumption and high frequency. In addition, the goal is to apply the new method to the bending fatigue test for rings from a CVT-pushbelt.
In the next section the requirements for the fatigue test are described. In the section about the conceptual design, the design options are discussed and decisions are made for a final concept. After that, it is described how a concept model is created and how test are done on this concept model. The results are discussed in section V after which the research is concluded.
II. DESIGN CRITERIA
Towards the design of a high frequency fatigue test for thin plates, some design criteria have been set up. These criteria can be considered as measures to determine if the new bending fatigue testing method is an improvement to current methods. To do so, a comparison will be made between the current bending fatigue test on the ring and the new bending fatigue test on the ring after application of the new method.
The frequency at which the test specimen is bent is an important criterion. It should be at least higher than 60 Hz, which is the current rate at which the specimen is bent. It is preferred to bring the bending frequency to a maximum, since testing times will then be reduced the most.
Another criteria on which the new fatigue testing methods will be judged, is the energy it requires to operate the test. At this moment, the testing machine requires 750W of electrical power to operate the bending fatigue test of the ring. The new fatigue testing method should reduce the energy consumption to a minimum.
The third criterion has to do with the stresses that are introduced in the material by the fatigue test. It is required that the stresses are concentrated at one point. If the same stresses are put over the whole length of a ring, one does not know where the ring will fail. When the stresses are concentrated at one point it is not only known where the ring will fail, but it also makes it possible to study the crack growth without searching for the crack.
Next to that, the stresses introduced by the fatigue test should be adjustable. In order to construct a Wöhler-curve (S- N curve), the variety of stresses is needed to determine the fatigue life at different effective stresses. The desired stresses range from 350 MPa to 600 MPa, which are typical stresses to reach the VHCF regime.
III. CONCEPTUAL DESIGN
The objective of developing a new improved fatigue testing methods by itself is a vague description. This leaves a lot of options open, which means that it is wise to get some insight in all possible options. Roughly a separation can be made between the steps that lead into the actual bending stresses in the test specimen. These steps function as a subdivision for possible options. The steps are:
Actuation
Movement Translation
Bending Stress Introduction
Fig. 1: (a) The pushbelt in a CVT configuration and (b) a close-up of the belt structure, with a couple elements and the two ring packs that hold the elements together.
3
In this section, the steps are discussed and the options are given. A decision is made between the options which are thought to lead in the most promising concept.
A. Actuation
There is a large number of options that can make repetitive motion for a fatigue test [5]. The options differ in frequency, stroke and force range of the movement that can be made.
From this study it appears that actuating can be done by hydraulic, magnetic or piezo-electric actuation.
However, not all the options are suitable for the bending fatigue test which is discussed in this study. The fact that the test specimen is a flexible piece of steel which needs small forces and large displacements to be bent in the desired way, already limits the decision. For the design of the new bending fatigue for the CVT-pushbelt ring application, there is chosen to use the Bose ElectroForce 3330. During testing of new designs of the bending fatigue test, it comes handy that this machine is flexible in his operation characteristics. The frequency and stroke are freely adjustable within the limitations of the machine. This machine is also used for the current bending fatigue test of the ring.
B. Movement translation
Making the translation from the movement of the actuator to a displacement of the specimen in order to introduce the stresses in the material can be done in several ways. The most common technique for this is by a 1 to 1 application of the displacement of the actuator to the specimen, either directly or by help of some kind of grip to introduce a specific kind of stresses. [5]
Another way of introducing the stresses to the specimen can be done by help of resonance. With this kind of translation of the displacement the specimen can be seen as a spring.
Together with a mass (i.e. additional mass or own mass), the system forms a mass spring systems which can resonate in its natural frequency. In this way the movement of the actuator can be amplified and larger stresses are introduced as there would have been by a 1 to 1 translation.
When using resonance for fatigue testing, one is dependent on the natural frequency of the system. The system will only be able to apply the desired loads in this frequency. This frequency can be adjusted by reducing the mass or increase
the stiffness. It is obvious that this results in a maximum frequency in which the mass cannot be decreased anymore and the stiffness of the specimen cannot be increased anymore.
However, if an additional spring is used to increase the stiffness, higher frequencies are still possible.
Another advantage of using an additional spring is that one is able to apply a pre-stress on the test specimen. The spring introduces a load on the specimen which results in stresses in the material, so a new initial state of the specimen is obtained.
The resonant test will now stress the material around this new equilibrium.
This brings us to the new actuation concept that is used in this study to translate the motion of the actuator to motion in the specimen. The actuator makes a small displacement which is amplified through resonance to get a larger displacement of the specimen. A spring element is used to increase the stiffness of the systems and with it the resonance frequency.
Next to that, the spring can be used for the actuation as well as for putting a pre-stress on the specimen. For the sake of simplicity, this concept is called Spring-Amplified-Resonance (SAR) in the remainder of the report. A schematic drawing of this principle can be found in Fig. 2.
However, this principle of SAR fatigue testing is not applicable for every fatigue test. In fact it is limited to fatigue tests that require a large displacement and do not require high forces. Tests that require small displacements and high forces can better be tested by a 1 to 1 application of the excitation movement on the specimen. Next to that, a required high force would damp a resonant system too much. For this Spring- Amplified-Resonance test, a low damping coefficient is crucial.
1) Proof of Concept
In order to test this concept on its feasibility, a model was created using a small piece of the ring, a small spring, and a loudspeaker as can be seen in Fig. 3. This model works as follows: the piece of the ring that is to be bent is fixed connected at one side and attached to the spring (with mass in the form of bolt and nut) at the other side. In turn, at the other side the spring is connected to the coil of the loudspeaker. The loudspeaker functions as the actuator of the system.
When a function generator is used to put a monotonic electric signal at the natural frequency of the system on the
Fig. 3: Proof of the concept for Spring-Amplified-Resonant Fatigue Testing,
Fig. 2: Schematic drawing of the Spring-Amplified- Resonance principle.
4
loudspeaker, the system will resonate. The excitation of the voice coil is amplified by the spring and then applied to the ring piece. The ring is now bent at the natural frequency of the system with the amplified excitation of seven times the voice coil excitation. More about this proof of principle can be found in appendix A.
With this model it is proven that the SAR principle can be useful for fatigue testing. A larger displacement can be applied to the specimen at a higher frequency than there would have been when making use of 1 to 1 application of the movement.
C. Bending Stress Introduction
The bending principles are the ways in which a specimen can be bent. How the bending stresses are introduced into the material is different among the principles. In this section, an overview is given of the options and how they can be adjusted for a fatigue bending test.
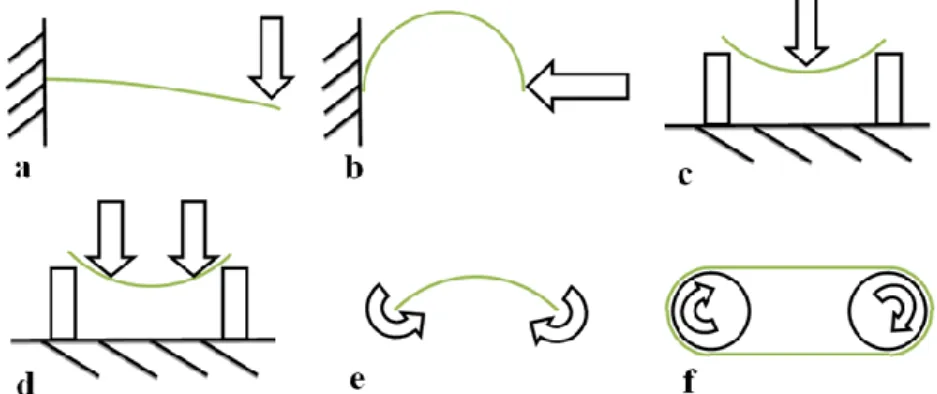
1) Bending Principles
In general, six ways of introducing bending stresses into a specimen can be distinguished. These bending principles are shown in Fig. 5. Not all of them are relevant for the fatigue bending test this report is aiming at. The bending principles that are relevant for the bending fatigue test of a thin plate are the cantilever bending, two point bending, three point bending and by applying a moment. Four point bending works in this respect similar to three point bending. The principles of how the forces are executed to the specimen are the same, only slight changes have to be made to the fixations. The belt- rolling bending is not taken into consideration since this principle does not meet the requirement of introducing a concentrated stress into the ring.
2) Design Options
The four remaining bending principles can all be adjusted in such a way that they form a Spring-Amplified-Resonance system. In fact, they can be adjusted in several ways, while
they still form a SAR system. For instance, compression springs can be used as well as tension springs, but also another specimen can function as the spring. Actuation can be done by applying the displacement to the spring as well as applying it to the specimen itself. The construction options combined with the bending principles give a wide variety of design possibilities for the SAR fatigue tests. An overview of the options is shown in appendix C.
3) Concept for Bending Fatigue Test
The concept that is chosen for further investigation is the symmetric two point bending concept combined with the specimen-specimen construction option. The schematic drawing of this concept can be seen on the left side of Fig. 4.
Although there is no spring anymore in this concept, it still makes use of the SAR oscillation. Only in this concept the spring is replaced by another specimen. This gives the advantage of testing two specimens at the same time. Together with the symmetry that is used in this bending principle this means that bending stresses are introduced at four places at the same time during a test.
Another advantage is that this concept is relatively simple.
Due to the stability that is obtained by the symmetry and by the use of another specimen instead of a spring it is not needed to get rid of unwanted degrees of freedom. The only degree of freedom of the mass between the specimen that is left is the up and down motion. This gives the wanted motion in order to bend the specimen in the right way.
The biggest advantage in fact is that the highest stresses in the material can be found in a place that is free of clamps and constraints. This is a result of using the two-point bending as the bending principle. The highest bending stresses can be found on the places where the bending radius is the smallest.
And as can be seen in Fig. 7 this is right between the mass and punch. This results in clean stresses without local peak stresses at the contact points. These peak stresses will only lead into deviating fatigue behaviour, which is not relevant for the fatigue behaviour of the ring in a CVT. In order to introduce the stresses which are more comparable to the bending stresses in a CVT-Pushbelt ring, this clean bending is preferable.
Fig. 5: Six bending principles with (a) cantilever bending, (b) two-point bending, (c) three-point bending, (d) four-point bending, (e) applied moment and (f) rolling bending.
Fig. 4: Left a schematic drawing of the concept model right the constructed Concept Model.
5
IV. CONCEPT MODEL
A model of the chosen concept for the fatigue test has been created. This model can be seen at the right side of Fig. 4. The model is constructed out of two pieces of ring with the same dimensions (130x12.5x0.2 mm). The pieces are bent into two circles to apply the pretension and are fixed in the middle with a connection point that also functions as the mass. It is this mass that makes the oscillating movement that is needed to introduce the stresses for the fatigue test.
A. Testing the Concept
The concept model is tested in order to find the frequencies it will resonate at and to find out if the amplified displacement is sufficient for the fatigue test. For this test the mass of the connection point is varied, which should lead into two different resonance frequencies. For both weights, a variety of tests are executed in which the input frequency as well as the excitation displacement is varied. In this way it was possible to find the resonance frequencies of the system.
The test rig for this test can be seen in Fig. 6. It consists of the Bose ElectroForce machine for the actuation and a high- speed camera for tracking the behaviour of the system. The high-speed camera makes it possible to have a closer look afterwards on the forming of the specimen and it allows determining the displacement of the mass. This displacement and the deformation of the specimen during a test can be seen in Fig. 7. This displacement determines the stresses in the material, which can be determined by FEM calculations if the form is consistent. The tests are described in more detail in appendix D.
1) Test Results
The results of the tests with the heavier mass can be found in table 1 and the tests with the lighter mass in table 2. Due to resolution limitations of the high speed camera, the resulting mass displacement could only be determined at around 0.3 mm accuracy.
TABLE1
RESULTS OF THE TESTS WITH THE 6.76 G MASS
Input Output
Frequency [Hz]
Excitation Displ. [mm]
Mass Displ.
[mm]
Amplification [x]
67 2 5.3 2.6
68 2 5.3 2.6
69 1 3.6 3.6
74 0.06 3.9 65.8
74 0.1 4.9 49.3
74 1 9.5 9.5
75 1 11.5 11.5
77 0.1 12.2 121.7
77* 1 16.1 16.1
78 0.2 14.1 70.7
78* 1 17.4 17.4
79* 0.2 16.8 83.8
*TEST WITH NON-UNIFORM MASS DISPLACEMENT
TABLE2
RESULTS OF THE TESTS WITH THE 3.54 G MASS
Input Output
Frequency [Hz]
Excitation Displ. [mm]
Mass Displ.
[mm]
Amplification [x]
92 0.02 1.6 82.2
92.6 0.06 6.3 104.2
94 0.1 9.2 92.1
95 1 14.1 14.1
95.2 0.1 11.2 111.8
B. Concept Model in Simulink
In order to get a better understanding of the behaviour of the concept model a Matlab Simulink model has been made.
This model is shown in Fig. 8 where the different components of the concept model can be distinguished. On the outer left side, the excitation displacement is applied. The forces that are executed on the mass by the specimen are calculated separately in the function blocks and divided by the effective Fig. 6: The test rig for testing the concept model on its behaviour under
applied oscillating motion around the resonance frequency.
Fig. 7: Two frames from the movie captured by the high speed camera at the two extreme modes during the test. The frames allow determining the mass displacement.
6
mass to get the acceleration of the mass. By integrating the acceleration, the position of the mass is calculated.
The forces executed by the specimen are deduced from earlier studies to two-point bending [6][7]. The resulting function is given in equation (2). In this function, E is the Young’s Modulus of the material and I is the second moment of area. D stands for the distance between the specimen ends.
= ∙ ∙ (2) From this function also the stiffness can be deduced. The results are shown in Fig. 9. Equation (2) gives the forces executed by only one side of the circle of the concept model like it is shown in Fig. 2b. That is why it has to be multiplied by two for implementation in the function blocks of the Simulink model.
The input for this Simulink model is the excitation displacement, which can be varied in amplitude and frequency.
In order to investigate the behaviour of the system the input amplitude is varied from 0.1 mm to 0.2 mm and the frequency is varied from 73 Hz to 84 Hz. Simulations are done with increasing frequency as well as constant frequency. The results are shown in Fig. 10.
C. Test until Specimen Failure
In order to find out if this concept model is suitable for the actual fatigue test, tests are done until failure of the specimen.
For these tests, five test pieces where manufactured which were loaded via this resonance amplification until the first crack.
For setting a reference also tests are done with the current bending fatigue test. This way of fatigue testing also uses two- point bending to introduce the stresses at a concentrated point in the material, only the movement of the specimen is generated by 1 to 1 application of the movement of the actuator. To make the test comparable, the same displacements are applied to the material; both the distance for pretensioning the specimen as well as the distance travelled by the mass for cyclic stress introduction.
During both test methods the electrical current through the actuation machine is measured. Multiplication of this value by the voltage over the machine (230 V) allowed determining the electrical power requirement of the machine for operation of the fatigue test.
TABLE3
NUMBER OF CYCLES TO FAILURE FOR THE CURRENT AND NEW TESTING METHOD. New Fatigue Testing Method
95 Hz
Current Fatigue Test 60 Hz
306,683 31,771,409
159,848 1,548,892
18,873,903* 95,458
70,145 1,172,608
5,143,879* 41,500,000*
39,154,429*
85,755,021 93,158,772*
*TEST STOPPED MANUALLY, NO FAILURE YET. 1) Test Results
In table 3, the results are shown of these tests. The table gives the number of cycles at which the specimen failed during the current and new test method. In order to save time, the lighter weight is used, so the specimens are bent at a frequency of approximately 95 Hz.
The power the machine required during the current fatigue test was measured to be 750 W. The new test method reduces the power to 60 W.
V. DISCUSSION A. SAR-Principle
From the results in table 1 and 2 it can be said that the Spring-Amplified-Resonance principle works for this fatigue test. This concept of movement translation generates a mass displacement that is at maximum 122 times the movement of the actuator. With this mass displacement, the stresses are introduced into the material.
From the results it also appears that there is no spring needed for the SAR-Principle to work. With the concept model it is shown that if the spring is replaced by another specimen, the excitation displacement will also be amplified into a larger mass displacement.
B. Frequency
From the results in table 1 and 2, it appears that there are indeed two resonance frequencies found. The system with the heavier mass has its optimal resonating point around 77 Hz,
f(u) Upper Specimen
X1 Mass Displacement f(u)
Lower Specimen
1 s Integrator1 1
s Integrator
DampingC 1/Mtotal Sy stem Input
Excitation Displacement
Fig. 8: Simulink model to investigate the spring behaviour of the specimen.
7
the system with the lighter mass around 95 Hz. Both of these frequencies are higher than the current 60 Hz.
1) Variable Resonance Frequency
It also appears that the resonance comes to a higher frequency when the excitation displacement is larger. An example can be found in the gray rows of Table 2. The system stopped resonating when exceeding 92.6 Hz at an excitation displacement of 0.06 mm, while at an excitation displacement of 0.1 mm or 1 mm it still resonates at 95 Hz.
This behaviour is the result of the rings that act like non- linear progressive springs under two-point bending. This behaviour can be seen in Fig. 9, where the force-distance diagram is shown for the ring under two-point bending. From earlier studies, it appeared that the force that is needed to bend the ring under two-point bending is quadratic to the distance travelled. [6][7]
This progressive spring behaviour is the reason why the stiffness of the rings is constantly changing when the rings are bent. So when the mass makes a larger displacement, the rings are bent further and thus the forces the ring acts on the mass are relatively larger. This means a larger effective stiffness of the ring as well. And from equation (3) it can be obtained that this results in a higher resonance frequency on its turn. On the other hand, a smaller mass displacement as a result of a smaller excitation displacement will lead to a lower resonance frequency.
= (3)
It is also for this reason that the excitation displacement should be applied to the model at an increasing frequency. If for example the excitation displacement is immediately put on the concept model at the resonance frequency of 77 or 95 Hz, the system will not move. The natural frequency around the stall position is much lower, so the frequency should be build up from the ‘stall natural frequency’ to the resonance frequencies of 77 or 95 Hz.
2) Simulink validation
The behaviour that is described and the theory that is used to explain the behaviour are validated by use of a Simulink model. This model is shown in Fig. 8
Like in the real model, it appears from this Simulink model that the resonance frequency is indeed dependent on the excitation displacement that is applied to the model. At an excitation displacement of 0.2 mm, it is possible for the model to reach 84 Hz with an amplification of 133. However, at an excitation displacement of 0.1 mm it only reaches 75.6 Hz and an amplification of 119. See Fig. 10 a, b and c.
Also the start-up behaviour of the concept model is validated using the Simulink model. The excitation displacement should be applied to the concept model at an increasing frequency from the stall natural frequency to the frequency that gives the highest mass displacement. If the starting frequency is too high, the system will not resonate, so the mass displacement stays small, which can be seen in Fig.
10 d. The Simulink simulations are described in more detail in Appendix D.
With this model, it is also possible to find the theoretical frequency of the system of infinite small motion around the equilibrium point, the ‘stall natural frequency’ as it is called earlier. The frequency found is 58 Hz for the heavier weight and 74 Hz for the lighter weight. This value is a lot smaller than the frequency found at the larger mass displacements.
This shows that the resonance frequency is highly dependent on the displacement the mass makes, and therefore also on the excitation displacement.
C. Stresses
Now the displacements of the mass are known the stresses in the material can be calculated. From the results it appears that the displacement can vary from 0 mm to 14.7 mm at tests that give stable displacements. This means that the effective stress introduced in the material can vary from approximately 290 MPa to 700 MPa. The desired 350 to 600 MPa from the design requirements falls within the reach of this fatigue test.
Fig. 9: The force and stiffness that a ring piece exhibits during two-point bending at different spacing.
-500 -45 -40 -35 -30 -25 -20 -15 2
4 6 8 10 12 14 16
Distance between specimen ends [-mm]
Force [N]
Stiffness [N/mm]
Fig. 10: Resulting graphs of the mass displacements for different simulations, In (a) input of 0.2 mm at increasing frequency from 73 to 84 Hz. (b) input at 0.1 mm at same frequencies. (c) input of 0.1 mm at increasing frequency from 73 to 75.6 Hz. (d) input of 0.2 mm at constant frequency of 84 Hz. After 10 seconds, the frequency remains constant at the obtained value.
8
The two-point bending principle that is used for this concept also gives a concentrated maximum stress. The highest bending stresses are introduced in the material at the places where the ring makes the smallest radius. As a result of two-point bending the places in this concept model are right in middle between the mass and the connection points with the actuation machine. This gives the clean concentrated stresses in the material that are wanted for the fatigue test.
D. Test to failure
The results in Table 3 show that the number of cycles to failure is comparable to the current test. Until now, only five tests using the new method are done, which is a small number to draw a conclusion from. However, these five tests already show similar results as the current fatigue test.
Table 3 shows relatively more low number of cycles to failure results for the new fatigue testing method than for the current fatigue test. This is due to the fact that the new method stresses the material at four points, where the current fatigue test has only one stress concentration. The test is stopped when the first crack in the surface is noticed. These cracks mostly appear at weak spots at the surface. The chance that a test at the new method stresses the material at a weak spot, is four times higher than when it is tested at the current fatigue test. The results from the current fatigue test show that a low number of cycles to failure occurs every once in a while.
Crack initiation after fatiguing the material with the new testing method is located in the middle between clamps and mass. This means that the stresses at the connection points with mass and clamps do not give peak stresses that will cause the material to fail. It can be said that the rings were purely failing due to the bending stresses introduced by this test.
E. Comparison with current fatigue test
As it is already mentioned, the frequency is raised around 35 Hz with respect to the 60 Hz of the current fatigue test. For this study this is the maximum value that was reached since introduction of SAR for the bending fatigue test. However, it is believed that the frequency can be increased even more if another bending principle is used. See appendix C.
The power reduction from 750 W to 60 W is already a large step forward in terms of efficiency. Taking the reduction of operating time also into account, the electrical energy used for one fatigue test is reduced by 95%.
The stresses that can be introduced into the material are the same. Effective stresses of 290 to 700 MPa are possible using the new fatigue testing method. If one wants to construct a Wöhler-curve (S-N curve), this variety is needed in order to determine the fatigue life at different effective stresses.
VI. CONCLUSION
A new method is developed for bending fatigue. This new method uses resonance in order to amplify the movement of the actuator. It is the first fatigue test which makes use of the Spring-Amplified-Resonance principle to increase the motion of a specimen for stress introduction.
A concept model of this new method has been constructed for tests on rings from a CVT-pushbelt. Tests on this model showed that the resonance amplification principle works for this bending fatigue test. It was found that the specimen in the concept model act as non-linear progressive springs under two-point bending. This behaviour causes the dependency of resonance frequency on the excitation displacement, which is validated using a Matlab Simulink model.
Overall it can be concluded that the speed of the fatigue test is increased by 50% with respect to the current bending fatigue test on rings from the CVT-pushbelt, while the energy requirement of a test is reduced by 95%. Actual fatigue tests until failure of the specimen showed similar results, when testing conditions were kept the same.
ACKNOWLEDGMENT
The author wishes to acknowledge Bosch Transmission Technology B.V. for supporting this research and providing the testing facilities.
REFERENCES
[1] C. Bathias, “There is no infinite fatigue life in metallic materials,”
Fatigue & Fracture of Engineering Materials & Structures, vol. 22, pp.
559-565, 2009.
[2] N. Srivastava and I. Haque, “A review on belt and chain continuously variable transmissions (CVT): Dynamics and control,” Mechanism and Machine Theory, vol. 44, pp. 19-41, 2009
[3] F. van der Sluis, A. Brandsma, J. van Lith, K. van der Meer, A. van der Velde and B. Pennings, “Stress reduction in push belt rings using residual stresses,” Proceedings of CVT2002 Congress, Munich, pp.
383-402, Aug 2002 .
[4] I. Marines-Garcia, D. Galván-Montiel and C. Bathias, “Fatigue Life Assissment of High-Strenght, Low-Alloy Steel at High Frequency,”
The Arabian Journal for Science and Engineering, vol. 33 1B, pp. 238- 247, Apr 2008
[5] L.J. van Leeuwen, “A Comparative Study on Cycle Fatigue Testing Methods and Machines,” Unpublished, 2012
[6] M.J. Matthewson, C.R. Kurkjian, S.T. Gulati, “Strength Measurement of Optical Fibers by Bending,” Journal of the American Ceramic Society, Vol. 69, Issue 11, pp. 815-821, Nov 1986.
[7] S. T. Gulati, J. Westbrook, S. Carley, H. Vepakomma and T. Ono,
“Two Point Bending of Thin Glass Substrate,” SID Symposium Digest of Technical Papers, Vol. 42, Issue 1, pp. 652-654, June 2011
9
A PPENDICES
10
11
A PPENDIX A
P ROOF OF C ONCEPT
1) Introduction
In an early stage of this research the principle of Spring-Amplified-Resonance (SAR) fatigue testing had to be proven. For this reason, a small model was created in order to find out if a small displacement could be amplified by a spring through resonance. The amplified displacement could then be used for fatiguing a specimen.
This appendix describes this proof of concept and how it is used for further development of this concept.
2) Method
A. Design Choices
For the sake of simplicity the bending principle that is used for this proof of concept is cantilever bending of which a schematic drawing can be found in Fig A.1.
This is the simplest way a specimen can be bent and therefore allowed that the model
would be easy to build and easy to actuate. The actuation of the system is done by a
loudspeaker that was removed from a radio/CD-player. A spring is at one end
connected to the voice coil of the loudspeaker and the other end is connected to the
specimen via a bolt. This is done with a small pre-tension in order to prove that the
system works with pretension. The bolt was not only used for the connection, but it
also functions as a mass which improves the resonating capabilities of the system. The
other end of the specimen is clamped to the stationary part of the loudspeaker, in
order to obtain the fixed connection needed for cantilever bending. The actual model
can be seen in Fig A.2
12
B. Controlling
The system control is done by Matlab. The loudspeaker is connected to the line- out of a computer via a mini-jack connection. A Matlab script is written to generate a sinusoidal signal with a constant frequency, which is sent to the line-out of the computer. If the frequency of the signal is the natural frequency of the system, the mass will then resonate. At other frequencies there will be just the monotonic sound of the loudspeaker, the mass will not move.
Since the system is very dependent on the actuation frequency, it is important that the right frequency is found. Determination of this frequency is done in the opposite direction as the actuation of the system. The loudspeaker mini-jack is connected to the microphone input of the computer and the system is given a push so it vibrates in its natural frequency. Via a Matlab script the signal can be read and the frequency can be determined using the Fourier transformation function in Matlab. The frequency that is found for the proof of concept is 94.5 Hz, which will then be the frequency of the sinusoidal signal that will be generated by the earlier mentioned Matlab script.
C. Measurements
In order to determine if the motion of the mass is really amplified with respect to the motion of the voice coil, measurements are done to the system. These measurements should verify quantitatively what already can be seen.
The setup that is used for these measurements can be seen in Fig A.4.The sensor that is used for measuring the displacement of the mass as well as the displacement of voice coil is ILD 1401-20 Laser displacement-sensor 30mm to 50mm. The data is logged at 1000 Hz with Labview software via a USB-data acquisition station of National Instruments.
Next to the displacement measurements, also the power of the signal that is used for actuating the system is measured. Two multimeters are used to measure the voltage over and current through the system, so the power can be calculated.
Fig A.2: Picture of the Proof of Concept Fig A.1: Schematic drawing proof of concept
13
3) Results
A. Observations
When the system is actuated it can be seen that the mass makes a peak to peak displacement of around 1 mm. The displacement of the voice coil is too small to be perceived by the human eye. Along the spring it becomes clear that the amplification becomes larger for every point closer to the mass.
When the input signal frequency is set 1 Hz lower or higher the system still resonates, however, clearly with a smaller amplification. If the input signal frequency differs more than 4 Hz from the natural frequency the systems does not resonate anymore.
B. Measurements
The measured displacements can be seen in Fig A.3. It was measured that the peak to peak displacement of the mass is 1.01 mm and the p-p displacement of the voice coil is 0.15 mm. This means that the system reaches an amplification of 6.95.
The measured voltage over the system was 0.149 V and the current through the system 33.4 mA. This means that the power that the system requires to operate reaches a value no higher than 5 mW.
4) Discussion
It can be obtained from these results that the concept of SAR fatigue testing is proven to work. The results show that the displacement from the input of the voice coil is amplified by this spring-mass-system so a larger displacement at the end of the specimen is obtained. This is the phenomenon that was wanted to be proven by this model.
However, when looking at the results it can be seen in Fig A.3 that the peak displacements of the mass appear to make a waving motion according to the measurements. This waving effect is due to the sampling rate of 1000 Hz. The sensor
0 1 2 3 4 5 6 7 8 9 10
-0.8 -0.6 -0.4 -0.2 0 0.2 0.4 0.6
Time [s]
Displacement [mm]
Mass Voice Coil
Fig A.3: Measured displacements on the Proof of Concept Fig A.4: Setup for measuring displacements. The red
dot on the loudspeaker centre is the measured spot.
14
cannot track every peak the mass makes, so that is why the waving effect occurs in the results.
It can also be seen that the system needs some time to start-up. About half a second after the input signal is started the mass reaches its maximum peak-to-peak displacement. During this time, with every cycle the voice coil makes, it amplifies the displacement a bit more. In the same way the mass movement will not be stopped immediately after the input signal is stopped. The movement eventually damps out in time. This is all because the energy in the system (potential and kinetic energy) has to be built up at the start and damped out at the end of the voice coil excitation.
5) Conclusion
With the model that is created as a proof of concept it is proven that the concept of
SAR fatigue testing works. This proof of concept shows that a small displacement can
be amplified via a resonating spring, in order to get a larger displacement that can be
used for fatiguing a specimen. The amplified motion obtained by the model is almost
7 times as large as the input motion. This is achieved very efficiently since the power
requirement of this model is only 5 mW.
15
A PPENDIX B
P ROOF OF C ONCEPT IN S IMULINK
1) Introduction
In order to get a better understanding of how the system works a Simulink model is created. Together with the parameters of the concept model and the measurements that are done, it is possible to make an accurate simulation of the system behaviour.
2) Method
There is started with a simplified schematic drawing of the system. This can be seen in Fig. B.2. The input of the system is the displacement the voice coil applies on the spring, the output the displacement of the mass. Both the spring and the specimen are modelled as a spring, only the specimen has a damping effect as well. It is assumed that the damping of the spring is negligible compared to the damping of the specimen. The other end of the specimen is connected to the fixed world.
Putting this into a Simulink model it would look like the model of Fig. B.1 At the summation block the forces on the mass come together. The resulting force divided by the mass gives the acceleration of the mass, with which the speed and the displacement can be calculated by integrating. With the displacement on its turn, the forces of the springs on the mass can be calculated. The damping of the system depends on the speed of the mass.
A. Parameter Determination
The values for the parameters in this model are: already known, can be calculated or can be estimated. The first parameter to be determined is the stiffness of the specimen. This value can be obtained by the use of Classical beam theory. The dimensions of the specimen are known and so are the material properties. By help of equation B.1 a value for the stiffness of 0.36 N/mm is found.
=
16
Now this value is known, also the stiffness of the spring can be determined. Since the value was not known on beforehand, graphical analysis from Fig. B.3 allowed determining an approximate value for the stiffness of the spring. In these pictures the relation between the stiffness of the specimen and the spring can be found if the deformation of both is measured at different pre-loads. From this analysis it appears that the spring stiffness has a value of 0.48 N/m. The mass of the bolt and nut of the connection point was found to be 1.9 gr.
These parameters together also allow finding the frequency analytically. By use of equation B.2 it was found that the frequency for the Simulink Model would be 94.2 Hz.
=
In this equation the stiffness of the spring and the stiffness of the specimen can be added up to get the stiffness of the system. The reason for this, is that the spring elements can be considered to work parallel instead of in series. It is the displacement of the mass that matters for this stiffness and not the input displacement [J.C. Cool;
Werktuigkundige Systemen]
The only parameter that is still unknown is the damping of the specimen. To determine this value the measurements on the real system will be used. It is measured that the input displacement is 0.15 mm and the mass displacement is 1.01 mm, so the
Fig. B.2: Schematic Drawing of the Proof of Concept
Sine Wave Scope
1 s Integrator1 1
s Integrator DampingC Gain3
Kring+Kspring Gain2 1/Mtotal
Gain1 Kspring
Gain
Fig. B.1: Simulink model to which describes the behaviour of the proof of concepts
Fig. B.3: Pictures of a piece of ring and the spring under different tension, that allowed to find the relationship between the stiffness of this piece of ring and the spring.
17
damping constant can be adjusted, in such a way that the resulting amplification is the same. The value for the damping is found to be 0.04, which is a plausible value for the damping.
3) Results
With the parameters for this Simulink model estimated, the model can be run. The results are shown in Fig. B.4 The maximum amplification of the system during the steady operation is 7.
4) Discussion
The resulting figure from the simulation is similar to the figure that is constructed from the measurements. The amplification the system reaches is the same and almost the same frequency is found.
However, there is a small difference. At the results from the simulation it appears that the start-up and damping behaviour slightly differ. In the Simulink simulation these processes go faster. The faster response of the mass displacement is probably because the damping is not accurate enough. The damping of the real system is most likely not linear (i.e. the damping is more than proportional higher at larger displacements), where in the Simulink model it is modelled as a linear damping.
Another reason for this difference can be found in actuation of the system. Where the voice coil displacement in the Simulink model is assumed to have no time needed to start up, there can be seen in the measurements on the real system that is does need a certain time before it reaches the maximal input displacement. The larger displacement of the mass also influences the displacement of the voice coil. This means that at the beginning the forces that the spring puts on the mass are in the real system not as high as they are in the simulation model. This causes a slower start and damping of the real system.
The frequency that is found by the analytical way in this simulation is almost the same as the frequency measured on the real system. The minor difference (94.2 vs.
94.5) can be considered negligible.
0 0.5 1 1.5 2 2.5 3
-0.8 -0.6 -0.4 -0.2 0 0.2 0.4 0.6
Time [s]
Displacement [mm]
Mass Voice Coil
Fig. B.4: Output displacements of the Simulink Model of the proof of concept.
18
5) Conclusion
The behaviour of the Simulink Model can be considered to be comparable with
the behaviour of the proof of concept. Despite of the differences in start and damping
behaviour, the steady-state behaviour is the same. And since during a fatigue test the
system would only operate at this steady-state, it makes that this model is valuable for
further evaluation of the system and the Spring-Amplified-Resonance principle.
19
A PPENDIX C
D ESIGN O PTIONS
1) Introduction
For the actual introduction of bending stresses into the ring material there are a wide variety of options. First there are the options of the bending principles and second the options of how to combine the bending principle with the Spring- Amplified-Resonance fatigue testing method. In this appendix there is looked at the options that exist and there is made a comparison between the design options.
2) Method
A. Bending Principle Options
Introducing bending stresses into a material can be done in six ways. These bending principles are shown in Fig. C.1
Fig. C.1: Six bending principles with (a) cantilever bending, (b) two-point bending, (c) three-point bending, (d) four-point bending, (e) applied moment and (f) rolling bending.
20
Not all of them can be used for the fatigue bending test this report is aiming at.
The bending principles that can be used for the bending fatigue test of a thin plate are the cantilever bending, two point bending, three point bending and by applying a moment. Four-point bending works in this respect similar to three-point bending. The principles of how the forces are executed to the specimen are the same, only slight changes have to be made to the fixations. The belt-rolling bending is not taken into consideration since this principle does not meet the requirement of introducing a concentrated stress into the ring.
B. Construction Options
The four remaining bending principles can all be adjusted in such a way that they form a spring-amplified-resonance system. In fact they can be adjusted in several ways, while they still form a spring-amplified-resonance system. For instance compression springs can be used as well as tension springs, but also another specimen can function as the spring. Actuation can be done by applying the displacement to the spring as well as applying it to the specimen itself. All these options give a wide variety of construction possibilities for the spring-amplified-resonance fatigue tests of which a schematic hierarchy tree structure can be found in Fig. C.2. The six open tree ends in the gray blocks are suitable options for the SAR fatigue testing design.
C. Comparison
The bending principles and construction options together give quite some design options. To get a better understanding of how the options hold against each other, a comparison is made. For each of the relevant bending principles an indication of the maximum achievable frequency will be determined.
3) Results
Now there are found several bending principles and several actuation principles these can be combined in a table to give an overview of the possible design options.
This table is shown on the next page. Please note that for the two-point bending principle there are two options mentioned in this table. For this principle there is made a variation which makes the construction symmetric and therewith also more stable.
Bending fatigue testing
Resonant
Spring- Specimen Compression
Spring Spring Actuated
Specimen Actuated
Tension Spring Spring Actuated
Specimen Actuated Specimen-
Specimen Specimen Forced
Fig. C.2: Schematic hierarchy tree structure, which gives an overview of the possible construction options. In the grey blocks are the tree ends that give the options for resonant fatigue testing.
21
A table with all construction possibilities for a spring-amplified-resonance system can be found in on the next page. The options that can be found in this table all have their own characteristics. The bending principle gives a certain stiffness of the specimen, the connection between the spring and specimen gives a certain mass, which together form a basis for the frequency the construction option can operate at.
This frequency is considered to be one of the most important characteristics, so a value is estimated by help of equation (C.1) in order to compare the systems with each other.
= C
A. Frequency Comparison
To make the estimation some assumptions have to be made. The first estimation is that the maximum frequency is equal for all systems with the same bending principle.
For all bending principles it holds that the stiffness is maximal at a minimum length of the specimen. However, due to construction restrictions there is a minimum length, which is estimated. With classical beam theory it is possible to determine an estimated stiffness for the specimen. The next assumption is that the stiffness of the spring is equal to the stiffness of the specimen. For similar values of the stiffness it is proven that the SAR principle works, for distinctive values this is not certain yet. The last estimation that is needed for finding the resonance frequency is the mass of the connection between specimen and spring. Since the frequency will be maximal at a minimal mass, it is estimated what the minimal mass would be for the corresponding bending principle.
With this information and by help of equation (C.1) it is possible to find an estimated value for the maximum frequency at which the systems can operate at. The results are shown in Table C.1.
Table C.1: Estimated frequencies for the bending principles.
Bending Principle Min. Length [mm] Min. Mass [g] Max. Resonance Frequency [Hz]
1. Cantilever
Bending 15 1 244
2. Two-Point
Bending 30 2 138
2a.. Two-Point
Bending Ring 100 1 144
3. Three-Point
Bending 25 4 245
4. Applied Moment
15 3 380
Compression Spring Spring actuation
Compression Spring Specimen actuation
Tension Spring Spring actuation
Tension Spring
Specimen actuation Specimen-specimen Specimen
1
Max.
244 Hz
2
Max.
138 Hz
-
2a
Max.
144 Hz
-
3
Max.
245 Hz
4 Max.
380 Hz
23
4) Discussion
As can be seen in the table on the previous page, there are many possible design options when using the SAR-principle for a bending fatigue test. However, it must be said that not all of the options are feasible. Some options do not leave enough space for actuation and others have degrees of freedom that have to be fixated. This makes some of the options less suitable for application in an actual bending fatigue test.
It should be taken into account that the estimated maximum frequencies for the bending principles as they are calculated in table C.1 are not accurate. The assumptions made for the comparison are too rough and highly negotiable. This means that the value for the maximum achievable frequency can only be considered as an indication. Actual maximum frequency for the bending principle can differ.
These two factors make it hard to draw a conclusion of which system best to use.
Experiments should be carried out on real models to validate if the options will really work with the SAR-principle and what the maximum frequency would be.
5) Conclusion
An overview is presented of possible combinations of construction options and
bending principles. For each bending principle and indication is given of the
maximum frequency. Since the feasibility of the options differs a lot and the
maximum frequency is only an indication, it is at this moment not possible to
conclude which system is best to use for the bending fatigue test.
24
25
A PPENDIX D
T ESTING ON C ONCEPT M ODEL
1) Introduction
Of one of the design options from the overview table in appendix C, there is made a prototype for further investigation. The two-point bending principle combined with the specimen-specimen construction option is a promising concept for the bending fatigue test. It is easy to construct and it introduces the bending stresses by two-point bending, which means that there are concentrated bending stresses at clean spots with no peak stresses due to fixations. Next to that the stresses are introduced at four places in the test specimen, which can be interesting for crack growth studies. The constructed model can be seen in Fig. D. 1.
2) Method
This model is constructed out of two pieces of the ring of about 130 mm. The rings are 12.5 mm wide and 0.2 mm thick. They are bent in such a way that they form an ‘8’ together. The connection or the rings in the middle of the ‘8’ is done by two 10x10x1 mm plates which clamp the rings by help of an M4x5 hex socket head bolt.
This can be seen in Fig. D. 1
The connection point also forms the mass that is used for resonating. In this model the two pieces of rings form the springs and the connection point forms the mass. For the test two different masses are used. The lighter mass construction of the two consists only of the above mentioned rings, plates and bolt. The heavier of the two also consist of a 30 mm long plate in between the rings and a heavier bolt. (M4x10 hex socket head). The corresponding masses are 3.54 g and 6.76 g. The variation in masses should lead to a difference in resonance frequencies of the models.
In order to test the models on their resonance behaviour, a small displacement is applied to one of the two rings. This displacement should be amplified, so the mass makes a much larger displacement.
The actuation is done by the Bose ElectroForce machine. This machine is flexible
in its use and can generate a wide range of displacements at a wide range of
26
frequencies as long as the combination stays within the power limits of the machine.
This flexibility and its ease to use make it a suitable machine for the test.
In order to follow the oscillating motion and to make sure that the model will stay on its place, it is fixed to the machine. This is done with two super magnets which stick the model at both connection points to the machine.
Finally a high-speed camera is used to find out what happens to the rings during the tests. By help of the frames taken by the high-speed camera it is possible to track the displacement the mass makes. Next to that it also allows to check whether the rings make the right motion and if the mass is just making an up and down motion.
The test rig can be seen in Fig. D. 2.
The tests are started by applying a constant amplitude at an increasing frequency.
In this way the resonance frequency can easily be found by watching the movements of the mass. When the resonance frequency was found several movies with the high- speed camera were shot of the concept model reacting to frequencies around the natural frequency. This is done for multiple excitation displacements, so the differences in the behaviour at different input amplitudes could be studied as well.
When all this was done for the first mass, the concept model was adjusted after which the same procedure is followed for the other mass.
A. Obtaining Results
The results that are wanted to be obtained from these tests are the displacement the mass makes and the amplification. The movement of the mass is determined by the frames of the videos that are shot by the high-speed camera. For each frame the height of the mass is determined by finding at which pixel of the frame the most top part of the bolt is. This gives the height of the bolt and by doing this for all the frames in the movie, the peak to peak displacement of the mass can be determined. Dividing this displacement by the excitation displacement gives the amplification of the system.
Two frames of a video captured by the high-speed camera to determine the mass displacement can be seen in Fig. D. 3.
Fig. D. 1: Close up of the concept model in the test setup
Fig. D. 2: Test rig with the actuation machine, the concept model and the high speed camera
27
3) Results
All tests that are done with the concept model are listed in tables D.1 and D.2 together with the resulting values for the mass displacement and the amplification.
TABLE D.1
Results of the tests with the 6.76 g mass
Input Output
Frequency [Hz]
Excitation Displ. [mm]
Mass Displ.
[mm]
Amplification [x]
67 2 5.3 2.6
68 2 5.3 2.6
69 1 3.6 3.6
74 0.06 3.9 65.8
74 0.1 4.9 49.3
74 1 9.5 9.5
75 1 11.5 11.5
77 0.1 12.2 121.7
77* 1 16.1 16.1
78 0.2 14.1 70.7
78* 1 17.4 17.4
79* 0.2 16.8 83.8
* indicates non-uniform mass displacement
Fig. D. 3: Two frames as captured by the high speed camera for determining the mass displacement.
28 TABLE D.2
Results of the tests with the 3.54 g mass
Input Output
Frequency [Hz]
Excitation Displ. [mm]
Mass Displ.
[mm]
Amplification [x]
92 0.02 1.6 82.2
92.6 0.06 6.3 104.2
94 0.1 9.2 92.1
95 1 14.1 14.1
95.2 0.1 11.2 111.8
4) Discussion
From these results it can be obtained that the natural frequency of the lighter ma