Development of a Mode Choice Model for Bus Rapid Transit in
Santa Clara County, California
Chun-Hung Peter Chen and George A. Naylor Santa Clara Valley Transportation Authority
Abstract
Bus Rapid Transit (BRT) is an enhanced bus service that offers many of the same service attributes as rail transit, such as specialized vehicles, large stations, real-time passenger information, and more frequent and reliable operations. The Santa Clara Valley Transportation Authority (VTA) intends to develop an integrated BRT net- work throughout Santa Clara County, California, to provide high quality service to areas not well served by the VTA Light Rail (LRT) system. Past research showed that many transit agencies in North America considered BRT the same as LRT in their demand models, and a few agencies treated BRT and local bus identically. Realistic BRT ridership forecasts are essential for selecting and sizing facilities, preparing ser- vice plans, estimating capital and operating costs, and assessing cost-effectiveness.
This study applied the results of the transit preference survey in a Market Research Model prepared for the VTA and built the improved mode choice model that explic- itly included the BRT mode in the VTA demand model. Instead of considering BRT the same as either LRT or local bus, the improved VTA model with an explicit BRT mode is expected to forecast more reasonable future BRT boardings. Eleven scenarios in the BRT strategic plan for Santa Clara County were developed using the BRT fore- cast results from the improved VTA model.
Editor's Note: An inadvertent error was made in the last issue that misidentified the authors of this paper on the cover and in the table of contents. That error is corrected in this issue with a reprint of the paper. We extend our sincere apology to the authors and to our readers.
Introduction
Bus Rapid Transit (BRT) is an enhanced bus service that offers many of the same service attributes as rail transit, such as specialized vehicles, large stations, real-time passenger information, and more frequent and reliable operations. A more detailed definition developed by the Transit Cooperative Research Program (TCRP) as part of TCRP Report 90 (2003) is that “BRT is flexible, rubber-tired rapid transit mode that combines stations, vehicles services, running ways, and Intelligent Transporta- tion System (ITS) elements into an integrated system with a strong positive identity that evokes a unique image … In brief, BRT is an integrated system of facilities, services, and amenities that collectively improves the speed, reliability, and identity of bus transit.”
Vuchic (2002) defined BRT based on combining mode performance (speed, reli- ability, capacity, image) and investment cost per kilometer of line for three catego- ries of transit modes —rapid transit (Metro), semi-rapid transit (light rail transit, LRT), and street transit (regular bus)—and expresses the definition of BRT as the transit mode between LRT and regular bus. Levinson et al. (2002) proposed the comparisons of BRT and other transit modes as follows: “1. where BRT vehicles (buses) operate totally on exclusive or protected rights-of-way, the level of service provided can be similar to that of full Metrorail rapid transit; 2. where buses oper- ate in combinations of exclusive rights-of-way, median reservations, bus lanes, and street running, the level of service provided is very similar to LRT; 3. where buses operate mainly on city streets in mixed traffic, the level of service provided is similar to a limited-stop tram/streetcar system.” In general, BRT operating in combinations of exclusive bus lane and mixed traffic is considered to be a transit mode between LRT and local bus.
BRT is now a major trend in the development of public transportation systems worldwide. In the U.S., several BRT systems are in service, such as in Eugene (Oregon), Los Angeles, and Cleveland, and there are also other BRT systems under construction, in development, or planned. According to a Federal Transit Admin- istration’s study (2005), in areas with new BRT systems, about 24 to 33 percent of BRT ridership is new to transit. BRT ridership—and transit ridership forecasting in general—is an integral part of transportation planning. Realistic estimates of BRT ridership are essential for selecting and sizing facilities, preparing service plans, estimating capital and operating costs, qualifying benefits, and assessing cost- effectiveness (TCRP 2006). TCRP (2006) implemented BRT ridership surveys for 20 transit agencies in North America to ascertain how BRT was treated in their travel
demand forecasting. This study found many agencies considered BRT the same as LRT in their demand models, and only a few agencies treated BRT and local bus identically. It was also found that no transit agencies had built new specific BRT modes in their models for analyzing BRT in the study survey.
The Santa Clara Valley Transportation Authority (VTA) intends to develop an integrated BRT network throughout Santa Clara County, California, to provide high quality service to the areas not served by LRT. VTA has developed the Santa Clara County BRT Strategic Plan (2009) in which different BRT alternatives, poten- tial corridors, operating and infrastructure strategies were proposed. Near-term and long-term BRT corridors integrated with the existing transit system and road system within the county, including Caltrain, LRT, bus, and exclusive lanes with signal priority, will provide the community with more comprehensive and conve- nient transit service. Future BRT ridership forecasting is one critical element for BRT planning. The current VTA countywide model does not include a BRT mode in the mode choice model. Based on the current structure of the VTA models, if BRT is considered the same as LRT, the forecast ridership may be overestimated.
Conversely, if BRT is considered the same as a local bus, the forecast ridership may be underestimated. Given the anticipated need for the level of detail required in developing future BRT plans, it was necessary for the VTA to develop a refined mode choice model that included the mode of BRT.
The purpose of this study was to develop an enhanced mode choice model includ- ing the mode of BRT into the VTA model so that the model can forecast future BRT ridership for the planning, development, and implementation of the BRT system in Santa Clara County. The model proposed in this study also is used for alterna- tives analysis, prioritizing BRT corridors, analysis of new transit trips, and examining impacts to background local bus services. The “previous model” used in this paper represents the original VTA countywide model without applying the procedures of the BRT mode choice model developed in this study; the “improved model”
represents the revised model using the new BRT mode choice model.
Previous VTA Model
VTA has developed and maintained a countywide travel demand model for at least a decade, which has been applied to various countywide transportation planning and engineering projects. The VTA model initially was structured to be consistent with the Metropolitan Transportation Commission (MTC) regional model, BAY-
CAST (1997). MTC is the metropolitan planning organization (MPO) for the nine- county San Francisco Bay area. The VTA countywide model is an enhanced version of the MTC nine-county regional model, with the addition of more traffic analysis zones (TAZs) and more detailed highway and transit network coding within Santa Clara County. The MTC mode choice model also was enhanced for application in Santa Clara County and the greater modeling region. In the original MTC model, trips were first split into motorized modes and bicycle and walk-only modes.
Motorized trips were then split into drive alone, shared ride 2, shared ride 3 plus, and transit. Last, transit trips were split into transit walk access versus transit auto access. All transit modes were treated identically in the MTC mode choice model, and the choice as to whether the trip used heavy rail, commuter rail, light rail, or express or local bus was dependent on the shortest time path. The enhancements from the MTC model to the VTA model included the implementation of a transit submode nest, allowing the models to estimate ridership on the different transit submodes of commuter rail, express bus, local bus, BART (heavy rail), and light rail as distinct choices based on relative costs and travel times that occur for each submode. The constants of the utility functions for commuter rail, express bus, local bus, BART (heavy rail), and light rail were calibrated based on the transit on- board survey data and transit boarding data. With the inclusion of distinct transit submodes as choices in the model structure, it was possible to calibrate mode specific constants in the VTA mode choice models for each submode. Typically, submode specific constants capture the importance of modal attributes not typi- cally included in the mode choice utility equations, such as reliability, passenger comfort, and safety. During base year calibration, for home-based work trips, the addition of transit submode constants improved the level of validation for each submode. Home-based work calibration results yielded a less negative constant on light rail, followed by heavy rail, commuter rail, local bus, and express bus, in that order. This implies that, all things being equal with respect to travel times and costs, there is a higher probability that a trip will use rail over bus. For the non-work pur- poses, transit submodes behave in a much more generic manner, with only slight biases for rail in the home-based shop/other and home-based social recreational models. The exception in the non-work models was with the non-home-based trip purposes, as both heavy rail and light rail were shown to have less negative con- stants as compared to commuter rail or bus modes. Figure 1 without the dashed line box shows the mode choice structure at the previous VTA model.
Figure 1. Mode choice structure of the previous and improved VTA models
Improved VTA Model
The BRT mode was added into the VTA mode choice model for developing the BRT ridership forecasts to support the Santa Clara County BRT strategic plan. Figure 1 with the dashed line box of the BRT mode shows the mode choice structure of the improved VTA model. The important parameters used in the improved VTA mode choice model, i.e., BRT constants, were derived from the Transit Market Research Model (2007) developed for the VTA. This section addresses how the BRT mode was developed by applying the Transit Market Research Model into the VTA demand model while BRT was still in development and planned without any observed BRT operating data.
Transit Market Research Model
VTA developed a transit market research project, implemented by Cambridge Sys- tematics, Inc., to support the Comprehensive Operational Analysis (COA), a major service redesign plan for the entire VTA bus system that was implemented in Janu- ary 2008. Transit market research is used to develop market segments based on travelers’ attitude towards everyday transportation experiences. The VTA transit market research project consisted of three distinct tasks: data collection, attitudi- nal-based market segmentation modeling, and mode choice modeling. Data col- lection included a stated-preference survey of 819 households throughout Santa Clara County. The survey collected attitudinal, demographic, and travel behavior data. The attitudinal-based market segmentation uses cluster analysis techniques to group individual travelers according to their attitudes toward transportation to identify market segments, and then expands the survey records to the entire population of Santa Clara County.
The importance of Transit Market Research Model introduced here is because a new mode of travel—BRT—was estimated in the market research mode choice models. Market research-based mode choice models were developed with the data collected from the market research household travel surveys, specifically from four customized mode choice experiments. Four experiments in the surveys have differ- ent values of time, costs, and amenities. Three transit service amenities to address packages of BRT and other transit modes include an electronic sign showing minutes until next train, distinctive-looking buses with comfortable interior, and well-lit, covered stations equipped with benches, maps, and guides. Because BRT was not in service currently, through attitudinal and stated preference surveys, the ridership of BRT likely transferred from current transit systems and potential new ridership from auto modes could be estimated by the market research-based mode
choice models. The market research-based mode choice models are multinomial logit models for work and non-work trip purposes. The results of the mode choice models, including the coefficients of different variables in the utility functions and the bias constants for each transit mode (rail, BRT, and bus) are shown in Table 1.
Table 1. Market Research-Based Mode Choice Models
Categories Variables Home-Based
Work/University Non-Work
IVTT In-Vehicle Travel Time -0.0330 -0.0091
OVTT Walk time-Access/Egress -0.0650 -0.0233
Wait time <= 7 mins -0.0650 -0.0233
Wait time > 7 mins -0.0500 -0.0179
Drive-Access Time -0.0650 -0.0233
Transfer Time -0.0650 -0.0233
Cost Cost -0.0770 -0.0718
Attitudinal Factors Pro-environment 0.5750 -
Social Perception -0.2430 -0.5512
Travel Flexibility -0.1450 -
Social-Economic Variable
Workers/ Household -0.0630 -
Vehicle/ Household 0.0000 -0.0670
Age 18 to 24 1.5180 1.8589
Income < $25,000 1.0360 1.4565
Income $25,000 to $50,000 0.2520 -0.2244
Female -0.6210 -0.3754
Transit Amenities Amenities -Signs 0.2140 0.5281
Amenities -Buses 0.2930 0.0187
Amenities Stations 0.4220 0.5100
Modal Constants Drive Alone - base constant 0.0000 0.0000
LRT– constant 0.0000 -1.7593
BRT – constant -0.0340 -1.8115
Bus – constant -0.7810 -1.8025
Perform Measures Value of Time $25.37 $7.64
OVTT(wait time <= 7 mins) /IVTT 2.0 2.6
OVTT(wait time> 7 mins) /IVTT 1.5 2.0
Note: OVTT: out-vehicle travel time; IVTT: in-vehicle travel time Source: Santa Clara Valley Transportation Authority, 2007.
Translation of BRT Constants
Though the purpose of the market research project was to support the transit comprehensive operational analysis, and the market research-based mode choice models were not directly applied in the VTA demand model, the bias constants of BRT compared to (light) rail and bus can be applied to add the new BRT mode in the VTA demand model. Constant coefficients can be converted into bias time constants by dividing constant coefficient by in-vehicle time coefficient
where bm is bias time constant for mode m; cm is constant coefficient for mode m and civt is in-vehicle time coefficient in Market Research Model. Bias time constants present the relative waiting time among different transit modes. For home-based work trips, the rail, BRT, and bus constants are 0, -0.034, and -0.781. Using Eq. (1), the bias time constants for rail, BRT, and bus are 0, -1.03 and -23.67 minutes, respectively.
For non-work trips, the rail, BRT, and bus constants are -1.7593, -1.8115, and -1.8025.
The bias time constants for rail, BRT, and bus converted to equivalent minutes of in-vehicle travel time are -193.33, -199.07 and -198.08 minutes, respectively. Due to home-based work passengers having a higher value of time at $25.37 compared to non-work passengers’ value of time at $7.64, potential BRT passengers from home- based work trips consider BRT more like LRT, while non-work passengers consider BRT more like local bus. For home-based work passengers, BRT only provides one less minute travel time than light rail and 23 minutes travel time over local bus; for non-work passengers, BRT and local bus almost have no significant difference for equivalent time, -199.07 and -198.08 minutes. It was, therefore, assumed that BRT and local bus have the same bias time constants for non-work trips.
Bias time constants derived from Transit Market Model were used to estimate the BRT constants in the VTA demand model. Table 2 shows the coefficients of utility functions of the previous VTA mode choice model without BRT constants. Because the BRT mode is considered to be service between that provided by light rail and local bus, BRT constants are calculated by the linear interpolation method using the light rail constants, local bus constants, and bias time constants obtained above.
(2)
where ΔBRT is BRT constant; ΔLB is local bus constant; ΔLRT is LRT constants; bBRT is BRT bias time constant; bLB is local bus bias time constant; and bLRT is LRT bias time constant.
(1)
Table 2. VTA Mode Choice Models—Transit Walk Access
Variables
Home- Based Work
Home- Based Shop-
ping
Home- Based Social/
Recre- ation
Home Non- Based
Home- Based School (Grade School)
Home- Based School (High School)
Home- Based School (College) BART
(heavy rail) -0.86301 1.14089 2.48260 4.74364 0.59115 1.11067 0.76854 Commuter
Rail -0.86301 1.02982 2.22221 3.57032 0.59115 1.11067 0.76854 Light Rail -0.96318 1.02982 2.22221 4.84000 0.59115 1.11067 0.76854 Express Bus -1.84149 1.02982 2.22221 3.57032 0.59115 1.11067 0.76854 Local Bus -1.70196 1.02982 2.22221 3.57032 0.59115 1.11067 0.76854
EMPD 0.546100
Zero VHHD 0.550100 3.2910
VHH -0.3352 -0.7475
PHH^3 0.004436
Rurali 1.544
Total Time -0.05815
IVT -0.033260 -0.02745 -0.03232 -0.05855 -0.03228 -0.02731
Wait -0.052330 -0.07836
Walk -0.093050 -0.07583
Transfer -0.033260
OVTT -0.06806 -0.06384 -0.03463 -0.03923
Cost -0.002067
LnCost -0.2262 -1.1600 -0.9862 -1.9300 -2.0340 -0.6920
Corej 2.3750 0.9694
LnAreaDen 0.3217
Net ResDen 0.1442
Value of Time $9.65 $6.58 $0.78 $1.08 $0.36 $0.23 $0.67 Ratio of
Wait/IVTT 1.57 - - 2.42 - - -
Ratio of
Wait/IVTT 2.80 - - 2.35 - - -
Note: EMPD: employment density; Zero VHHD: zero vehicle per household; VHH: vehicle per household; PHH:
population per household; Rurali: rural in production zone; Corej: core zone (CBD) in attraction zone; LnAeraDen:
natual log of area density; Net ResDen: net residential density.
Source: Santa Clara Valley Transportation Authority, Valley Transportation Plan 2035, 2009; Transit Cooperative Research Program Report, Appendices to TCRP Report 118, 2006; VTA Model
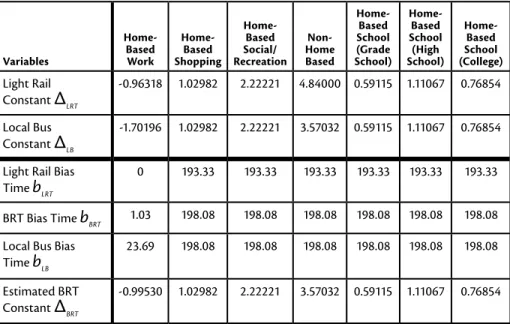
Table 3 shows the results of BRT constants by applying Eq. (2). Estimated BRT con- stant for home-base work is -0.99530, close to the light rail constant -0.96318. For home-based shopping, home-based social/recreation, home-based grade school, and home-based high school, light rail constant and local bus are considered as the same mode in VTA model, so that the estimated BRT constants are the same as light rail and local bus constants. For non-home-based trips, BRT constant is equal to local bus constant because BRT and local bus has the same bias time constant for non-work trips.
Table 3. BRT Constant Calculation
Variables
Home- Based Work
Home- Based Shopping
Home- Based Social/
Recreation Home Non- Based
Home- Based School (Grade School)
Home- Based School (High School)
Home- Based School (College) Light Rail
Constant
Δ
LRT-0.96318 1.02982 2.22221 4.84000 0.59115 1.11067 0.76854
Local Bus Constant
Δ
LB-1.70196 1.02982 2.22221 3.57032 0.59115 1.11067 0.76854
Light Rail Bias Time bLRT
0 193.33 193.33 193.33 193.33 193.33 193.33
BRT Bias Time bBRT 1.03 198.08 198.08 198.08 198.08 198.08 198.08 Local Bus Bias
Time bLB 23.69 198.08 198.08 198.08 198.08 198.08 198.08
Estimated BRT
Constant
Δ
BRT -0.99530 1.02982 2.22221 3.57032 0.59115 1.11067 0.76854BRT Strategic Plan
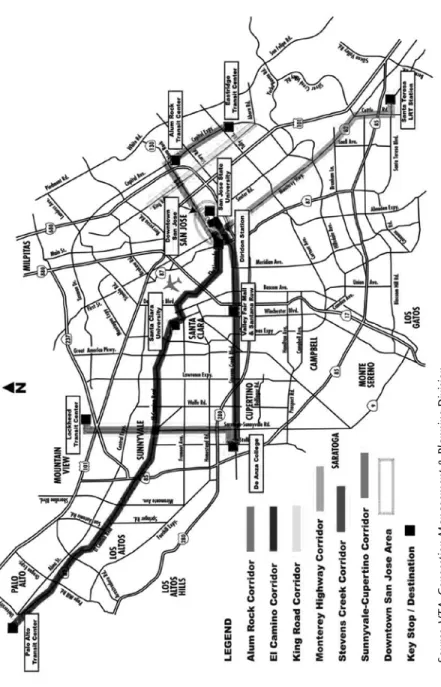
BRT ridership estimates for VTA’s BRT Strategic Plan were developed based on the results of the improved VTA model with the added BRT mode in the mode choice model. Eleven different BRT alternatives and operating and infrastructure strategies were proposed. Six potential BRT corridors were identified by the recent Comprehensive Operations Analysis and from VTA’s Long-Range Countywide Transportation Plan (Valley Transportation Plan 2035) (VTA 2009), and these included the Alum Rock, El Camino, King Road, Monterey Highway, Stevens Creek, and Sunnyvale-Cupertino BRT corridors, all shown in Figure 2. Six lines show the potential BRT corridors, which are not covered by the LRT. An assessment of new
BRT services was conducted on three corridors within the county as the most promising alignments for near-term BRT implementation. The three corridors included:
Alum Rock—stretching from HP Pavilion to Eastridge Mall (6.9 miles)
• and currently served by Rapid 522 (15-minute headways), Local Route 22 (12-minute headways), and Local Route 23 (12-minute headways).
El Camino—stretching from Palo Alto Transit Center to HP Pavilion (16.6
• miles) and currently served by Rapid 522 (15-minute headways) and Local Route 22 (12-minute headways).
Stevens Creek—stretching from De Anza College to Downtown San Jose (8.6
• miles) and currently served by Local Route 23 (12-minute headways).
Rapid 522 has the same route alignment as Local Route 22 with less headway but longer stop spacing. In the previous model, all Rapid 522, Local Route 22, and Local Route 23 are considered as local bus mode. The operating plan in these three cor- ridors is shown in Figure 3.
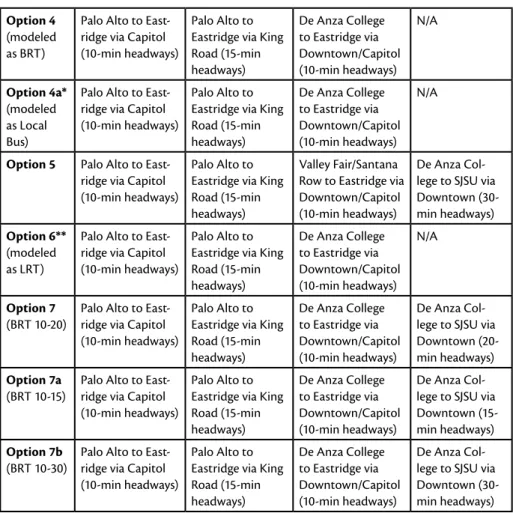
Two new BRT services were proposed in these three corridors: BRT 522 to replace Rapid 522 and overlay on the Local Route 22, and BRT 523 to overlay and comple- ment Local Route 23. Eleven operating plans were developed seeking to achieve enhanced transit market share in the corridor, while making transit more efficient and effective at serving riders. The No Project and 10 operating plans were pro- posed based on different combinations of BRT and local bus service areas and headways. Note that:
(1) Option 6 considers BRT 522 and 523 modeled as an LRT mode using Option 4 as a base.
(2) BRT 522 in the No Project is the existing Rapid 522. The existing Rapid 522 currently provides 15-minute headways and fewer bus stops than Local Route 22 and is considered as a local bus in the previous VTA model;
(3) BRT would operate a premium service with 10-minute headways.
(4) Local Route 22 service would be fixed at 15-minutes, a slight reduction in service from existing 12-minute, and Local Route 23 service would have a variable headway (between 15-30 minutes) to be tested in various service scenarios to gauge its impact on demand.
It also was assumed that in order to claim the full BRT constant, the amount of capital infrastructure required to provide the travel time savings, through either
Figure 2. Six potential VTA BRT corridors
Source: VTA, Congestion Management & Planning Division
Figure 3. Existing Rapid 522, Local Route 22, and Local Route 23
Source: VTA, Congestion Management & Planning Division
dedicated lanes with signal priority, and vehicle and station passenger amenities must be accounted for in the BRT alternative definition and costs.
Table 4 shows the No Project and 11 operating plans by different operating com- binations of BRT 522, Local Route 22, BRT 523, and Local Route 23 that were mod- eled. Table 5 shows the 2030 boardings for the No Project and the 11 BRT operating plans. Option 6 has the highest boardings for the 522/523 BRT corridors at 91,769 daily boardings, with VTA total transit system boardings of 409,859, because BRT was assumed to have the same constant as LRT in this option plan. Option 4 modeled as a BRT mode results in 79,494 daily boardings for the 522/523 BRT corridors; this translates to a 15 percent decrease in BRT ridership if BRT is treated as a separate BRT mode and not the same as LRT. Option 4a with BRT modeled as a local bus mode results in 65,985 daily boardings for the 522/523 BRT corridor routes and 375,713 VTA total transit system boardings. This represents a 17 percent decrease in BRT ridership over the BRT constant model if BRT is treated as a local bus mode.
Table 4. No Project and Eleven BRT Operating Plans
BRT Route 522 Local Route 22 BRT Route 523 Local Route 23 No Project Rapid, Palo Alto
to Eastridge via Capitol (15-min headways)
Palo Alto to Eastridge via King Road (12-min headways)
N/A De Anza College
to Alum Rock via Downtown (30- min headways) Option 1 Palo Alto to East-
ridge via Capitol (10-min headways)
Palo Alto to Eastridge via King Road (15-min headways)
Valley Fair/Santana Row to Eastridge via Downtown/Capitol (10-min headways)
De Anza Col- lege to SJSU via Downtown (30- min headways) Option 2 Palo Alto to East-
ridge via Capitol (10-min headways)
Palo Alto to Eastridge via King Road (15-min headways)
Valley Fair/Santana Row to Eastridge via SJSU/Capitol (10- min headways)
De Anza Col- lege to SJSU via Downtown (30- min headways) Option 3a Palo Alto to SJSU
via Downtown (10-min headways)
Palo Alto to Eastridge via King Road (15-min headways)
Valley Fair/Santana Row to Eastridge via Downtown/Capitol (10-min headways)
De Anza College to Alum Rock via Downtown (30- min headways) Option 3b Palo Alto to SJSU
via Downtown (10-min headways)
Palo Alto to Eastridge via King Road (15-min headways)
De Anza College to Eastridge via Downtown/Capitol (10-min headways)
De Anza College to Alum Rock via Downtown (30- min headways)
Option 4 (modeled as BRT)
Palo Alto to East- ridge via Capitol (10-min headways)
Palo Alto to Eastridge via King Road (15-min headways)
De Anza College to Eastridge via Downtown/Capitol (10-min headways)
N/A
Option 4a*
(modeled as Local Bus)
Palo Alto to East- ridge via Capitol (10-min headways)
Palo Alto to Eastridge via King Road (15-min headways)
De Anza College to Eastridge via Downtown/Capitol (10-min headways)
N/A
Option 5 Palo Alto to East- ridge via Capitol (10-min headways)
Palo Alto to Eastridge via King Road (15-min headways)
Valley Fair/Santana Row to Eastridge via Downtown/Capitol (10-min headways)
De Anza Col- lege to SJSU via Downtown (30- min headways) Option 6**
(modeled as LRT)
Palo Alto to East- ridge via Capitol (10-min headways)
Palo Alto to Eastridge via King Road (15-min headways)
De Anza College to Eastridge via Downtown/Capitol (10-min headways)
N/A
Option 7 (BRT 10-20)
Palo Alto to East- ridge via Capitol (10-min headways)
Palo Alto to Eastridge via King Road (15-min headways)
De Anza College to Eastridge via Downtown/Capitol (10-min headways)
De Anza Col- lege to SJSU via Downtown (20- min headways) Option 7a
(BRT 10-15)
Palo Alto to East- ridge via Capitol (10-min headways)
Palo Alto to Eastridge via King Road (15-min headways)
De Anza College to Eastridge via Downtown/Capitol (10-min headways)
De Anza Col- lege to SJSU via Downtown (15- min headways) Option 7b
(BRT 10-30)
Palo Alto to East- ridge via Capitol (10-min headways)
Palo Alto to Eastridge via King Road (15-min headways)
De Anza College to Eastridge via Downtown/Capitol (10-min headways)
De Anza Col- lege to SJSU via Downtown (30- min headways) Note: * Option 4a considers BRT 522 and 523 as Local Bus mode using Option 4 as the base.
** Option 6 considers BRT 522 and 523 as LRT mode using Option 4 as the base.
Table 4. No Project and Eleven BRT Operating Plans (cont'd)
Table 5. 2030 Daily Boardings by Eleven BRT Operating Plans Operator/RouteNo ProjectOpt 1Opt 2Opt 3 aOpt 3bOpt 4Opt 4aOpt 5Opt 6Opt 7Opt 7aOpt 7b Route 22 (Local)29,83020,78221,06721,37321,38320,90815,70920,65119,56220,66720,55720,788 Route 23 (Local)16,9663,4973,4984,2692,715006,67804,3866,4742,061 Route 522 (BRT)12,883*35,47936,29726,59723,94132,56826,73835,10340,49732,54932,53332,565 Route 523 (BRT)015,56812,27818,46928,04926,01823,53815,41531,71024,83424,01325,450 Total BRT Boardings12,88351,04748,57545,06651,99058,58650,27650,51872,20757,38356,54658,015 522/523 BRT Corridor Routes59,67975,32673,14070,70876,08879,49465,98577,84791,76982,43683,57780,864 LRT System122,466118,906119,721119,737119,920119,146120,692119,008123,658119,120119,084119,134 VTA Local Bus (not including Routes 22/23)145,358153,280153,658152,198151,005153,152147,636151,923152,807150,983150,525152,295 VTA Community Bus23,67024,02624,40623,94523,90724,06024,08523,93724,47623,93523,87824,018 VTA Express Bus16,54516,32316,31216,33916,23916,22617,31516,31417,14916,21616,21316,223 VTA Total System367,718387,861387,237382,927387,159392,078375,713389,029409,859392,690393,277392,534
The ultimate preferred BRT Option 7a has the second highest boardings for the 522/523 BRT corridors at 83,577 daily boardings, with VTA total transit system boardings of 393,277, by using the BRT constants derived from Table 3 in the improved VTA model. Option 7a also would generate the second largest total new transit trips, including home-based work and non-work trips, as shown in Table 6.
The potential new transit riders would be up to 36 percent of BRT ridership in the preferred operating plan Option 7a, which is a little higher than the 24 to 33 per- cent from the FTA’s study of BRT systems currently in operation (Peak et al. 2005).
The operating costs and capital costs for the 11 BRT operating plans are listed in Table 7. Detailed operating and capital cost analysis can be found in the VTA BRT Strategic Plan (2009). Without considering Option 6 (BRT treated as LRT mode), after demand, operating cost, and capital cost analysis, Option 7a was selected as the preferred BRT operating plan, which would generate the highest demand and the largest number of new riders, but include the highest operating costs as well.
The operating and routing plan of Option 7a is shown in Figure 4.
Conclusions
A state-of-the-practice travel demand model with a new BRT mode included in the mode choice model was developed by the Santa Clara VTA and now is used in planning and design phases for countywide BRT projects. Instead of consider- ing BRT the same as LRT or local bus, the BRT constants derived from the Market Research Model fall between LRT and local bus constants. The application of the BRT constants results in BRT ridership between ridership estimates prepared with BRT having a local bus constant and for BRT having a LRT constant, with a varia- tion of approximately 15 percent higher or lower, depending on which constant BRT employed in the forecasts. The improved VTA model was expected to forecast more reasonable future BRT boardings, which were an important consideration in light of the relatively high capital and operating costs associated with BRT services.
The potential new transit riders after BRT lines open would be up to 36 percent of BRT ridership in the preferred operating plan.
Future extensions of the present work might include developing a peer review of before-and-after BRT implementation studies and an evaluation of how actual ridership compares to forecasted ridership for areas implementing BRT, either through passenger counts or on-board surveys reflecting the situation at least one year after BRT lines opens. The Alum Rock segment of the BRT lines 522/523 is currently in final design and scheduled for completion by 2013. The remainder
Table 6. 2030 Daily Linked Transit Trips – Santa Clara County Linked Transit TripsNo ProjectOpt 1Opt 2Opt 3aOpt 3bOpt 4Opt 4aOpt 5Opt 6Opt 7Opt 7aOpt 7b Home-based Work113,800118,819118,716118,134119,067119,638114,256118,954119,854119,794119,835119,737 Non Work204,865216,234216,238215,262217,945218,552208,659216,727224,524219,107219,154218,877 Total318,665335,053334,954333,396337,012338,190322,915335,681344,378338,901338,989338,614 New Home-based Work Transit Trips (relative to No Project)5,0194,9164,3345,2675,8384565,1546,0545,9946,0355,937 New Non Work Transit Trips (relative to No Project)11,36911,37310,39713,08013,6873,79411,86219,65914,24214,28914,012 Total New Transit Trips (relative to No Project)16,38816,28914,73118,34719,5254,25017,01625,71320,23620,32419,949 Percent New Transit Relative to Total BRT Boardings32.1%33.5%32.7%35.3%33.3%8.5%33.7%35.6%35.3%35.9%34.4%
of the BRT 522 corridor along El Camino Real is scheduled for completion by 2015.
Based on this schedule, it is expected that the VTA will be able to implement BRT in the county within three years, which will provide an opportunity to refine the BRT models in the relative near term and develop before and after studies of actual local experiences.
Table 7. Annual Operating and Maintenance Costs and Capital Costs for Eleven BRT Operating Plans
Annual Operating and
Maintenance Cost Capital Cost
No Project - -
Option 1 $62,700,000 $412,200,000
Option 2 $62,600,000 $420,900,000
Option 3a $58,900,000 $417,900,000
Option 3b $64,600,000 $495,700,000
Option 4 $64,400,000 $490,000,000
Option 4a $64,400,000 $490,000,000
Option 5 $64,700,000 $412,200,000
Option 6 $64,400,000 $490,000,000
Option 7 (BRT 10-20) $70,400,000 $490,000,000 Option 7a (BRT 10-15) $72,300,000 $490,000,000 Option 7b (BRT 10-30) $68,400,000 $490,000,000 Option 7b (BRT 10-30) $68,400,000 $490,000,000 Source: VTA BRT Strategic Plan, 2009.
Figure 4. Preferred BRT operating plan – Option 7a (BRT 10-15)
Source: VTA BRT Strategic Plan, 2009
References
Levinson, H. S., S. Zimmerman, J. Clinger, and Rutherford, C. S. 2002. Bus rapid tran- sit: An overview. Journal of Public Transportation 5(2): 1-30.
Metropolitan Transportation Commission. 1997. Travel demand models for the San Francisco Bay Area (BAYCAST-90) technical summary. Oakland, California.
Peak, M., C. Henke, and Wnuk, L. 2005. Bus rapid transit ridership analysis, Federal Transit Administration, Report FTA-CA-26-7068-2004.1.
Santa Clara Valley Transportation Authority. 2001. Silicon Valley Rapid Transit Corridor MIS/EIS/EIR Deliverable #10: Travel demand modeling methodology report. Prepared by Hexagon Transportation Consultants. San Jose, Califor- nia.
Santa Clara Valley Transportation Authority. 2007. Transit market research models.
Prepared by Cambridge Systematics, Inc. San Jose, California.
Santa Clara Valley Transportation Authority. 2009. BRT strategic plan - Final report.
Prepared by ARUP North America Ltd. San Jose, California.
Santa Clara Valley Transportation Authority. 2009. Valley Transportation Plan 2035. San Jose, California.
Transportation Research Board of the National Academies. 2003. Transit Coopera- tive Research Program Report 90. Bus rapid transit – Volume 1: Case study in bus rapid transit. Transportation Research Board, Washington D.C.
Transportation Research Board of the National Academies. 2006. Transit Coopera- tive Research Program Report - Appendices to TCRP Report 118. Bus Rapid transit practitioner’s guide, TCRP Web-Only Document 39. Transportation Research Board, Washington D.C.
Vuchic, V. R. 2002. Bus semirapid transit mode development and evaluation. Jour- nal of Public Transportation 5(2): 71-95.
About the Authors
Chun-Hung Peter Chen ([email protected]) is a Transportation Planner in the Santa Clara Valley Transportation Authority, Santa Clara County, California.
He received his Ph.D. in Civil Engineering from the University of Maryland, College Park, and his M.S. and B.S. degrees in Civil Engineering from the National Taiwan
University. He has been with VTA since 2007 and worked at several light rail and BRT projects. He is a registered professional engineer in the states of Washington and California and also has a certificate of PTOE (Professional Transportation Operations Engineer) from the Transportation Professional Certification Board Inc.
George A. Naylor ([email protected]) is a Transportation Planning Manager for the Santa Clara Valley Transportation Authority and manages the travel demand modeling activities for the Authority. He received his master’s degree in Urban and Regional Planning from San Jose State University and his B.S degree in Petroleum Engineering from Texas A&M University.