C H A P T E R
9
Dissolution Profile Consideration in Pharmaceutical Product Development
Disha Mehtani
1, Ankit Seth
2, Piyoosh Sharma
1,
Rahul Maheshwari
3, Sara Nidal Abed
4, Pran Kishore Deb
4, Mahavir B. Chougule
5,6,7and Rakesh K. Tekade
3,81Sri Aurobindo Institute of Pharmacy, Indore, Madhya Pradesh, India2Department of Ayurvedic Pharmacy, Rajiv Gandhi South Campus, Banaras Hindu University, Mirzapur,
Uttar Pradesh, India3National Institute of Pharmaceutical Education and Research (NIPER)-Ahmedabad, Gandhinagar, Gujarat, India4Faculty of Pharmacy, Philadelphia University-Jordan, Philadelphia University, Amman, Jordan5Translational Drug and Gene
Delivery Research (TransDGDR) Laboratory, Department of Pharmaceutical Sciences, Department of Pharmaceutics and Drug Delivery, School of Pharmacy, University of Mississippi, University, MS, United States6Pii Center for Pharmaceutical Technology, Research Institute of Pharmaceutical Sciences, University of Mississippi, University, MS,
United States7National Center for Natural Products Research, Research Institute of Pharmaceutical Sciences, University of Mississippi, University, MS, United States8Department
of Pharmaceutical Technology, School of Pharmacy, International Medical University, Kuala Lumpur, Malaysia
O U T L I N E
9.1 Introduction: Drug Dissolution
Concept 289
9.2 Theories of Dissolution 290 9.2.1 Diffusion Layer Model 291 9.2.2 Interfacial Barrier Model 291 9.2.3 The Danckwerts Model 291
9.3 Factors Affecting Dissolution Rate
(In Vitro) 294
9.3.1 Drug-Related Factors 294 9.3.2 Drug Product Formulation
Related Factors 295
9.3.3 Manufacturing/Processing
Related Factors 296
9.3.4 Dissolution Testing Conditions
Related Factors 298
9.4 Physiological Factors Affecting
In VivoDrug Dissolution Rate 300 9.4.1 Composition of GI Fluid 300
9.4.2 pH 300
9.4.3 Buffer Capacity 301
9.4.4 Osmolality 302
9.4.5 Surface Tension 302
9.4.6 Viscosity 302
9.4.7 Temperature 302
9.4.8 Volume 302
9.4.9 Hydrodynamics 302
9.4.10 Gastric-Emptying Rate
and Forces 303
9.4.11 Concomitant Use of
Antisecretory Therapy 303 9.5 Dissolution Testing 303
9.5.1 Approaches for Dissolution
Test Method Design 303
9.5.2 Design of Dissolution Method 303 9.6 Dissolution Profile: Analysis and
Comparison 306
9.6.1 Dissolution Profile 306 9.6.2 Analysis of Cumulative
Dissolution Profiles 306 9.7 In Vitro-In VivoCorrelation
(IVIVC) 306
9.7.1 Definition 306
9.7.2 Significance and Purpose of
IVIVC 306
9.7.3 Levels of IVIVC Correlation 307 9.7.4 Applications of IVIVC 308 9.8 Biopharmaceutical Classification
System (BCS) and Biopharmaceutical Drug Disposition Classification
System (BDDCS) 309
9.8.1 BCS Classes and Parameters 309 9.8.2 Biopharmaceutical Drug
Disposition Classification
System (BDDCS) 311
9.9 Role of Dissolution Testing in Pharmaceutical Product
Development 311
9.9.1 Pharmaceutical Product
Development Phases 312 9.9.2 Determining Drug
Developability at
Preformulation Stage 314 9.9.3 Simulation of Food Effects 314 9.9.4 Determination of the Impact
of Concomitant Use of Other Substances With Drug
Product 315
9.9.5 Dissolution as a Key Feature for Biopharmaceutical
Approach in QbD 316
9.9.6 Prediction ofIn VivoDissolution:
Biorelevant Dissolution
Testing 317
9.9.7 Biowaiver Application: Role of BCS, IVIVC, and
SimilarityDissimilarity
Factor 320
9.9.8 Prognosis of Drug Disposition 322 9.9.9 Identification of Critical
Manufacturing Variables
(CMVs) 323
9.9.10 Surrogate of Bioequivalence Study at Postapproval Changes of Drug Product (SUPAC) 323 9.9.11 Quality Control Tool 324 9.9.12 Determination of Product
Storage Stability 324
9.9.13 Investigation of Drug Release
Mechanisms 325
9.10 Dissolution Mechanism: Role of Density Functional Theory
(DFT) 325
9.10.1 Basics of Density Functional
Theory 325
9.10.2 DFT Application to Predict Dissolution Mechanisms 325
9.11 Dissolution Controlled Drug
Delivery Systems 326
9.11.1 Dissolution of Solid Particles 326 9.11.2 Dissolution of Coated
Systems 326
9.11.3 Dissolution of Matrix
Systems 327
9.11.4 Examples of Dissolution Controlled Drug Delivery
Systems 327
9.12 Conclusion and Prospects 327
Acknowledgments 328
Abbreviations 328
References 329
9.1 INTRODUCTION: DRUG DISSOLUTION CONCEPT
Dissolution involves the interaction of solid drug with the dissolution medium resulting in the movement of drug molecules into the bulk solution (Qiu et al., 2016). It is funda- mentally dependent on relative molecular affinities between the drug and dissolution media. Under specific experimental conditions, dissolution is also known as solubility.
The maximum quantity of the solute dissolved in a pure solvent under fixed environmen- tal conditions (temperature, pressure, and pH) is called absolute solubility (Khadka et al., 2014). The process of dissolution may thus be understood as the relocation of solute and solvent molecules involving intermolecular attraction forces as shown inFig. 9.1.
FIGURE 9.1 Diagrammatic repre- sentations of the processes involved in dissolution of a crystalline solute.
Firstly, solute molecules are disinte- grated; solvent molecules dispersed to form cavity; the cavity is filled with dis- integrated solute molecules one by one to complete the process of dissolution.
289
9.1 INTRODUCTION: DRUG DISSOLUTION CONCEPT
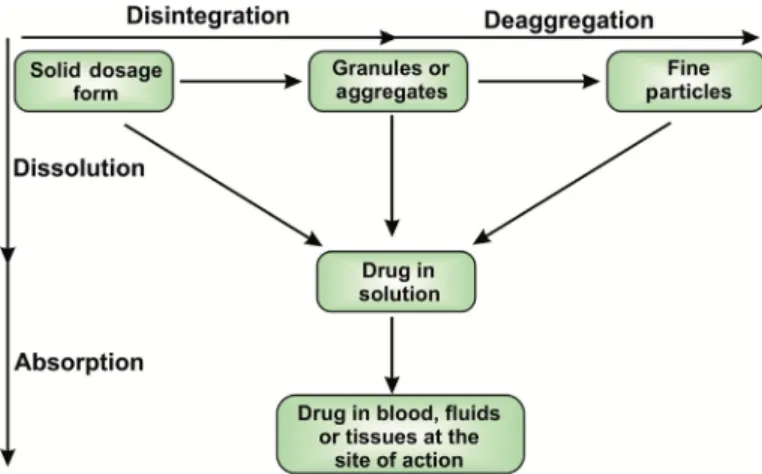
The dissolution process gets initiated by the general movement of solid solute from the largest form to fine particles before becoming molecularly dispersed (dissolved). It is a multistep process involving wetting of the solid phase, followed by sequential penetra- tion of solvent into the solid formulation. The dissolution of the solid formulations like tablet initially involves its breakdown into granular or fine particulate form followed by de-aggregation, leading to a considerable increase in the total solute surface area (Rahul et al., 2017). The last step involves the dissolution of the drug to be available for systemic circulation. However, dissolution can take place anytime during these steps as illustrated inFig. 9.2.
In the case of liquid formulations like suspension, dissolution can occur directly or involves a lesser number of steps as the solid present in the formulation is already in a fine particulate form. The site of these events can be stomach or intestine or both. The slowest step in the overall dissolution process is considered to be the rate determining step. For the drugs with poor solubility, solubilization is found to be slower in comparison to the disintegration or de-aggregation of the formulation, thus making it dissolution con- trolled. Conversely, if the disintegration is slower than solubilization, then the rate- limiting step is considered to be disintegration (Bourlieu et al., 2015).
9.2 THEORIES OF DISSOLUTION
Each of the events of the drug dissolution process has its own rate. Various physical models have been drafted to explore the theoretical concepts, study these rates, and to get the deeper insight of dissolution mechanism (Babu et al., 2015). These models can pre- cisely explain the parameters of the dissolution and highlight the corresponding factors that affect these parameters. This could act as a foundation of a dissolution method devel- opment. Dissolution mechanism can be explained by utilizing any of these models.
FIGURE 9.2 Schematic representa- tion of dissolution of a solid dosage form. There are two pathways for solid dosage forms to get absorbed into the blood. (1) It can be disintegrated into granules or aggregates and further deaggregates to form fine particles, which further go into solution and sub- sequently gets absorbed. (2) Solid dos- age form can be directly gets dissolved into the solution and gets absorbed.
9.2.1 Diffusion Layer Model
Nernst and Brunner initially proposed this model which is also called film theory. This model explains the dissolution of a single particle (sphere). It is the simplest and most use- ful theory in the estimation of the dissolution rate of pharmaceutical particles. According to this theory, the process comprises of two steps: first, the formation of the diffusion layer (stagnant liquid layer) around the solid particle by dissolution of the solid particle (drug) at the solid/liquid interface. Later this layer gets saturated by the drug (Wurster and Taylor, 1965). This is an instantaneous step, and the equilibrium is attained at the solid/liquid interface. The concentration of the drug in this stagnant layer is denoted as Cs. In the sec- ond step, the drug molecule diffuses through the stagnant layer to the interface and ulti- mately moves towards the bulk solvent. In this model, diffusion of the drug via a film layer is considered as the rate determining step (Siepmann and Siepmann, 2013). Noyes and Whitney coined the equation for dissolution rate concerning the difference in concen- trations of the drug at stagnant layer Csand in bulk at time Ct. The Noyes-Whitney equa- tion assumes that during the dissolution process, the surface area of the solute remains constant, which is practically not possible for dissolving particles. In accounting for the change in the surface area concerning the decreasing particle size during dissolution, Hixon and Crowell’s cube root law of dissolution is used (Berthelsen et al., 2016).
9.2.2 Interfacial Barrier Model
In contrast to the diffusion layer model, the interfacial barrier model suggests that the activity at the solute surface along with its subsequent diffusion across the interface is comparatively slower than the diffusion across the stagnant layer. Surface activity in this model is not considered to be instantaneous as in the case of the previous model. This is because of the presence of an obstruction of high activation energy that has to be over- come before the dissolution of the solid. Thus the rate of solubilization of the solute (drug) in the static layer is the rate determining step, instead of the diffusion of the solubilized drug towards the bulk solvent (Higuchi, 1967). This model also suggests that due to the solvation, an intermediate concentration is present at the interface as a function of solubil- ity instead of diffusion.
9.2.3 The Danckwerts Model
Similar to the diffusion layer model, Danckwerts model also postulates that the activity on the solute surface is instantaneous (Danckwerts, 1951). However, the mechanism of mass transfer of a solute from solid surface to bulk liquid varies. This model suggests that the macroscopic solvent packets or eddies in the fluid randomly approach to the character- istic solidliquid interface owing to agitation. Diffusion of the solute particles takes place into these solvent packets that deliver them to the bulk solvent. Due to penetration of these solvent packets into the solidliquid interface, this is called the Penetration theory.
This is also known as the Surface Renewal theory because of the continuous replacement of solvent packets with fresh supplies of solvent which then interact with the new solid surface at each instance (Zhang and Chatterjee, 2015).
291
9.2 THEORIES OF DISSOLUTION
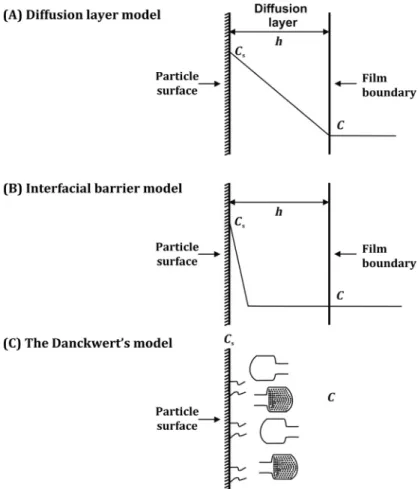
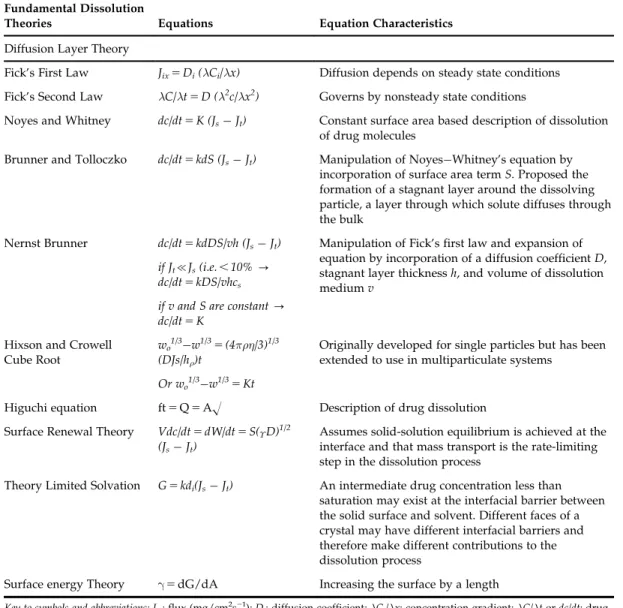
The transport phenomenon as per the three models is illustrated inFig. 9.3and the dis- solution rate equations for the three theories are mentioned inTable 9.1. This section shed light on several theories of dissolution. However, there are many factors which may affect the rate of dissolution from the dosage form. The next section deals with the various fac- tors affecting the rate of dissolution.
FIGURE 9.3 Schematic illustrations of (A) the Diffusion Layer Model, (B) the Interfacial Barrier Model, and (C) the Danckwerts Model.Cs5concentration of the drug in this stagnant layers;C5Concentration of the drug in the bulk at timet;h5Thickness of the stagnant layer.
TABLE 9.1 Representing Fundamental Dissolution Theories Fundamental Dissolution
Theories Equations Equation Characteristics
Diffusion Layer Theory
Fick’s First Law Jix5Di(λCi/λx) Diffusion depends on steady state conditions Fick’s Second Law λC/λt5D (λ2c/λx2) Governs by nonsteady state conditions
Noyes and Whitney dc/dt5K (JsJt) Constant surface area based description of dissolution of drug molecules
Brunner and Tolloczko dc/dt5kdS (JsJt) Manipulation of NoyesWhitney’s equation by incorporation of surface area termS. Proposed the formation of a stagnant layer around the dissolving particle, a layer through which solute diffuses through the bulk
Nernst Brunner dc/dt5kdDS/vh (JsJt) Manipulation of Fick’s first law and expansion of equation by incorporation of a diffusion coefficientD, stagnant layer thicknessh, and volume of dissolution mediumv
if Jt{Js(i.e.,10%- dc/dt5kDS/vhcs
if v and S are constant- dc/dt5K
Hixson and Crowell Cube Root
wo1/3w1/35(4πρη/3)1/3 (DJs/hρ)t
Originally developed for single particles but has been extended to use in multiparticulate systems
Or wo1/3w1/35Kt
Higuchi equation ft5Q5AO Description of drug dissolution Surface Renewal Theory Vdc/dt5dW/dt5S(ϒD)1/2
(JsJt)
Assumes solid-solution equilibrium is achieved at the interface and that mass transport is the rate-limiting step in the dissolution process
Theory Limited Solvation G5kdi(JsJt) An intermediate drug concentration less than saturation may exist at the interfacial barrier between the solid surface and solvent. Different faces of a crystal may have different interfacial barriers and therefore make different contributions to the dissolution process
Surface energy Theory γ5dG/dA Increasing the surface by a length
Key to symbols and abbreviations: Jix: flux (mg/cm2s21);Di: diffusion coefficient;λCi/λx: concentration gradient;λC/λtordc/dt: drug dissolution rate;K: first-order dissolution constant;Js: equilibrium drug concentration;Jt: drug concentration at timet;
kd: dissolution constant;S: surface area;v: volume of dissolution medium;h: thickness of stagnant layer;wo: initial powder weight;w: powder weight at timet;ρ: particle density;η: viscosity;h: thickness of diffusion layer;ϒ: interfacial tension;G:
dissolution rate per unit area;ki: effective interfacial transport constant; Q is the amount of drug release per unit time area A.
293
9.2 THEORIES OF DISSOLUTION
9.3 FACTORS AFFECTING DISSOLUTION RATE ( IN VITRO ) 9.3.1 Drug-Related Factors
9.3.1.1 Solubility
The solubility of a drug substance is known to affect its intrinsic dissolution rate.
Highly soluble drugs usually show faster dissolution rates. Thus, to predict the influence of solubility on drug dissolution, the solubility of the drug must be measured at different physiological pH (Hall, 2015). There are numerous techniques described for complex for- mation to increase the solubility, dissolution rate, and absorption of the drugs with low water solubility, e.g., conjugates of cyclodextrin with poorly soluble drugs (Gidwani and Vyas, 2014).
9.3.1.2 Drug Ionization: pH Effects, Salt Form of Drug
A drug that exists in the ionized form in the gastrointestinal (GI) fluids tend to be more soluble as compare to its nonionized form. In general, the acidic drug ionizes at basic pH, and the basic drug ionizes at acidic pH. The drug in salt form also exhibits higher rates of dissolution as compared to a nonionized form of the drug (Qiu et al., 2016).
9.3.1.3 Particle Size
Particle size reduction of a drug (micronization) increases its surface area and enhances its dissolution which ultimately increases the absorption of drug (Sharma et al., 2015;
Maheshwari et al., 2012). An increase in effective surface area by particle size reduction also improves the wetting properties of the drug. However, this correlation is not applica- ble in the case of hydrophobic drugs where the augmentation in surface area decreases the rate of dissolution (Javadzadeh et al., 2015).
9.3.1.4 Solid State Characteristics 9.3.1.4.1 POLYMORPHISM
A drug might exist in more than one crystalline form (polymorphs), which differ in their lattice energies, leading to the different solubility profiles. Metastable (high activation energy) polymorphs exhibit better dissolution profiles as compared to the other stable polymorphic forms (Brittain, 2016). A significant variation between dissolution rates of different polymorphic forms of carbamazepine was reported. The tablets of α-form exhibit higher dissolution rates as compared toβ-form. In another experiment, it was dem- onstrated that two different polymorphic forms of oxytetracycline hydrochloride exhibit dissimilar dissolution rates from the conventional tablets (Reischl et al., 2015).
9.3.1.4.2 CRYSTALLINE/AMORPHOUS FORM
The crystal lattice in the drug molecule may either be of particular conformations (crys- talline phases) or be indistinguishable (amorphous phases). In general, amorphous drugs show better solubility and dissolution than that of a crystalline form. However, exceptions are also observed as in the case of erythromycin estolate whose crystalline form is more soluble than the amorphous form (Grohganz et al., 2014).
9.3.1.4.3 SOLVATE FORMATION
A drug may exist in various forms as hydrates and solvates containing a stoichiometric or nonstoichiometric amount of solvent. The anhydrous forms of the drug may dissolve faster than the hydrated form, being thermodynamically more active (Reutzel-Edens and Stephenson, 2016). Toluene and pentanol solvates of glibenclamide have been reported to exhibit high dissolution rates when compared to its nonsolvated polymorphic forms (Censi and Di Martino, 2015).
9.3.1.4.4 COMPLEXATION
Drugs may complex with the excipients that can affect the dissolution rate and thereby the therapeutic efficacy. Complex formation may result in alteration of biopharmaceutical or physicochemical properties of the drug (Panakanti and Narang, 2015). The solubility and diffusion coefficient of the complex thus formed may be more or less as compared to the parent drug (Dizaj et al., 2015). The precise use and understanding of complex forma- tion techniques have been explored to increase the solubility, dissolution rate, and absorp- tion of the drugs with poor aqueous solubility, for instance, the conjugates of cyclodextrin with poorly soluble drugs (Gidwani and Vyas, 2014).
9.3.2 Drug Product Formulation Related Factors
Excipients have been reported to significantly affect the rate of drug dissolution. Both the nature as well as the proportion of excipients influences the rate of dissolution. Several excipients have been reported to increase the dissolution characteristics of the drug. This holds true for those excipients that tend to enhance the hydrophilic nature of the drug substance. However, the excipients which are hydrophobic in nature may adversely affect (decrease) the dissolution rate (Parr et al., 2016).
The diluent like starch imparts hydrophilic properties to the exterior surface of the hydrophobic drug by forming a layer around it; thereby increasing the effective surface area and the drug dissolution rate. The disintegrants are generally observed to improve the dissolution process by various mechanisms. Starch, also being a disintegrant, swells with wetting, facilitates breaking up of tablet and deaggregation into a granule. Sodium starch glycolate also has the strong swelling capacity (Van Nguyen et al., 2016).
The influence of binders on the dissolution rate is varied. The hydrophilic binders like gelatin impart hydrophilicity to the hydrophobic poorly wettable drug substance and improve their dissolution rate as in the case of phenobarbital tablet granulated with gela- tin. On the other side, some factors may lead to slowing down of the dissolution process like a large amount of binders increases the hardness of tablets (Bandari et al., 2014).
Lubricants that are mostly hydrophobic in nature (e.g., metallic stearates like magne- sium stearate, stearic acid, and talc)form water repellant coats around the granules result- ing in the reduced effective surface area, reduced wettability, and thereby decreased dissolution rate, e.g., as observed in the case of magnesium stearate used in salicylic acid tablets. When sodium lauryl sulfateis used in the salicylic acid tablet as lubricant, the sur- face activity of sodium lauryl sulfate increases wetting, promotes solvent penetration into the tablet, and thus enhances the dissolution rate (Li and Wu, 2014).
295
9.3 FACTORS AFFECTING DISSOLUTION RATE (IN VITRO)
The surfactants incorporated in various dosage forms (especially poorly soluble drugs) by virtue of micelle formation, improve the wetting of the particles resulting in increased dissolution rates (Sharma, 2016). Some dyes are also observed to affect the dissolution, e.g., FD & C Blue No. 1 decreased the dissolution rate of sulphathiazole by inhibiting the surfactant-like properties of bile salts on the drug (Zishan et al., 2017). The decrease in dis- solution rate of capsules prepared by using Polysorbate 80 as an excipient was observed (Dannenfelser et al., 2004). This is because of formation of an additional film due to the denaturation of the capsule’s inner surface. This denaturation occurs due to the formation of formaldehyde by autooxidation of Polysorbate 80. This results in reduced dissolution (Khadka et al., 2014).
The polymers used in several formulations considerably impact the drug dissolution rate (Maheshwari et al., 2015; Tekade et al., 2017). They are generally incorporated to con- trol the release of the drug from the dosage form. The nature and amount of these sub- stances play a major role. The majority either form a coat over the drug particles or the formulation, delaying or slowing down the dissolution process. Also, they can form a matrix in which the drug is embedded and gets dissolved and released at a particular desired rate (Ma et al., 2014). In an investigation, it was found that the dissolution of indo- methacin from cocrystals of indomethacin2saccharin increases in the presence of polyvi- nylpyrrolidone (Alhalaweh et al., 2013).
In another experiment, it was revealed that the increase in the concentration of a poly- mer (Methocel K4M) decreases the release of carbamazepine from matrix tablet containing cocrystals of carbamazepine-succinic acid. However, it was also reported that the increase in concentrations of Soluplus and Kollidon VA/64 increases the release of carbamazepine from the same formulation (Ullah et al., 2015).
9.3.3 Manufacturing/Processing Related Factors
9.3.3.1 Methods Involve in Manufacturing
Wet granulation, in general, is observed to enhance the rate of dissolution of poorly soluble drugs by imparting hydrophilic characteristics and improving the wetting properties of the drug (Wren et al., 2017). On the other hand, a sodium salicylate tablet prepared by direct compression method using spray-dried lactose revealed comparatively higher dissolution rate than those formulated by the wet granulation method (Singh and Van den Mooter, 2016).
9.3.3.2 Compression Force
The force applied by the tablet compression machines affects the hardness of the tablet.
There exists a linear relationship between the hardness of the tablet and the compression force as suggested by Higuchi et al. (Higuchi et al., 1953; Higuchi et al., 1954). The higher tablet compression may enhance the particle bonding, increase the hardness and density, alter its porosity, and thus inhibits solvent penetration inside the tablet. This ultimately results in lowering the dissolution rate (Ferrero and Jime´nez-Castellanos, 2014).
9.3.3.3 Moisture Content
Chowhan et al. established the relationship between drug dissolution and crushing strength (Chowhan and Chow, 1981) and found different varying levels of moisture con- tent present in the granules during compression. In another study, it was found that the rate of dissolution of benazepril hydrochloride tablets decreases with an increase in mois- ture content. This study was performed by storing the tablets under varying conditions of temperature and humidity. Fig. 9.4 shows a photomicrograph of the acetaminophen/
polyvinyl pyrrolidone (PVP)/dibasic calcium phosphate dihydrate/Cross PVP formulation after exposing it to 40C/75% RH in the water sorption experiment.
The outcomes displayed a great enhancement in tablet crushing strength, where it was found that a solid mass was made after exposure to 40C/75% RH. This mass was readily collapsed to a powder with slight pressure from a spatula. Formulations that did not strengthen remained a powder postexposure to 40C/75% RH. It was also found that the increased moisture induces structural changes in benazepril hydrochloride tablet due to FIGURE 9.4 Water sorption uptake of selected acetaminophen tablets. When exposed to 25C/30% RH then 40C/75% RH then 25C/30% RH, and photo of the DCPD/PVP/CrosPVP precompression blend after comple- tion of the water sorption experiment.Adapted with permission from Sacchetti, M., Teerakapibal, R., Kim, K., Elder, E., 2017. Role of water sorption in tablet crushing strength, disintegration, and dissolution. AAPS PharmSciTech 113.
297
9.3 FACTORS AFFECTING DISSOLUTION RATE (IN VITRO)
preactivation of disintegrating agent that causes reduction in dissolution rate (Sacchetti et al., 2017). The same type of results were obtained in another experiment in which the exposure of delavirdine mesylate tablets to increased humidity conditions resulted in sig- nificant reduction in the extent of dissolution (Nie et al., 2017). These studies suggest the control of processing conditions during the manufacturing process and the use of advanced packaging technology should be used to avoid the exposure of moisture in the formulations.
9.3.3.4 Machine
The equipment used in various unit operations of drug product manufacturing some- times markedly influence formulation properties. It was evident by the study which com- pared the preparation of granules with low porosity by high speed shear mixer to those made by planetary mixer with high porosity. More porous granules may show improved dissolution by facilitating solvent penetration (Reddy et al., 2017).
9.3.4 Dissolution Testing Conditions Related Factors
9.3.4.1 Dissolution Apparatus 9.3.4.1.1 AGITATION
Agitation forces prevailing in the dissolution apparatus affects the stationary diffusion layer and can markedly affect diffusion-controlled dissolution. The shear forces applied by the dissolution medium affect the thickness of the stagnant layer, thereby influencing the dissolution. High agitation rates can possibly increase the drug dissolution (Jug et al., 2017). In a study, the effect of agitation has been investigated on FDA approved drugs (USP specifies 100 rpm paddle speed). The results of the dissolution test conducted at vari- able paddle speeds of 50, 75, and 100 rpm indicate that, an increase in the rate of agitation from 50 to 75 rpm enhances the rate of dissolution. However, with the augmentation of agitation rate from 75 to 100 rpm no considerable changes in dissolution rate has been observed (Seeger et al., 2015). In another research, it was demonstrated that the effect of agitation also depends upon the position of the tablet in the dissolution vessel, owing to variation in the agitation force intensity at distinct locations inside the dissolution vessel (Todaro et al., 2017).
9.3.4.1.2 VIBRATION
Vibration may influence the dissolution process by altering the hydrodynamics of the dissolution media around the solute. Vibrational forces may be produced and transferred by several sources like walls, partitions, motors, other laboratory machines, operators, etc.
High intensity vibrations may alter the diffusion layer and considerably influence the dis- solution outcomes. Effects of vibration on the dissolution rate of Prednisone tablets have been reported in an investigation. It was also observed that the influence of vibration on drug dissolution depends upon multiple factors like properties of the drug, formulation factors, and type of dissolution method selected (Seeger et al., 2015). Marked influence of vibration induced by the laboratory scale mixer on the dissolution of disintegrating pred- nisone tablets was observed on USP basket as well as paddle-type apparatus.
9.3.4.1.3 FLOW PATTERN NONUNIFORMITIES
Variable flow rates of the dissolution medium have been observed at different sites inside the dissolution vessel. The difference in flow rates in the center of the vessel and near the wall and bottom of the vessel can possibly modify the dissolution profile of the formulation. Experimental findings have revealed variable flow patterns in the USP disso- lution apparatus II, particularly at the bottom of the dissolution vessel where the tablet is mostly positioned during dissolution test (Wlodarski et al., 2015).
9.3.4.1.4 ECCENTRICITY OF AGITATING (STIRRING) ELEMENT
Any minute deviation in the circularity of rotation of the central shaft in the dissolution vessel may affect the dissolution rates. As per the standard and officially documented pro- cedures the rotation of the shaft in the dissolution apparatus must be smooth and devoid of any considerable wobble. As per USP XX/NF XV the permissible limit of eccentricity is not more than62 mm from the axis of dissolution vessel, with a condition that it does not considerably influence the dissolution rate (Ameur, 2016).
9.3.4.1.5 SAMPLING PROBE POSITION AND FILTER
Probes used for sampling in the dissolution process may alter the flow system of the dissolution medium and possibly cause considerable changes in dissolution rate.
Experimental findings also revealed the differences in results obtained using automatic probe samplers and those acquired from manual sampling. USP/NF specifies that the sampling from the vessel must be done from the region halfway between the dissolution medium surface and the top of the rotating basket or paddle and minimum 1 cm from the vessel wall. Results of an investigation reveal the impact of size of the sample probe as well as location on the rate of dissolution of prednisone tablets. It was found that the large probe induces hydrodynamic variation which results in considerable changes in location- specific dissolution rates as compared to manual sampling (Bredael et al., 2015).
9.3.4.2 Dissolution Test Parameters
Parameters like pH, viscosity, temperature, components, volume, and nature of the dissolu- tion medium may have considerable effects on the dissolution profile of a drug. These para- meters might influence the diffusion coefficient of the solute (Miller, 1924). Stokes describes the effect of temperature and viscosity on the diffusion coefficient by the followingequation (9.1):
D5kT=6πηr (9.1)
wherekis the Boltzmann constant,T is the temperature, ηis the viscosity of the solution, andris the radius of a molecule in solution. It is clearly indicated from the equation that the diffusion is directly proportional to the temperature and inversely proportional to the viscosity. The specification for the temperature of dissolution medium as per USP/NF is 3760.5C which must be maintained in dissolution testing of oral dosage forms and suppositories.
An important parameter, i.e., pH, of the medium also significantly influences the disso- lution kinetics of the drug. For weak acids, the rate of dissolution enhances with a rise in pH. However, in the case of weak bases, the rate of dissolution increases with a drop in 299
9.3 FACTORS AFFECTING DISSOLUTION RATE (IN VITRO)
pH. For the maintenance of sink conditions, around 1 L of dissolution medium is generally taken in a single vessel. Some additional factors that possibly influence the results of the dissolution include adsorption, water sorption (of drug or excipients), humidity, and detection errors in the analytical method (Dressman and Reppas, 2016).
9.4 PHYSIOLOGICAL FACTORS AFFECTING IN VIVO DRUG DISSOLUTION RATE
Dissolution of pharmaceutical formulations is of paramount importance, as it is a prerequi- site for a dosage form to get dissolved in the GI fluids before being absorbed. Several physio- logical factors are known to affect dissolution as well as absorption of the drugs. The most common physiological factor includes the composition, pH, temperature buffer capacity, vis- cosity, osmolality, and hydrodynamics of GI fluid. Apart from the nature of GI fluid, some other factors that may affect the drug dissolution include mean residence time, gastric empty- ing, the presence of luminal enzymes, intestinal motility, hydrodynamics, and shear rates, etc.
9.4.1 Composition of GI Fluid
GI fluid is composed of liquid as well as solid materials. The liquids like water, gastric acid, electrolytes, and ingested fluids are commonly present along with viscous materials like mucus and swallowed saliva. Ingested solid food materials are also present in the GI fluid (Fuchs and Dressman, 2014). Hydrogen ion concentration of the gastric fluid influ- ences the pH and ultimately affects the dissolution of ionizable drugs. Pepsin present in the gastric fluid can affect the stability of peptide and protein. Presence of lipase may interfere with the release of drug from lipid-based formulations. Bile salts are another important component of gastric fluid that can act as a surfactant. Bile salts along with lipids tend to form micelles that may increase the wetting and solubility of drugs. Fluids present in the small intestine contain pancreatic secretions like bicarbonate, amylases, pro- teases,and lipases (Ashford, 2017).
Food is a variable component of the composition of GI fluid which results in varied values of the other physiological factors in the fed and the fasted condition. Variation in bioavailability of some drugs in the fed and fasted condition reveals the importance of food as an important component of GI fluids.
9.4.2 pH
Variable pH values were reported throughout the entire length of the GI tract.
Degradation of drugs owing to the pH-dependent hydrolysis may be possible in the GI tract. In the lumen also, the pH may affect the dissolution and absorption of some drugs if they are weak electrolytes. The marked effect of the pH on the solubility of weak electro- lytes was also reported (Qiu et al., 2016). Influence of pH in dissolution profile of ketoco- nazole tablets was studied. It was found that the increase in pH decreases the dissolution rate as well as the extent.
9.4.3 Buffer Capacity
The rate of dissolution of the ionizable drugs can be affected considerably owing to the buffer capacity of the fluids present in the GI tract. High buffer capacity may account for the resistance in pH change at the interface between drug and fluid. This may ultimately influence the rate of dissolution of the ionizable drugs (Augustijns et al., 2014).
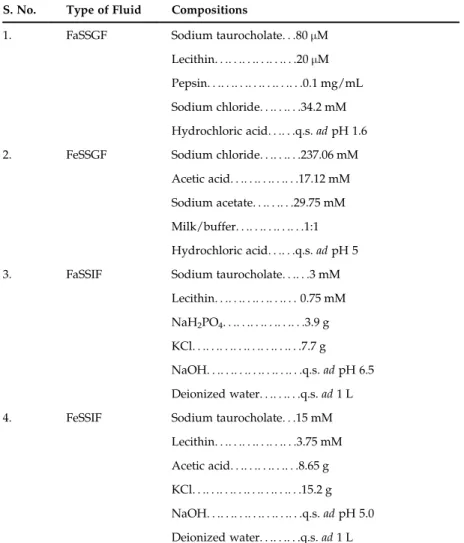
TABLE 9.2 Compositions of Various Types of Gastric and Intestinal Fluids S. No. Type of Fluid Compositions
1. FaSSGF Sodium taurocholate. . .80μM Lecithin. . .. . .. . .. . .. . .. . .20μM Pepsin. . .. . .. . .. . .. . .. . .. . .0.1 mg/mL Sodium chloride. . .. . .. . .34.2 mM Hydrochloric acid. . .. . .q.s.adpH 1.6 2. FeSSGF Sodium chloride. . .. . .. . .237.06 mM
Acetic acid. . .. . .. . .. . .. . .17.12 mM Sodium acetate. . .. . .. . .29.75 mM Milk/buffer. . .. . .. . .. . .. . .1:1 Hydrochloric acid. . .. . .q.s.adpH 5 3. FaSSIF Sodium taurocholate. . .. . .3 mM
Lecithin. . .. . .. . .. . .. . .. . .0.75 mM NaH2PO4. . .. . .. . .. . .. . .. . .3.9 g KCl. . .. . .. . .. . .. . .. . .. . .. . .7.7 g NaOH. . .. . .. . .. . .. . .. . .. . .q.s.adpH 6.5 Deionized water. . .. . .. . .q.s.ad1 L 4. FeSSIF Sodium taurocholate. . .15 mM
Lecithin. . .. . .. . .. . .. . .. . .3.75 mM Acetic acid. . .. . .. . .. . .. . .8.65 g KCl. . .. . .. . .. . .. . .. . .. . .. . .15.2 g NaOH. . .. . .. . .. . .. . .. . .. . .q.s.adpH 5.0 Deionized water. . .. . .. . .q.s.ad1 L
FaSSGF, fasted-state simulated gastric fluid;FeSSGF,1fed-state simulated gastric fluid;FaSSIF, fasted state simulated intestinal fluid;FeSSIF, fed state simulated intestinal fluid.
301
9.4 PHYSIOLOGICAL FACTORS AFFECTINGIN VIVODRUG DISSOLUTION RATE
9.4.4 Osmolality
A number of electrolytes present in the lumen explains the osmolality of gastric fluids (Cl2, Na1, K1, Ca21;Table 9.2). Osmolality may influence the release profile as well as the dissolution of the drug. Various studies on osmolality were reported to have a significant influence on the dissolution profile (Walsh et al., 2016; Ali et al., 2017).
9.4.5 Surface Tension
Surface tension can affect dissolution by influencing wetting of the dosage form, with a higher surface tension leading to decreased wetting (Yuan and Lee, 2013). Gastric surface ten- sion values in the fasted and fed states range from about 4146 and 3031 mN/m, respec- tively (Xie et al., 2014). In the upper small intestine, surface tension values range from 2846 mN/m in the fasted state, and 2737 mN/m in the fed state (Verwei et al., 2016).
9.4.6 Viscosity
The viscosity of the GI fluids depends upon the type and amount of food ingested.
Generally the viscosity of the fluids in the GI tract increases in the fed state. Prolonged gastric emptying and GI transit time has been reported with the enhanced viscosity of GI fluids (Van Den Abeele et al., 2017).
9.4.7 Temperature
The temperature of the GI fluids may influence the rate of dissolution. The solubility and diffusion coefficient of the drug may be affected by the variation in the temperature.
The GI tract temperature at resting state was reported to be 37C. This temperature may increase after a physical workout or in the disease condition (Savjani et al., 2012).
9.4.8 Volume
The rate and extent of dissolution of the drug as well as absorption depends on the vol- ume of water in the GI fluids especially in the stomach and small intestine (Mudie et al., 2014). The dissolved drug concentration mainly depends upon the volume of the GI fluids.
9.4.9 Hydrodynamics
Marked effects of GI motility on the hydrodynamics of GI contents, intestinal transit, and gastric emptying time have been reported (Guerra et al., 2012). These contractile motions exert forces on the GI content in which the drug is present and thereby may affect its dissolu- tion rate in multiple ways. These forces may break the drug aggregates and lead to an increase in the effective surface area, an increase in the agitation forces so as to enhance the solubility of the drug in the GI contents, resulting in increased drug dissolution rates. These motility forces may also reduce the thickness of the static diffusion layer. In an investigation, hydrodynamics of the dissolution medium was reported to affect the mass transfer and
dissolution rate of theophylline and naproxen conventional release tablets. Also, variations in hydrodynamics of the dissolution medium have been observed in an experiment which is affected by the surface and location of the cylindrical tablet. The change in fluid velocity at specific regions thus influences the dissolution rate (Shekunov and Montgomery, 2016).
9.4.10 Gastric-Emptying Rate and Forces
Gastric emptying generally refers to the rate at which the contents of the stomach exits into the small intestine. The rate-determining step in the absorption of fast dissolving drugs from immediate release dosage forms can possibly be gastric emptying. Several fac- tors influencing the gastric emptying rate include the quantity of ingested food, the nature of ingested food, and the contraction phase at which the food was taken. The gastric emp- tying time also influences the contact time of the drug with GI fluids at specific pH, and thus may affect the dissolution of drugs which get preferentially dissolved in the stomach (Koziolek et al., 2015).
9.4.11 Concomitant Use of Antisecretory Therapy
Dissolution and absorption profile of the different formulations of levothyroxine have been investigated on the patients taking proton pump inhibitors. The experimental results suggest that the dissolution rate of the tablet formulation was reduced and the intestinal absorption of levothyroxine was altered owing to the increase in pH by PPI as compared to control. However, the effect of increased pH on drug dissolution and absorption has not been observed in the case of the oral solution of levothyroxine (Vita et al., 2014;
Brancato et al., 2014).
9.5 DISSOLUTION TESTING
Dissolution testing is a tool used to measure the release of drug from the dosage form.
It is the most important method used in all phases of drug development.
9.5.1 Approaches for Dissolution Test Method Design
Dissolution test method is either discriminatory for QC purposes or biorelevant for IVIVC purpose. A balance is needed to be maintained between the two approaches. If the method is over discriminatory, the result is wasted and delays in development of new pro- ducts to meet unmet needs, and if it is under discriminatory, it results in a lack of mean- ingful product quality control (Lawrence et al., 2014).
9.5.2 Design of Dissolution Method
When developing a dissolution method, it is important to take a logical, systematic approach to the process, and ensure that all the scientifically and regulatory guidelines 303
9.5 DISSOLUTION TESTING
given are borne in mind. A robust methodology should be free of significant interferences (e.g., matrix effects due to excipients), give low variability (precision), and produce a good profile shape. The methodology must also be challenged to distinguish amongst batches of material with varied quality attributes. Once the process of identifying suitable medium and apparatus are complete, further optimization of the method would be required to evaluate ionic strength of the medium, agitation rate, and, if required, surfactant concen- tration. The final developed method should have the ability to discriminate between dif- ferent formulations/batches, but still maintain acceptable precision and robustness. With regards to precision, typical limits for early and later time-points would be ,20% and ,10% RSD, respectively. In special cases, like modified release or fixed-dose combination products, the relevant variations are done to the basic design of the method (Ashokraj et al., 2016).
9.5.2.1 Choice of Dissolution Equipment
Different designs of dissolution apparatus are important requirements due to variable physicochemical properties of different drug products (Mann et al., 2017). Various types of USP apparatus are available in pharmacopoeias, the most common amongst them are Basket type (USP apparatus I), paddle type (USP apparatus II), reciprocating cylinder type (USP apparatus III), and flow through cell type (USP apparatus IV). If we need to use dif- ferent types of dissolution medium simultaneously then a reciprocating cylinder type apparatus should be used. Flow through cell type (USP IV) is beneficial in overcoming the nonsink conditions. This apparatus IV is also advantageous in providing better IVIVC due to comparable hydrodynamic flow patterns of dissolution medium (Forrest et al., 2017).
USP Dissolution Apparatus
USP 1: This is a small basket attached to the shaft that contains the sample. The shaft and basket spin inside the test media.
USP 2: This is the most common form of dissolution testing, where a flat paddle is attached to the shaft and spins in the test media.
USP 3: This where the use of a reciprocating cylinder is employed. A sample is placed inside a glass tube with a mesh base and moved up and down in the media vessel.
USP 4: This is where the sample is placed inside a static cell, called a flow-cell, and the test media is pumped through the cell in a continuous flowing motion, often referred to as flow-through. You can have different cells for different sample types.
USP 5: This is the paddle-over-disk method. A USP 2 paddle is attached to the shaft, and a mesh disk is fixed beneath the media vessel. The sample is placed beneath the disk, holding it in place.
USP 6: This is the use of a rotating cylinder. Often a patch is stuck to the outside of the cylinder, which is attached to the shaft and spins.
USP 7: This is the reciprocating disk method. A disk is attached to the shaft which is raised and lowered in the test media. The sample placed above the disk (Vaghela et al., 2011).
9.5.2.2 Selection of Agitation Rate
The rotational speed is also an important parameter that needs to be appropriately con- trolled. Very low agitation speed may cause coning and lead to very slow dissolution (Higuchi et al., 2015). To avoid this issue, a faster rotation speed can be used. The high rate of agitation speed may also be problematic due to inability to distinguish amongst acceptable and nonacceptable batches. Rotational speeds in the range 50100 rpm are vali- dated to be appropriate for the paddle method. If the basket method is to be used, a rota- tional speed of up to 150 rpm may be appropriate, as the linear velocity generated in the vessel is considerably lower for a given rotational speed for the basket than for the paddle.
Rotational speeds in these ranges should also be appropriate for quality control tests (Shohin et al., 2016).
9.5.2.3 Dissolution Medium
For selecting the dissolution medium, the most important factor to be considered is the solubility data of the product and dosage regimen to maintain the sink conditions. Oral formulations should be analyzed firstly at the physiological pH range. The selection of medium also depends upon the stability of drug product in the medium and relevance of in vivo performance. For poorly aqueous soluble compounds, surfactants can be used to maintain the sink condition and improve the aqueous solubility of those drug products (Shohin et al., 2016; Lawrence, 2012).
9.5.2.4 Analytical Methods Associated With the Dissolutions
UV and HPLC are the most commonly employed methods used to analyze the results of dissolution. With the advancement of analytical equipment, those techniques nowadays are replaced with UPLC or RR LC methods. HPLC is the method of choice in most cases as it is also beneficial in separating and detecting the degradation products. The equip- ment and methods employed for analyzing the results should be qualified and validated by following the standard guidelines.
9.5.2.5 Automation
Automation of the dissolution methods not only helps in increasing the efficiency of methods but is also beneficial in reducing the manual errors. The fully automated system can free the dissolution scientist from 90% of the protocol steps in the labora- tory as it is equipped with functional and mechanical automation (Al-Gousous and Langguth, 2015).
9.5.2.6 Data Simulation
Various simulation tools like DDD plus are used as surrogates for dissolution testing. It enhances product understanding to help with risk assessment process and offer some miti- gation options to increase speed in product development to allow for developing a clini- cally relevant dissolution specification strategy. This technique can be used in dissolution modeling and surrogate testing to achieve real-time release testing for dissolution.
GastroPlus is also one of the most commonly used software for analyzing the dissolution data (Khurana et al., 2017).
305
9.5 DISSOLUTION TESTING
9.6 DISSOLUTION PROFILE: ANALYSIS AND COMPARISON
Dissolution testing for immediate release drug products could be a single point or two point/multipoint analysis. The quality of drug product is ensured by performing the multipoint dissolution analysis, especially for poorly water-soluble products (Wang et al., 2016).
9.6.1 Dissolution Profile
The percentage of drug dissolved against various sampling time points are plotted. This plot can be termed as dissolution profile and gives a complete understanding of in vivo release characteristics.
9.6.2 Analysis of Cumulative Dissolution Profiles
Various theories are proposed for dissolution profile analysis. Wagner’s theory inter- prets the results of plots because drug products follow first-order kinetics under sink con- ditions (Wagner, 1969). Kitazawa’s theory interpreted the results in the form of a straight line with two phases. The first phase suggests the disintegration or disruption of the drug product, while the second phase suggests the initiation of dissolution process (Kitazawa et al., 1977). Another approach is of Carstensen, which generated the skewed S-shaped curves followed by log-normal distributions. This curve gives the idea about the initial lag phase of the dissolution process (Carstensen et al., 1978).
9.7 IN VITRO-IN VIVO CORRELATION (IVIVC) 9.7.1 Definition
The Food and Drug Administration (FDA) defines IVIVC as “a predictive mathematical model describing the relationship between an in vitroproperty of a dosage form and an in vivoresponse.”
Various models have been proposed to predict the data observed byin vitroinvestiga- tion toin vivoperformance (Rohn, 2014). The IVIVC studies aimed to employ drug release kinetics from two or more formulations to correlate anticipated drug-plasma profile (Somnath, 2016). More exhaustive details have provided in the following subsections deal- ing with the significance and purpose of IVIVC.
9.7.2 Significance and Purpose of IVIVC
Pharmaceutical product development required IVIVC to establish the release character- istics. IVIVC is also employed as an alternative for in vivo experiments in similar condi- tions (Kesisoglou et al., 2015b). However, even minor changes done in any process variable, demands the establishment of IVIVC making the process highly time consuming as well as expensive (Masaad et al., 2016).
The formulation optimization may need to alter the percentage of compositional materi- als, formulation processing strategy, machines used to manufacture, and batch sizes. This leads to putting extra efforts for bioequivalence testing with an optimized formulation.
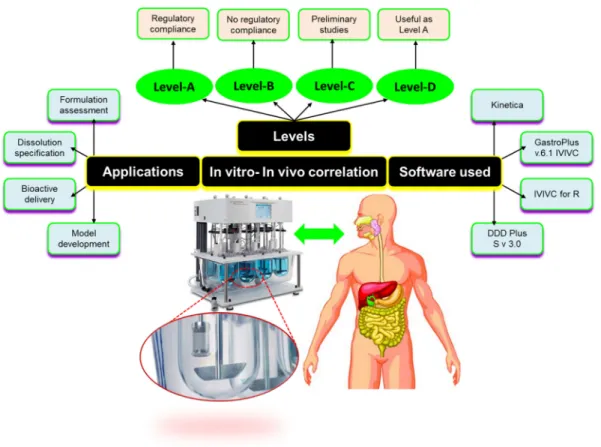
IVIVC serves as an index to justify the therapeutic effectiveness of the formulation (Somayaji et al., 2016). A schematic presentation of IVIVC including classification, levels, software used, and applications is depicted inFig. 9.5.
9.7.3 Levels of IVIVC Correlation
With IVIVC of global dissolution time characteristics we are faced with a situation in which each of several different formulations must be tested, not only in anin vitrodissolu- tion system but also, and even more importantly regarding effort and expense, in humans (Margolskee et al., 2016).
FIGURE 9.5 Schematic representation of various aspects of IVIVC. IVIVC works in various levels of correlation from Level A to Level D. Level A correlation represents maximum degree of correlation and most preferred type of correlation; Level B correlation comparesin vitrodissolution rates within vivo residence period and does not gives information aboutin vivoplasma profile; Level C correlation is the weakest level of correlation as it involves only a partial relationship between absorption and dissolution and does not represent the complete plasma drug profile;
Level D correlation is a qualitative type of correlation and not beneficial for regulatory purposes.
307
9.7IN VITRO-IN VIVOCORRELATION (IVIVC)
9.7.3.1 Level A Correlation
It involves correlation amongst completein vitroandin vivoprofiles. Level A correlation is most preferred in pharmaceutical industries due to its regulatory relevance. Due to its indus- trial applicability and regulatory significance, this type of correlation represents a maximum degree of correlation. It involves point-to-point relation amongstin vitroin vivodissolution data and drug release kinetic data from the pharmaceutical product. Another aspect of Level A correlation is that it permits a biowaiver to alter a manufacturing site, raw product vendors, and minute modifications in the formulation (Mittapalli et al., 2017).
9.7.3.2 Level B Correlation: The Statistical Moment Theory
This correlation follows the principles of statistical moment analysis. It involves the comparison betweenin vitrodissolution rates of the formulation with anin vivoresidence period. In contrast to Level A IVIVC, it does not give information about thein vivoplasma profile. Moreover, this type of correlation does not attribute to the quality standards as per the regulatory guidelines (Gelman et al., 2014).
9.7.3.3 Level C Correlation
This is the weakest level of correlation as it involves the only partial relationship between absorption and dissolution and does not represent the complete plasma drug pro- file, which is very important to define the behavior of a drug product. This type of correla- tion shows the relation between dissolution and pharmacokinetics, but it is limited to one pharmacokinetic parameter only.
9.7.3.4 Multiple Level C Correlations
This multiple correlation is important in justifying the biowaiver. This correlation estab- lishes the relationship between one or more parameters related to pharmacokinetics with the dissolution. This correlation shows the relationship by multiple dissolution time points (more than three) such as in early, mid, and late stages of the product development (Kesisoglou et al., 2015a;Shen and Burgess, 2015).
9.7.3.5 Level D Correlation
It is a qualitative type of correlation and not beneficial for regulatory purposes. This type of correlation is helpful only in assisting the product development of a formulation.
9.7.4 Applications of IVIVC
9.7.4.1 Application in Drug Delivery System
Most of the literature available suggest that IVIVC is extensively used for the product development of oral dosage forms. IVIVC is an excellent tool for the prediction of the drug release rate from numerous systems such as modified release system, controlled, sus- tained, extended, and delayed release systems (Dressman and Reppas, 2016; Andhariya and Burgess, 2016).
9.7.4.2 Pharmaceutical Product Development
One of the important requirement for product development is the selection of an appro- priate drug molecule, and this selection depends on the drug “developability,” involving understanding its physicochemical characteristics.
9.8 BIOPHARMACEUTICAL CLASSIFICATION SYSTEM (BCS) AND BIOPHARMACEUTICAL DRUG DISPOSITION CLASSIFICATION
SYSTEM (BDDCS)
The biopharmaceutical classification system (BCS) is a scientific tool to classify drugs and depends on the solubility and intestinal permeability of drug molecules. The principle of the BCS says that if two products produce the similar concentration data along the GIT, they will exhibit the same plasma profile after oral administration. In context to bioequiva- lence, it assumed that drugs with high permeability, high solubility prepared as fast dis- solving products will be bioequivalent. Unless significant alterations are made to the formulation, dissolution data can be employed as a surrogate for pharmacokinetic data to show the bioequivalence of two drug products (Mitra et al., 2015).
9.8.1 BCS Classes and Parameters
According to the BCS, drug candidates are classified as follows (Fig. 9.6).
Class 1: High Solubility—High Permeability Class 2: Low Solubility—High Permeability Class 3: High Solubility—Low Permeability Class 4: Low Solubility—Low Permeability
The reason behind the difference inin vivo profiles of two dissimilar products resides in the differences in drug dissolution in vivo. However, when the in vivo dissolution of an IR solid oral dosage form is rapid or very rapid in relation to gastric emptying and the drug has high solubility, the rate and extent of drug absorption is unlikely to be dependent on drug dissolution and/or GI transit time (Khan et al., 2016). In these FIGURE 9.6 Illustration of various classes of biopharmaceutical classification system. Class I represents the maximum solubility and maxi- mum permeability class; Class II—maximum permeability but minimum solubility; Class III—
maximum solubility but minimum permeability and; Class IV—minimum solubility and mini- mum permeability.
309
9.8 BIOPHARMACEUTICAL DRUG DISPOSITION CLASSIFICATION SYSTEM (BDDCS)
conditions, the performance ofin vivobioavailability or bioequivalence may not be neces- sary for drug products containing class 1 and class 3 drugs, as long as the inactive ingre- dients employed in the dosage form do not significantly affect absorption of the active ingredients (Kubbinga et al., 2014).
Dose number (Do) may be defined as the mass divided by the product of uptake vol- ume and solubility of the drug or it may be regarded as the volume required for solubility of the maximum dose strength of a drug (Eq. 9.2).
DO5 M
V
Cs (9.2)where, M5highest dose strength (milligrams), Cs5Solubility (milligrams/milliliter), V5250 mL (Qiu et al., 2016).
Dissolution number (Dn) can be defined as the ratio of the mean residence time to mean absorption time and can be evaluated concerning the time required for drug dissolution, which is the ratio of the intestinal residence time and dissolution time (Eqs. 9.3 and 9.4).
Dn5Tsit=Tdiss (9.3)
Dn53DCsðTsitÞ=r2d (9.4)
where D5diffusivity, d5density, r5initial particle radius, Tsit5intestinal residence time,Tdiss5dissolution time (Klutz et al., 2015).
Absorption number (An) may be defined as the time required for absorption of the dose administered which is a ratio of mean residence time to mean absorption time of drug (Eq. 9.5).
An5Tsit=Tdiss5PeffðTsitÞ=r (9.5) where,Peff5permeability,r5gut radius.
BCS Class I compounds (e.g., metoprolol) shows high absorption number (An) and a high dissolution number (Dn), signifying that the rate-determining step for drug absorp- tion is possibly dissolution. Class I compounds are generally well absorbed if they are stable or are not affected by the first-pass effect. For immediate-release products of Class I compounds, the absorption rate is likely to be dominated by the gastric empty- ing time, and no direct correlation between in vivo data and in vitro dissolution data is expected. Therefore, dissolution analysis for such drug products should be designed chiefly to predict that the drug is released quickly from the dosage form under the par- ticular test conditions. A dissolution specification for which 85% of drug contained in the IR dosage form is dissolved in less than 15 min may be sufficient to ensure bioavail- ability since the mean gastric half-emptying time is 1520 min (Papich and Martinez, 2015).
A Class II drug, for example, phenytoin, possesses a high absorption number (An) and a low dissolution number (Dn). Dissolution is the rate-limiting step for drug absorption. The influence of dissolution on the absorption of BCS Class II drugs can be classified into two scenarios: solubility-limited absorption or dissolution-limited absorp- tion. These two scenarios are best illustrated by griseofulvin and digoxin. In the case of solubility-limited absorption, griseofulvin exhibits a high dose number (Do) and a low dissolution number (Dn). Although in theory, absorption of griseofulvin can be
improved by taking more water with the administered dose (decreasing Do), this approach is impractical due to the limitation in the physiological and anatomical capac- ity of the stomach for water.
Therefore, the only practical way to improve the absorption of griseofulvin is to decrease Do and increase Dn by enhancing its solubility through appropriate formulation approaches such as solid dispersion (Stiehler et al., 2015). On the other hand, in the case of dissolution-limited absorption, digoxin has a low dose number (Do) and a low dissolution number (Dn). Despite the small volume (21 mL) of fluids required to dissolve a typical dose of digoxin (0.5 mg), this drug dissolves too slowly for the absorption to take place at the site(s) of uptake. However, its dissolution rate can be improved simply by increasing Dnthrough the reduction in particle size. Thus, for BCS Class II drugs, a strong correlation between in vitro dissolution data and in vivo performance (e.g., Level A) is likely to be established. When a BCS Class II drug is formulated as an extended-release product, an IVIVC may also be expected.
For BCS Class III drugs (e.g., cimetidine), permeability is likely to be a dominant factor in determining the rate and extent of drug absorption. Hence, developing a dissolution test that can predict the in vivo performance of products containing these compounds is generally not possible. Since BCS Class IV drugs, which are low in both solubility and permeability, present significant problems for effective oral delivery, this class of drugs is generally more difficult to develop in comparison to BCS Class I, II, and III drugs (Sandri et al., 2014).
9.8.2 Biopharmaceutical Drug Disposition Classification System (BDDCS)
It divides compounds into four classes based on their permeability and solubility. This classification system is useful in predicting effects of efflux and uptake transporters on oral absorption as well as on post absorption systemic levels following oral and intrave- nous dosing. Wu and Benet recognized that for drugs exhibiting high intestinal permeabil- ity rates, the major route of elimination in humans was via metabolism, (e.g. the BCS/
BDDCS Class 1 drug letrozole) whereas drugs exhibiting a poor intestinal permeability rate were primarily eliminated in humans as unchanged drug in urine and bile, and they termed this as Biopharmaceutics Drug Disposition Classification System (BDDCS) (Camenisch, 2016).
9.9 ROLE OF DISSOLUTION TESTING IN PHARMACEUTICAL PRODUCT DEVELOPMENT
Product development is a prolonged, arduous, and expensive task with high risk of fail- ure. The pharmaceutical companies spend hundreds of millions of US dollars on research and development, and it takes around 12 to 14 years for the processes of “discovery” and clinical trials from the laboratory to end consumers (patients). Only one-tenth of the drugs entering the preclinical phase could actually reach the clinical phase. Further, regulatory approval is the utmost requirement to bring a drug to market. Regulatory requirements 311
9.9 ROLE OF DISSOLUTION TESTING IN PHARMACEUTICAL PRODUCT DEVELOPMENT
have definitely up scaled the cost of pharmaceutical research and development. So, there is always a need to reduce the regulatory burden and minimize the time and cost involved in drug development (Pocock, 2013).
Dissolution testing vexes the scientific, technical, and regulatory challenges related to drug development complexities. The major contribution of dissolution testing in Pharmaceutical Product Development includes making the product development process cost-effective and less time-consuming in two ways: reducing the regulatory burden at drug approval and postapproval stages and minimizing the probability of end product failure. Dissolution testing helps to reduce the regulatory burden by acting as a surrogate forin vivoproduct performance, by developingin vivopredictivein vitrodissolution meth- ods, developing IVIVC, by using BCS, IVIVC as a criterion to waive the bioequivalence studies, predicting drug bioavailability and drug metabolism. The latter is achieved by routine use in QC to ensure batch to batch uniformity and product quality, in research and development, to develop, optimize, and assess the new drug product by QbD, moni- toring critical manufacturing variables, and examining the stability of the formulation (Allen and Ansel, 2013).
9.9.1 Pharmaceutical Product Development Phases
As depicted inFig. 9.7 (Scheubel, 2010), dissolution testing is a necessary part at each stage of the drug development process from nonclinical to postmarketing, performing essential functions like drug selection, formulation selection, method optimization, IVIVC prediction, biowaiver assessment, quality, and stability checks.
9.9.1.1 Drug Product Approval
Pharmaceutical product development cycle includes various stages, and at each stage, dissolution testing performs significant functions.
Investigational New Drug Application (IND)—The application requires data of experi- ments done on laboratory animals and how clinical trials are planned. Dissolution testing enhances lead formulation quality by salt selection as per BCS and screens out poor- performing prototypes and saves animal resources (Guarino and Guarino, 2016).
Institutional Review Board (IRB) drafts the clinical trial protocols comprising of four phases.
Phase Itrials test for safety. Dissolution testing performs various functions at phase 1 level, like designing phase I formulation, salt selection of drug substance, examining excipient compatibility, choosing toxicology formulations, and maintaining quality stan- dards for the first clinical drug administration. This helps to identify formulations with improved dissolution characteristics (He et al., 2017).
Phase IItrials test for effectiveness in addition to further safety monitoring. The final dosage form to be tested in phase III studies is ascertained at this level. Dissolution test- ing can be carried out to serve many important roles at this stage, which include pro- cess and product development, a link establishment between design space and the target product profile, elucidation of the drug-release mechanism, regulation of the
variations in drug product stability testing, and maintenance of batch release quality, as well as batch-to-batch uniformity (Blessy et al., 2014).
Phase IIIincludes joint working of the FDA and the drug’s sponsor to set the phase III study protocol and determine riskbenefit data. The phase III drug development stage has the main purpose to develop in-depth expertise and robust data regarding the drug product and the manufacturing process for filing drug approval dossiers, to commence the stability studies, and to prepare for effective and profitable product launch. Dissolution testing at this stage serves as a surrogate for in vivobio- availability or bioequivalence, as a tool to project the drug product’s clinical FIGURE 9.7 Various applications of dissolution testing in various phases of product development. Blue color showing initial phase and orange color showing late phase development; black color is for market;
red arrows show interplay of dissolution and black arrows show the interaction between the different develop- ment phases.
313
9.9 ROLE OF DISSOLUTION TESTING IN PHARMACEUTICAL PRODUCT DEVELOPMENT
performance, and is used for process development and optimization, as well as qual- ity control testing.
Further, the application review is at the discretion of the FDA under New Drug Application.
Phase IVtrials are conducted to analyze the outcomes evolving after the drug approval and its large-scale use. Dissolution testing at this stage contributes to SUPAC or biowai- ver dossier filling.
Dissolution testing also plays an important role in FDA’s attempts to decrease the regulatory load and unneeded clinical studies in developing consistently high-quality, safe, and effective generic drugs without compromising the drug product quality.
Similarity factor data for test drug and reference listed drug can be employed for this purpose.