Distribution and Ages of Magellanic Cepheids
Cecilia H. Payne-Gaposchkin
SMITHSONIAN CONTRIBUTIONS TO ASTROPHYSICS • NUMBER 16
SERIAL PUBLICATIONS OF THE SMITHSONIAN INSTITUTION
The emphasis upon publications as a means of diffusing knowledge was expressed by the first Secretary of the Smithsonian Institution. In his formal plan for the Insti- tution, Joseph Henry articulated a program that included the following statement:
"It is proposed to publish a series of reports, giving an account of the new discoveries in science, and of the changes made from year to year in all branches of knowledge."
This keynote of basic research has been adhered to over the years in the issuance of thousands of titles in serial publications under the Smithsonian imprint, com- mencing with Smithsonian Contributions to Knowledge in 1848 and continuing with the following active series:
Smithsonian Annals of Flight Smithsonian Contributions to Anthropology
Smithsonian Contributions to Astrophysics Smithsonian Contributions to Botany Smithsonian Contributions to the Earth Sciences
Smithsonian Contributions to Paleobiology Smithsonian Contributions to Zoology Smithsonian Studies in History and Technology
In these series, the Institution publishes original articles and monographs dealing with the research and collections of its several museums and offices and of profes- sional colleagues at other institutions of learning. These papers report newly acquired facts, synoptic interpretations of data, or original theory in specialized fields. These publications are distributed by mailing lists to libraries, laboratories, and other in- terested institutions and specialists throughout the world. Individual copies may be obtained from the Smithsonian Institution Press as long as stocks are available.
S. DILLON RIPLEY
Secretary
Smithsonian Institution
SMITHSONIAN CONTRIBUTIONS TO ASTROPHYSICS • NUMBER 16
Distribution and Ages of Magellanic Cepheids
Cecilia H. Payne-Gaposchkin
SMITHSONIAN INSTITUTION PRESS City of Washington
1974
ABSTRACT
Payne-Gaposchkin, Cecilia H. Distribution and Ages of Magellanic Cepheids.
Smithsonian Contributions to Astrophysics, number 16, 32 pages, 8 figures, 15 tables, 1974.—The distribution and ages of the Magellanic Cepheids are dis- cussed under four major topics :
1. The Large Cloud is shown to contain components with a variety of ages.
A time scale is set up by means of the color-magnitude arrays of clusters, the integrated colors of clusters, the luminosities of Wolf-Rayet stars, and the periods of Cepheids. I t is suggested that (unlike other components of the Large Cloud) the red globular clusters may constitute a halo.
2. Changes of period for galactic and Magellanic Cepheids are used to test the time scales derived for Cepheids. The computed time scales are seen to be of the right order, and the actual time scales are similar for Cepheids in the Galaxy and in the Clouds. If these time scales are sensitive to composition, the changes of period furnish no evidence for differences of composition in the three systems.
3. Evidence bearing on possible differences of composition is reviewed. So far as Cepheid variables (and stars of similar age) are concerned, there is no good evidence for differences of composition. This conclusion does not apply to the globular clusters, and perhaps not to the intermediate-age clusters; those in the Clouds are probably of similar composition to those of similar age in the Galaxy.
4. The period-amplitude and period-frequency relations, and their differ- ences, are shown to be compatible with differences in the time of formation of stars that are now Cepheids in the two Clouds and in the Galaxy.
The discussion under these four topics suggests that the observed differ- ences between the three systems can be interpreted in terms of differences in the timetable of star formation, without the need to invoke initial differences of composition.
OFFICIAL PUBLICATION DATE is handstamped in a limited number of initial copies and is recorded in the Institution's annual report, Smithsonian Year. SI PRESS NUMBER 5109.
SERIES COVER DESIGN : Corona a s seen in total solar eclipse.
Library of Congress Cataloging in Publication Data Gaposchkin, Cecilia Helena Payne, 1900-
Distribution and ages of Magellanic Cepheids.
(Smithsonian Contributions to Astrophysics, no. 16) Supt. of Docs, no.: SI 1.12/2: 16.
1. Cepheids. 2. Magellanic Clouds. I. Title. II. Series.
QB461.S6 vol. 16 [QB835J 523.01'08s [523.8'4425] 74-tl88
For sale by the Superintendent of Documents, U.S. Government Printing Office Washington, D.C. 20402 - Price 85 cents
Stock Number 4700-00300
Distribution and Ages of Magellanic Cepheids
Cecilia H. Payne-Gaposchkin
A Time Scale for Clusters and Cepheid Variables
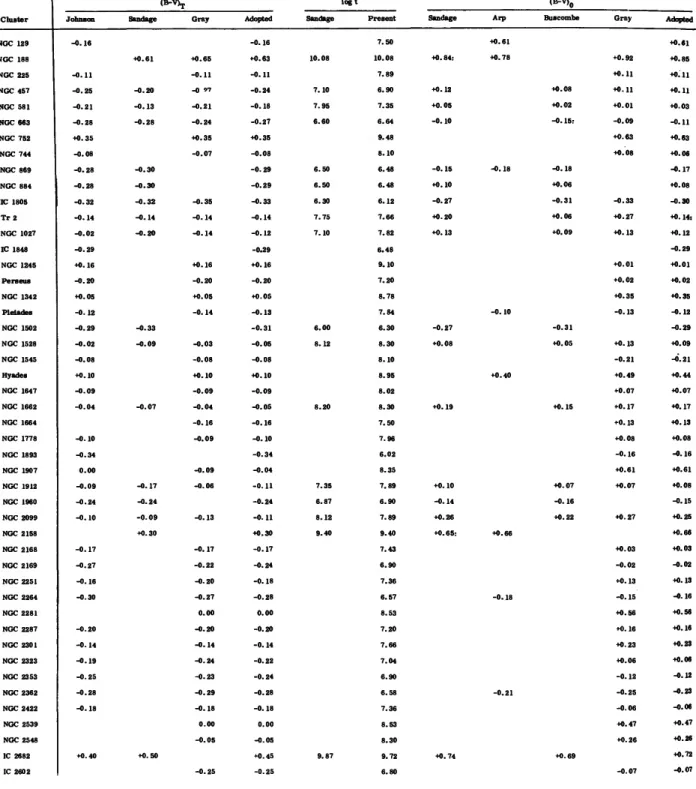
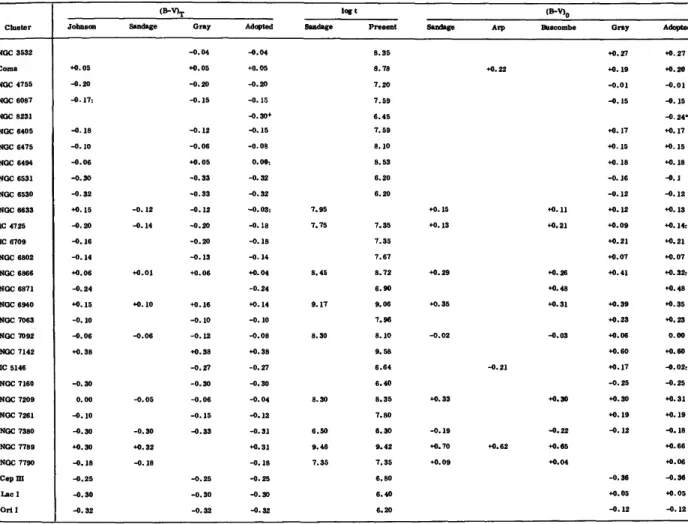
The color-magnitude diagrams of open clusters furnish a classical basis for a scale of ages. Table 1 contains data on (B —V)T5 the intrinsic color at the turnoff, and on (B —V)o, the intrinsic inte- grated color, for clusters where both have been determined. Successive columns give values of ( B - V ) T published by Johnson et al. (1961), Sandage (1963), Gray (1965), and an adopted mean. The next two columns give the logarithm of the age in years, taken from Sandage (1963) for the clusters for which he published it, and the logarithm of the ages of all the clusters in the table, deduced from a smooth freehand curve representing the data of the previous column.
The remaining columns give values of (B —V)o as published by Sandage (1963), Arp (1964), Buscombe (1964), and Gray (1965) and finally an adopted mean. Data for a few clusters, de- noted by asterisks in the final column, are from Schmidt-Kaler (1967).
The age is determined from (B —V)T, which sets a minimum for the cluster. The integrated colors, which include measured values of ( B - V )o and summed values of ( B - V )o, are less accurate as criteria of age. They will be used later in our discussion of the Large Magellanic Cloud.
We now apply the cluster time scale to an ex- amination of the ages of Cepheid variables. A Cecilia H. Payne-Oapogchkin, Smithsonian Institution Astrophyttical Observatory, Cambridge, Massachussets 02138. '
Cepheid that is a member of an open cluster must of course conform to it in position and in radial velocity. It should also have a similar color excess when the latter is corrected for de- pendence of color excess on intrinsic color, as de- scribed, for example, by Wildey (1963) and Jung (1970). The period of the Cepheid must also be considered in assigning cluster membership.
It has long been recognized that there should be a relationship between the age of a Cepheid and its period. Young (1961) suggested (essen- tially on the basis of an assumed mass-luminosity relation) a "semitheoretical formula":
log t 0.714 log P + 8.57, (1) where "P is the period in days, and t, as before, the age in years. Kippenhahn and Smith (1969) have considered the ages of Cepheids on the basis of the position of the Cepheid strip in the evolutionary tracks of chosen models. By weight- ing the data given by Kippenhahn and Smith ac- cording to the duration of the Cepheid stage for each star considered, Tammann (1969) has ob- tained a similar relation:
log t 0.651 log P + 8.16. (2) Equations (1) and (2) differ principally in the size of the constant that defines the time scale, the ages deduced by Young's formula being greater by a factor of about 2.5. We shall assume that the Cepheids in clusters have the same age as the clusters and, on this basis, deduce a time scale for Cepheids.
Table 2 examines the credentials of a number of Cepheids that lie near open clusters. Succes-
SMITHSONIAN CONTRIBUTIONS TO ASTROPHYSICS
TABLE 1.—Colors of open clusters
Cluster NGC 129 NGC 188 NGC 225 NGC 457 NGC 581 NGC 663 NGC 752 NGC 744 NGC 869 NGC 884 IC 1805 T r 2 NGC 1027 IC 1848 NGC 1245 Perseus NGC 1342 Pleiades NGC 1502 NGC 1528 NGC 1545 Hyades NGC 1647 NGC 1662 NGC 1664 NGC 1778 NGC 1893 NGC 1907 NGC 1912 NGC 1960 NGC 2099 NGC 2158 NGC 2168 NGC 2169 NGC 2251 NGC 2264 NGC 2281 NGC 2287 NGC 2301 NGC 2323 NGC 2353 NGC 2362 NGC 2422 NGC 2539 NGC 2548 IC 2682 IC 2602
Johnson -0.16
-0.11 -0.25 -0.21 -0.28 +0.35 -0.08 -0.28 -0.28 -0.32 -0.14 -0.02 -0.29 +0.16 -0.20 +0.05 -0.12 -0.29 -0.02 -0.08 +0.10 -0.09 -0.04
-0.10 -0.34 0.00 -0.09 -0.24 -0. 10
-0.17 -0.27 -0.16 -0.30
-0.20 -0.14 -0.19 -0.25 -0.28 -0. 18
+0.40
Sandage
+0.61
-0.20 -0.13 -0.28
-0.30 -0.30 -0.32 -0.14 -0.20
-0.33 -0.09
-0.07
-0.17 -0.24 -0.09 +0.30
+0.50
Gray
+0.65 -0.11 -0 97 -0.21 -0.24 +0.35 -0.07
-0.35 -0.14 -0.14
+0.16 -0.20 +0.05 -0.14
-0.03 -0.08 +0.10 -0.09 -0.04 -0.16 -0.09
-0.09 -0.06
-0.13
-0.17 -0.22 -0.20 -0.27 0.00 -0.20 -0.14 -0.24 -0.23 -0.29 -0.18 0.00 -0.05
-0.25
Adopted -0.16 +0.63 -0.11 -0.24 -0.18 -0.27 +0.35 -0.08 -0.29 -0.29 -0.33 -0.14 -0.12 -0.29 +0.16 -0.20 +0.05 -0.13 -0.31 -0.05 -0.08 +0.10 -0.09 -0.05 -0.16 -0.10 -0.34 -0.04 -0.11 -0.24 -0.11 +0.30 -0.17 -0.24 -0.18 -0.28 0.00 -0.20 -0.14 -0.22 -0.24 -0.28 -0. 18 0.00 -0.05 +0.45 -0.25
logt Sandage
10.08
7.10 7.95 6.60
6.50 6.50 6.30 7.75 7.10
6.00 8.12
8.20
7.35 6.87 8.12 9.40
9.87
Present 7.50 10.08 7.89 6.90 7.35 6.64 9.48 8.10 6.48 6.48 6.12 7.66 7.82 6.48 9.10 7.20 8.78 7.84 6.30 8.30 8.10 8.95 8.02 8.30 7.50 7.96 6.02 8.35 7.89 6.90 7.89 9.40 7.43 6.90 7.36 6.57 8.53 7.20 7.66 7.04 6.90 6.58 7.36 8.53 8.30 9.72 6.80
Sandage
+0.84:
+0.12 +0.05 -0.10
-0.15 +0.10 -0.27 +0.20 +0.13
-0.27 +0.08
+0.19
+0.10 -0.14 +0.26 +0.65:
+0.74 Arp +0.61 +0.78
-0.18
-0.10
+0.40
+0.66
-0.18
-0.21
(B-V)o
Buscombe
+0.08 +0.02 -0.15:
-0.18 +0.06 -0.31 +0.06 +0.09
-0.31 +0.05
+0.15
+0.07 -0.16 +0.22
+0.69
Gray
+0.92 +0.11 +0.11 +0.01 -0.09 +0.63 +0.06
-0.33 +0.27 +0.13
+0.01 +0.02 +0.35 -0.13
+0.13 -0.21 +0.49 +0.07 +0.17 +0.13 +0.08 -0.16 +0.61 +0.07
+0.27
+0.03 -0.02 +0.13 -0.15 +0.56 +0.16 +0.23 +0.06 -0.12 -0.25 -0.06 +0.47 +0.26
-0.07
Adopted +0.61 +0.85 +0.11 +0.11 +0.03 -0.11 +0.63 +0.06 -0.17 +0.08 -0.30 +0.14:
+0.12 -0.29 +0.01 +0.02 +0.35 -0.12 -0.29 +0.09
-6.21
+0.44 +0.07 +0.17 +0.13 +0.08 -0.16 +0.61 +0.08 -0.15 +0.25 +0.66 +0.03 -0.02 +0.13 -0.16 +0.56 +0.16 +0.23 +0.06 -0.12 -0.23 -0.06 +0.47 +0.26 +0.72 -0.07
NUMBER 16
TABLE 1.—Colors of open clusters—Continued
Cluster
NGC 3532 Coma NGC 4755 NGC 6087 NGC 6231 NGC 6405 NGC 6475 NGC 6494 NGC 6531 NGC 6530 NGC 6633 IC 4725 IC 6709 NGC 6802 NGC 6866 NGC 6871 NGC 6940 NGC 7063 NGC 7092 NGC 7142 IC 5146 NGC 7160 NGC 7209 NGC 7261 NGC 7380 NGC 7789 NGC 7790 CepHI Lac I Orll
Johnson
+0.05 -0.20 -0.17:
-0.18 -0.10 -0.06 -0.30 -0.32 +0.15 -0.20 -0.16 -0.14 +0.06 -0.24 +0. 15 -0.10 -0.06 +0.38
-0.30 0.00 -0.10 -0.30 +0.30 -0.18 -0.25 -0.30 -0.32
(B-V)T
Sandage
-0.12 -0.14
+0.01
+0.10
-0.06
-0.05
-0.30 +0.32 -0.18
Gray
-0.04 +0.05 -0.20 -0.15
-0.12 -0.06 +0.05 -0.33 -0.33 -0.12 -0.20 -0.20 -0.13 +0.06
+0.16 -0.10 -0.12 +0.38 -0.27 -0.30 -0.06 -0.15 -0.33
-0.25 -0.30 -0.32
Adopted
-0.04 +0.05 -0.20 -0. 15 -0.30+
-0.15 -0.08 0.00:
-0.32 -0.32 -0.03:
-0.18 -0.18 -0. 14 +0.04 -0.24 +0.14 -0.10 -0.08 +0.38 -0.27 -0.30 -0.04 -0.12 -0.31 +0.31 -0.18 -0.25 -0.30 -0.32
logt Sandage
7.95 7.75
8.45
9.17
8.30
8.30
6.50 9.48 7.35
Present 8.35 8.78 7.20 7.59 6.45 7.59 8.10 8.53 6.20 6.20
7.35 7.35 7.67 8.72 6.90 9.06 7.96 8.10 9.58 6.64 6.40 8.35 7.80 6.30 9.42 7.35 6.80 6.40 6.20
Sandage Arp
+0.22
+0.15 +0.13
+0.29
+0.35
-0.02
-0.21
+0.33
-0.19
+0.70 +0.62 +0.09
(B-V)o
Buscombe
+0.11 +0.21
+0.26 +0.48 +0.31
-0.03
+0.30
-0.22 +0.65 +0.04
Gray
+0.27 +0.19 -0.01 -0.15
+0.17 +0.15 +0.18 -0.16 -0.12 +0.12 +0.09 +0.21 +0.07 +0.41
+0.39 +0.23 +0.06 +0.60 +0.17 -0.25 +0.30 +0.19 -0.12
-0.36 +0.05 -0.12
Adopted
+0.27 +0.20 -0.01 -0.15 -0.24*
+0.17 +0.15 +0.18 -0.1 -0.12 +0.13 +0.14:
+0.21 +0.07 +0.32:
+0.48 +0.35 +0.23 0.00 +0.60 -0.02:
-0.25 +0.31 +0.19 -0.18 +0.66 +0.06 -0.36 +0.05 -0.12
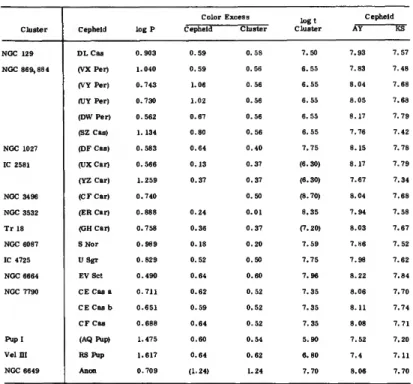
sive columns give the cluster, the Cepheid, the logarithm of its period, the observed color excess of the Cepheid, the observed color excess of the cluster, log t for the cluster (from Table 1), and log t for the Cepheid, calculated from the for- mulas of Young (AY) and of Kippenhahn and Smith ( K S ) . Data for the Cepheid in NGC 6649 are taken from Tammann (1969), those of S Nor from Breger (1970).
As suggested above, a Cepheid that is a cluster member should have a color excess consistent with that of the cluster, and its age should con- form to that of the cluster. The stars whose color excesses and/or ages do not conform to these cri- teria are placed in parentheses. We reject VY Per, UY Per, SZ Cas, D F Cas, U X Car, and ER
Car on the basis of color excess, and VX Per, YZ Car, CF Car, and AQ Pup on the basis of age. The star CV Mon has not been included, be- cause the cluster to which it was once assigned is probably nonexistent. We note that the Cepheids near the double cluster in Perseus, used by San- dage and Tammann (1968) in their calibration of the zero point of the period-luminosity curve, are all excluded on the basis of age, and nearly all on the basis of color excess. As discussed else- where, the zero point determined with their aid is nonetheless unaffected.
The acceptable Cepheids in Table 2 permit us to conclude that the empirical determination of cluster ages, based on Table 1 and the Limber- Sandage time scale, is in satisfactory agreement
SMITHSONIAN CONTRIBUTIONS TO ASTROPHYSICS TABLE 2.—Classical Cepheids near open clusters
Cluster
NGC 129 NGC 869,884
NGC 1027 IC 2581
NGC 3496 NGC 3532 Tr 18 NGC 6087 IC 4725 NGC 6664 NGC 7790
Pup I Vel m NGC 6649
C epheid
DL Cas (VX Per) (VY Per) OJY Per) (DW Per) (SZ Cas) (DF Cas) (UX Car) (YZ Car) (CF Car) (ER Car) (GH Car) SNor U Sgr EV Set CE Cas a CE Cas b CF Cas
<AQ Pup) RS Pup Anon
logP 0.903 1.040 0.743 0.730 0.562 1.134 0.583 0.566 1.259 0.740 0.888 0.758 0.989 0.829 0.490 0.711 0.651 0.688 1.475 1.617 0.709
Color Cepheld
0.59 0.59 1.06 1.02 0.67 0.80 0.6-1 0. 13 0.37
0 . 2 4 0.36 0. 18 0.52 0.64 0.62 0.59 0.64 0.60 0.64 (1-24)
Excess Cluster
0.58 0.56 0.56 0.56 0. 56 0.56 0.40 0.37 0.37 0.50 0.01 0. 37 0.20 0. 50 0.60 0.52 0.52 0.52 0. 54 0.62 1.24
log t Cluster
7.50 6.55 6.55 6.55 6.55 6.55 7.75 (6. 30) (6.30) (8. 70) 8.35 (7.20)
7.59 7.75 7.96 7.35 7. 35 7.35 5.90 6.80 7.70
C
7.93 7.83 8.04 8.05 8.17 7.76 8.15 8.17 7.67 8.04 7.94 8.03 7.86 7.98 8.22 8.06 8. 11 8.08 7.52 7 . 4 H.06
epheid KS"
7.57 7.48 7.68 7.68 7.79 7.42 7.78 7.79 7.34 7.68 7.58 7.67 7.52 7.62 7.84 7.70 7.74 7.71 7.2(1 7.11 7.70
with the time scale derived by Kippenhahn and Smith on the basis of the theory of evolutionary tracks. The time scale given by Young's approxi- mate formula is too long. We shall accordingly use the scale of ages based on Table 1 for the clusters, and equation (2) for the Cepheids.
The relation between period and age for the accepted Cepheids shows considerable scatter, which might be ascribed t o : (1) errors in the Ce- pheid periods; (2) dispersion in the physical properties of the Cepheids; (3) uncertainty in (B —V)T; and (4) dispersion in the properties of the clusters.
1. Errors in the periods of the Cepheids used can hardly affect the data, but the interpretation of the periods may do so. If a star is pulsating in an overtone, the period appropriate for age determination will be longer, and the age accord- ingly smaller, with a difference in log P (for the first overtone) of about —0.2. Possibly EV Set is in overtone pulsation, but in that case the dis- crepancy would be even greater.
2. This possibility covers differences of compo- sition and also mass loss (which might itself be a function of luminosity and thus of mass). We
have no convincing spectroscopic evidence of dif- ferences of composition among classical Ce- pheids, although differences large enough to affect the time scale might not be large enough to affect the spectrum. Mass loss must certainly occur, but the limits calculated by Kippenhahn and Smith would account for only half the observed disper- sion.
3. Kippenhahn and Smith (1969, Table 2) used the luminosities of the stars at the turnoff point to obtain cluster ages, and their material was more heterogeneous than ours. We believe that it is less circuitous to determine log t from (B —V)T than from an absolute bolometric mag- nitude that involves a bolometric correction and magnifies a possible error in color excess by a factor of 3. The uncertainty in (B —V)T is cer- tainly not greater than 0.m10 for the clusters con- sidered. This may still lead to an uncertainty in log t of perhaps 0.5, since we are confined to the region of negative (B — V)T.
4. The clusters, like the Cepheids, may differ significantly in composition and also in other properties, such as the presence of supergiants and numerous red giants. It should be noted that
NUMBER 16
the most discrepant point in the Kippenhahn- Smith plot relates to the Cepheids in the Magel- lanic cluster NGC 1866, for which both the turn- off point and the modulus are uncertain. These variables are not discussed in the present section, but will be considered in our discussion of the Large Magellanic Cloud.
Distribution and Affiliations of Large Cloud Variables
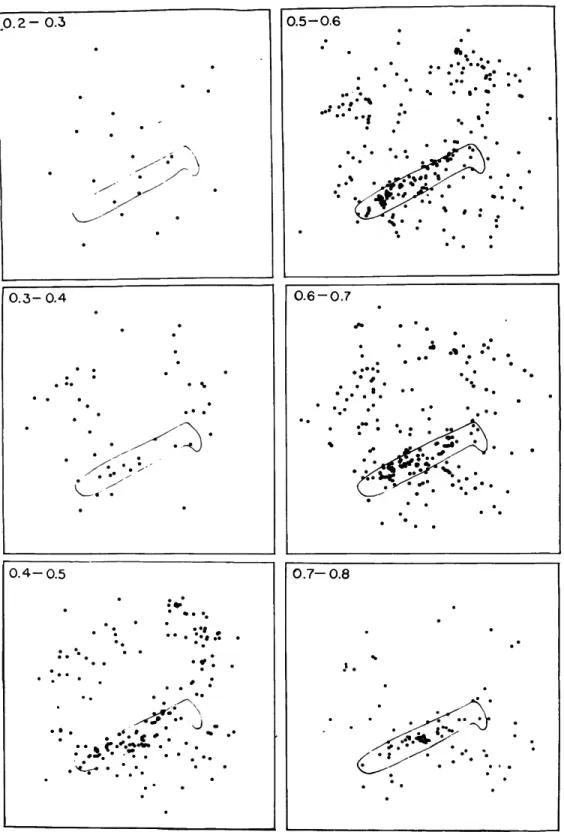
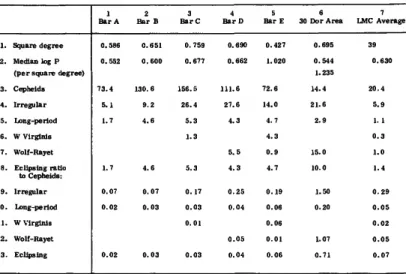
Figures 1-4 illustrate the distribution of several types of variable stars, and of Cepheids of various periods and luminosities, within the boundaries of the Large Cloud. The distributions are neither uniform nor similar. Table 3 summa- rizes conditions in a number of areas, including five sections of the bar, counted from south to north. Column 6 refers to a small region around the Tarantula Nebula 30 Dor. Column 7 gives average values of the tabulated quantities for the whole Cloud.
Successive lines of the table contain: (1) area in square degrees; (2) median log P for the Ce- pheids in the area; (3) through (8) numbers of Cepheids, irregular variables, long-period (in- cluding cyclic) variables, W Virginis stars, Wolf-Rayet stars, and eclipsing stars, all per square degree. Columns (9) through (13) give the ratios of the number of stars of the indicated types to the number of Cepheids in the area.
The periods of the Cepheids in the bar are shortest in Area A and progressively longer to- ward Area E (south to north). The relative numbers of irregular and long-period variables tend to increase over the same interval. The 30 Dor region is exceptionally rich in irregular var- iables and Wolf-Rayet stars, whereas the north- ern end of the bar, rich in irregular variables, is relatively poor in Wolf-Rayet stars.
Several compact blue clusters, notably NGC 1866, 2058, and 2065, seem to be associated with knots of Cepheids, but with few if any variable stars of other types. They will be discussed later.
Table 3 illustrates the variety of the Large Cloud population, ranging from that of the 30 Dor region (poor in Cepheids and rich in Wolf-Rayet stars, irregular variables, and eclips- ing stars) through the bar (absolutely and rela- tively rich in Cepheids, and containing other
types of variable star) to the blue populous clus- ters (where Cepheids predominate). There are also, as we shall see, compact red clusters that contain RR Lyrae stars.
The difference in distribution for Cepheids of different periods and its relation to that of other objects to which ages can be assigned suggest that the variety displayed by Table 3 may fur- nish a way of studying the timetable of star for- mation in various parts of the Cloud. Arp (1964:
227) has already remarked: "It would be impor- tant to pinpoint areas of present star formation and try to discover differences between them and the neighboring areas where star formation has just ceased. . . . By studying color-magnitude diagrams of various regions of the Cloud . . . much can be learned about the age composition of the stars in various regions within the Cloud.
In combination with the velocity data a begin- ning could be made on the problem of how the locus of star formation has moved within the system as a function of time." We explore these possibilities by collecting data on variable stars that appear to be associated with datable compo- nents of the Cloud.
The basis of our study is the time scale for clusters (Table 1), which enables us to relate (B —V)T and (B —V)o to age. We also make use of equation (2), which expresses the age of a Ce- pheid as a function of period and which has been shown to be compatible with the Limber-San- dage time scale that has been used for the clus- ters. We must be mindful of the possibility that the physical properties of both Cepheids and clusters may not be the same in the Cloud and the Galaxy, but while this possible difference might invalidate an absolute time scale, it seems legitimate to expect that the times deduced for the Cloud will be consistent for clusters and Ce- pheids.
Datable components are summarized in the fol- lowing tables beginning with the youngest. Ac- tually, the smallest ages that have been assigned in the Cloud are those attributed by Westerlund and Mathewson (1966) to three possible super- nova remnants, 300 years for 132 D and 3000 years for N 49 and N 63. Neither variable stars nor clusters can be associated with anything so recent. These authors also suggest that Constella- tion I I I , and perhaps Constellation I, discussed
0 . 2 - 0.3 0.5-0.6
••"••I
0.3-0.4 0.6-0.7
. " . • •
0.4-0.5
J
0.7-0.8
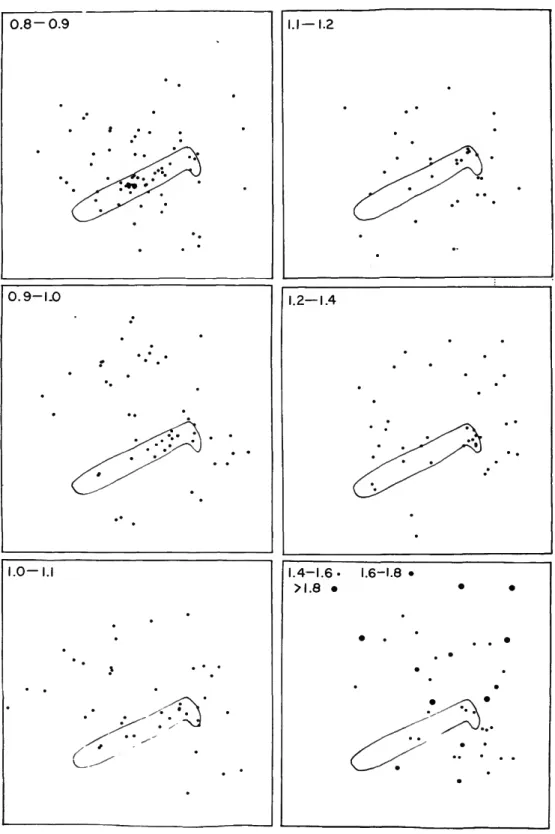
FIGURE 1.—Large Cloud: Distribution of Cepheids with various values of log P. The outline of the bar is indicated.
NUMBER 16
0.8-0.9 I.I— 1.2
0.9-1.0
1.0—I.I
1.2—1.4
.4-1.6 • 1.6-1.8 •
• •
FIGURE 2.—Large Cloud: Distribution of Cepheids with various values of log P.
534-240 O - 74 - 2
SMITHSONIAN CONTRIBUTIONS TO ASTROPHYSICS
Jl 3 • 13-14 15.5-15.99
14.0-14.49- 14.5-14.99* 16.0-16.49
• • * * •* *
15.0 - 15.49
FIGUBE 3.—Large Cloud: Distribution of Cepheids with various apparent photographic magnitudes, averaged to mean intensity and uncorrected for absorption.
L P V
. o
WOLF RAYET AND Be
oc
. " o
W STARS NOVAE o RR
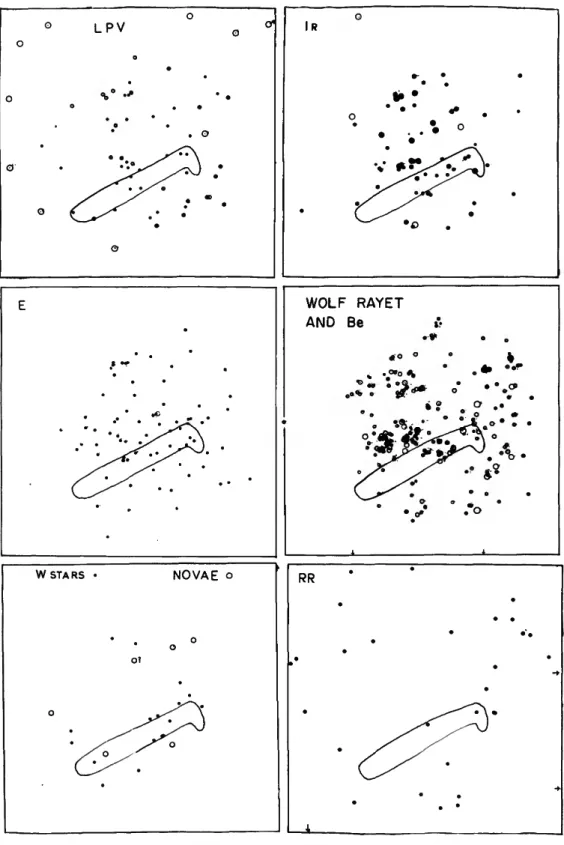
FIGURE 4.—Large Cloud: Distribution of long-period variables (LPV), irregular red vari- ables (Ir). eclipsing variables (E), Wolf-Rayet stars (WR, dots) and Be stars (Be, circles), W Virginis stars (W, dots) and novae (circles), and RR Lyrae stars (RR).
Foreground stars among the long-period and irregular variables are indicated by circles;
all the RR Lyrae stars are foreground.
10 SMITHSONIAN CONTRIBUTIONS TO ASTROPHYSICS
by Shapley and Nail (1953), may "have had their origin in "super-supernova" explosions about 106
yr ago. These constellations are associated with the clusters NGC 1968-1974 and NGC 1962-1965-1966-1970 (see Table 4).
Data for very young clusters and associations
are collected in Table 4. Successive columns give:
(1) name of the group; (2) values of (B —V)o
published by van den Bergh and Hagen (1968) or derived from the data of Bok and Bok (1962), the latter denoted by asterisks; (3) to (6) logarithms of ages, deduced, respectively,
1.
2.
3.
4.
5.
6.
7 . 8.
9.
10.
11.
12.
13.
Square degree Median log P (per square deg Cepheids Irregular Long-period W Virginis Wolf-Rayet Eclipsing ratio
to Cepheids:
Irregular Long-period W Virginis Wolf-Rayet Eclipsing
TABLE 3.—Typical
ree) 1 Bar A
0.586 0.552 73.4
5.1 1.7
1.7 0.07 0.02
0.02 2 Bar B 1
0.651 0.600
areas
3arC3
0.759 0.677 130.6 156.5
9.2 4 . 6
4 . 6 0.07 0.03
0.03 26.4
5.3 1.3
5.3 0.17 0.03 0.01
0.03
in the Large
4 Bar D
0.690 0.662
111.6 27.6 4 . 3
5.5 4 . 3
0.25 0.04
0.05 0.04
5 Bar E
0.427 1.020
72.6 14.0 4.7 4 . 3 0.9 4.7
0. 19 0.06 0.06 0.01 0.06
Cloud
6 30 Dor Area
0.695 0.544 1.235 14.4 21.6 2.9
15. 0 10.0
1.50 0.20
1.07 0.71
7 LMC Average
39 0.630
20.4 5.9 1. 1 0 . 3 1.0 1.4
0.29 0.05 0.02 0.05 0.07
TABLE 4.—Very young clusters and associations
NGC
1810 1818 1929-1937 1955 1968-1974 1962-1970 1983 1984 2004 2070 2074 2081
2092 2100 Westerlund Area "b"
(B-V)o
-0.07 -0.29*
-0.21*
-0.27*
- 0 . 2 0 ' -0.12*
-0. 19 -0.22
-0. 12
Logarithm From C-M Array Maximum Turnoff
6.30 6.56 6.50 6.34
6.36 6.68 6.56 6.78
7.00 6.45 6.84
of Age (yr)
£S>
06.93 6.12 6.40 6.18 6.44 6.74
6.47 6.36
6.74
W Stars
6.57
6.43,6.68
6.39,6.67 6.69 6.77
Adopted
6.93 6.93 6.12 6.48 6. 18 6.53 6.72 6.60 6.47 6.37,6.67
6.67 6.78
7.26 6.78 6.0-7.0
Members:
Red Supergiants
2 3 0 0 2 0 0 2 6 1 0 2
2 18 45
W Stars
0 0 0 1 0 2 0 0 0 10 2 2
0 0 0
HV
5495 2556
1017 2753 5993 6002
957 2565 2567 5870
Variable Stars Type
Irregular Irregular
Irregular Irregular Irregular Irregular
Irregular Irregular Irregular LP
Magnitude
10.95-11.87 14.84-16.35
15.30-15.95 15.30-16.70 15.30-16.25 16.18-17.65
13.87-14.84 13.43-14.43 14.44-15.15 14.30-17.09
Color
Blue Red
Red Red Red Red
Red Red Red Red
Reference Color-Magnitude Array
Woolley (1960) Woolley (1960) Bok (1964)
Bok, Bok, and Basinski (1962) Bok, Bok, and Basinski (1962) Westerlund (1961a) Westerlund (1961a) Westerlund (1961a) Woolley (1960) Westerlund (1961a) Westerlund (1961a) Westerlund (1961a)
Westerlund (1961a) Westerlund (1961a) Westerlund (1961a)
NUMBER 16 11
from the maximum and turnoff of the color-mag- nitude diagram by Westerlund (1961a), from (B — V)o, and from the apparent magnitudes of the Wolf-Rayet stars; (7) logarithm of an adopted age; (8) number of red supergiants; (9) number of Wolf-Rayet stars; (10-13) name, type, and magnitude color of variable stars; and (14) reference to the source of the color-magnitude array. The ages derived from (B —V)o were de- duced graphically from Table 1. Those in the sixth column are deduced with the help of the observation of Westerlund and Smith (1964) that the brightness of a Wolf-Rayet star seems to be related to its age, the youngest being the brightest. Westerlund (1961a: 44) states: "It ap- pears likely that the turnoff point gives a good estimate of the age of a stellar group. . . . All stars of type Wolf-Rayet found so far are situ- ated at the turnoff point." All the Wolf-Rayet stars in the clusters tabulated have composite (W + O) spectra. The average (vo) magnitudes of those in NGC 1962-1965-1966-1970, 2074, and 2081 are found from the work of Smith (1968) to be 11.14:, 12.48, and 13.31, respectively. These, with the ages of the relevant clusters, lead to the relationship
log t = 0.10 Vo + 5.44.
The similarity of the color-magnitude arrays for NGC 1810 and 1818 suggests similar ages, and we have assumed them to be equal. Bok (1964) assigns to NGC 1929-1937 an upper limit of 6.3 for log t. We defer discussion of the complex re- gion surrounding NGC 2070.
The striking feature of Table 4 is the absence of Cepheids, though it contains 10 irregular vari- ables. In the Large Cloud as a whole, the number of known irregular variables is 3% of the num- ber of known Cepheids. The upper limit of age for the clusters in Table 4 is about 107 yr, and we infer that their members have not had time to reach the Cepheid stage.
The red irregular variables (when present) are brightest in the youngest clusters. The red super- giants (some of which are probably undetected variables) show the same tendency. Their aver- age B magnitudes in NGC 1984, 2081, and 2092 are, respectively, 14.71, 15.32, and 15.72; the cor- responding adopted values of log t are 6.60, 6.79, and 7.26. The older the cluster is, the fainter are
the evolved stars. An order-of-magnitude esti- mate of their luminosities, based on a true modu- lus 18.45, a color excess 0.m06, and a color index l.m6, gives -5.6, -5.0, and - 4 . 6 for Mv of the red supergiants in the three clusters.
No red semiregular variables are known in the youngest clusters and associations. The bright ir- regular variable in NGC 1983 is a blue star, HV 5495 = HD 269582 (P Cyg spectrum). In NGC 2081, there are both Wolf-Rayet stars and red ir- regular variables, with B magnitudes 13.09 and 15.30 (max.), respectively, but since the W stars are composite, the actual W component may not be much brighter than the red variable. Wester- lund's area "b" is a large association whose red supergiants have a spread of 3 magnitudes. This suggests that it contains stars with a variety of ages, as already noted by Westerlund. One long- period variable lies within its probable bounda- ries. The ages suggested by the brightness of the red variables and supergiants range from about 106 to over 107 yr. These facts are in harmony with the conclusion of Stothers (1969: 935) that clusters containing supergiants show "decreasing and increasing number of blue and red super- giants, respectively, with age."
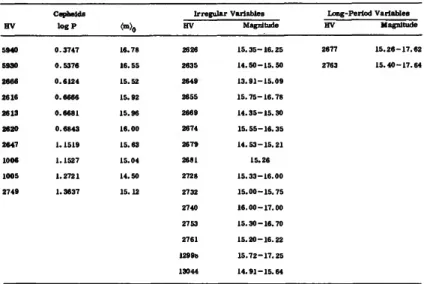
Data for the region surrounding 30 Dor (NGC 2070) are given in Table 5. The corresponding entry in Table 3 relates to Westerlund's sam- pling of stars in a smaller area. Table 5 embraces an area of 0.695 square degree, which contains 15 irregular variables, 10 Cepheids, and 2 long-pe- riod variables. Evidently, the region is less ho- mogeneous in population and age than those just discussed. The Cepheids favor two periods; the irregular and long-period variables have average maximal photographic magnitudes 15.11 and 15.36 (corresponding roughly to Mv —5.1 and
— 4.9). We conclude that the irregular variables point to a value of about 6.5 for log t, but the presence of Cepheids suggests a value of at least 7.0.
The small region within 30 Dor itself (Table 6) suggests a smaller age. Data for the W stars are from Smith (1968); those for the O to F su- pergiants, from Feast, Thackeray, and Wesselink (1960); those for the red supergiant, from Wes- terlund (1961a). In obtaining a value of vo for R 134, 135, 139, and 140, we have adopted the absorption used by Smith for HD 38268.
12 SMITHSONIAN CONTRIBUTIONS TO ASTROPHYSICS
Unlike the clusters previously noted, the group within 30 Dor contains W stars with a large range in magnitude, from 8.48 to 12.51. Both the brightest (HD 38268) and the faintest (HD 269926) have composite spectra. Even if (as is quite possible) HD 38268 is as multiple as the
Trapezium in Orion, there must still be a range of at least 2 magnitudes among the W stars, and HD 38268 would be as bright (and hence as young) as any W star in the Large Cloud. The W stars suggest values of log t from under 6.4 to 6.7, the irregular variables about 6.7, and the Ce-
TABLE 5.— Variable ntars in the 30 Dor area (0.695 square, degree)
HV 5940 5930 2666 2616 2613 2620 2647 1006 1005 2749
Cephelds l o g P 0. 3747 0.5376 0. 6124 0.6666 0.6681 0.6843 1.1519 1.1527 1.2721 1.3637
<»>o
16.78 16.55 15.52 15.92 15.96 16.00 15.63 15.04 14.50 15.12
Irregular Variables HV
2626 2635 2649 2655 2669 2674 2679 2681 2728 2732 2740 2753 2761 12990 13044
Magnitude 15.35-16.25 14.50-15.50 13.91-15.09 15.75-16.78 14.35-15.30 15.55-16.35 14.53-15.21
15.26 15.33-16.00 15.00-15.75 16.00-17.00 15.30-16.70 15.20-16.22 15.72-17.25 14.91-15.64
Long-Period Variables HV
2677 2763
Magnitude
15.26-17.62 15.40-17.64
TABLE 6.—Young stars in the SO Dor region
Star
HD 269891 HO 269926 HO 38282 HD 269928 HD 38344 R 134 R 135 HD 38268 R 139 R 140 R 131 R 132 R 133 R 137 R 138 R 141 R 142 R 143 Westerlund 8
Spectrum OB +WN WN4 + OB WN7 WN 7 WN 6:+OB (WN 7) (WN7) OB + WN WN7:* OB:
WN 6 B9 I B-A O8 B0.5 Ia:
AO: I:
B0. 5:
B F 5 - F 8 la
v0 10.55 12.51 10.79 11.24 12.10 (11.40) (12.19) 8.48 (10.91) (10.86)
13.47
<b-v)0 -0.21 -0.18 -0.20 -0.20 -0.17
-0.21
(+1.94)
Radial Velocity (km/sec)
+269
+235
+263
NUMBER 16 13
pheids at least 7.0. Westerlund 8, in the compact region, has an apparent B magnitude of 15.41 (unconnected for absorption) and thus falls in the same age group as do the irregular variables.
The compact group contains no known Cepheids, although R 143 may possibly be one, with an un- corrected B magnitude of 11.36.
These facts suggest a complex history of the 30 Dor region. Stars have been forming in the surrounding area for at least 107 yr, but in the compact center there is nothing with log t greater than 6.7, and some of the stars must be even younger. The association around NGC
1962-1965-1966-1970 seems to be similar to the 30 Dor cluster, and so is the association near NGC 1955, described by Bok, Bok, and Basinski (1962) as consisting primarily of blue-white su- pergiants and containing HD 36402, WC5 + OB, vo= 11.38, which corresponds to log t = 6.58.
Neither of these associations contains any known variable stars.
The young populous ("blue globular") clusters that contain variable stars are given in Table 7.
Successive columns give the name of the cluster, (B — V )o from van den Bergh and Hagen (1968), ages estimated as described above from the color TABLE 7.—Variable stars in and near young populous clusters
NGC
1850
1854 1856
1866
2058
2065
2136 2156 SL204
(B-V)o
0.07:
0. 13 0.26
0.20
0. 17
0. 17
0. 14 (0.05)
lO(
(B-V)o 7.45
7.70 8.18
7.95
7.85
7.85
7.72 7.47
ft (yr) Cepheld
7.20 7.46
7.66 7.85 7.92 7.81 7.83 7.84 7.84 7.80 7.89 7.88 7.81 7.84 7.85 7.81 7.8.1 7.90 7.74 7.81 7.69 7.84 7.76 7.83 7.69
7 . 8 4
7.82 7.83 7.59 7.49 7.72
HV
9 0 4 9 0 5
2349 11985 12192 12193 12194 121%
12197
12199 12200 12201 12202 12203 12204 12205 1220(5 2706 2713 2714 2717 2720 5975 5976 13042 1008 1009 2868 12078 W 49
Variable Stars Cepheids -
logP 1.483 1.073
? 0.763 0.483 0.366 0.540 0.506 0.493 0.498
0.422 0.435 0.537 0.492 0.470 0.536 0.506 0.399 0.646 0.538 0.728 0.499 0.615 0.502 0.729 0.487 0.534 0.513 0.883 1.029 0.677
Irregular
m0 HV
13.57 14.2a
5626 17.24-18.18 15.70 11988 17.93-<18 17.00 11989 17.59-18.22 15.99
16.54 lfi.40 16.36 16.69
16.89 16.71 16.35 16.80 16.93 15.89 K.. 10 16. 5M 15.49 16.43 15.61 16.53 15.29 16.47 16.01 15.34 15.31 15. U 15.29 15.22 16.03
SMITHSONIAN CONTRIBUTIONS TO ASTROPHYSICS
of the cluster and the periods of the Cepheids, and data on the associated variable stars. A query indicates that the variable is far from the cluster and may not be a member. For NGC 1866, we include only stars within 10' of the cluster center. All these stars are in the list of Shapley and Xail (1951) ; we have determined a period for HV 12192. Several of these stars have also been studied by Arp and Thackeray (1967).
The integrated spectral class for NGC 2156 is from the Henry Draper Extension. No inte- grated color has been published for this cluster, and we have adopted a mean of the published colors for three clusters also classed as A3 in the Henry Draper Extension (NGC 1774, 0.00; XGC 2134,0.10; NGC 2136, 0.05). The star W49 was discovered by Woolley and Epps (1963) in Clus- ter No. 204 of the list published by Shapley and Lindsay (1963).
The clusters have a moderate range of ages, log t ranging from 7.45 to 8.08. The ages de- duced from the periods of the Cepheids are in general agreement with those deduced from the colors of the clusters, except for NGC 1856, for
which we note that the Cepheid membership is doubtful on account of distance.
The known variables associated with "red globular clusters" are collected in Table 8. Val- ues of (B —V) are from van den Bergh and Hagen (1968) ; the clusters for which no color is given were taken from the list of Hodge (1959).
Most of the variables in the list were discussed by Hodge and Wright (1963) in connection with the clusters; they regarded those marked with asterisks as probable members. Data for three known globular clusters that contain RR Lyrae stars (NGC 1466, 1978, and 2257) are not in- cluded.
The data of Table 8 are not readily understood in terms of previous tables. Most of the stars are Cepheids, and except for the one near NGC 1953, they fall near the period-luminosity curve for normal Cepheids in the Clouds. Hodge and Wright discussed the possibility that these stars are Population I I Cepheids, in recognition of their proximity to red globular clusters.
It is now known from the work of Gaposhkin (1972) and Payne-Gaposchkin (1971) that the
TABLE 8.—Variable stars in red globular clusters
NGC
1751
1783*
1786 1846 1953
1978 2019 2121
SL 363 SI. 569
US 83
B-V
0.63 (0.67)
0.74
0.78 0.77
HV
12904 12910?
880 2315?
12905*
12911?
5910 12908*
12909*
12656?
2439*
12906 12907 13015 13016
Cepheids l o g P
0.290 0.504
1.067 0.382 0.820 0.262 1.322:
0.402 0.756 (0. 344)
1. 127 0.682 0.242 (-0. 002)
-0. 178 -0.236
mo
16.00 16.33
14.72 15.93 16.29 16.49 (15.8) 16.32 15.20 (16.81) 14.80 16.19 17.14 (17.5) 16.56 16.64:
Irregular HV m
5 unnamed
12973: 17.95-
13017 15.75-16.33
NGC 1783: Three variables (two red, one blue) are recorded by Gascoigne (1962) and two more (both red) have been noted In Harvard plates. The mean blue magnitude for Gascolgne's red variables is 17. 54. He suggests that the blue variable may be an eclipsing star.
NGC 1973: The data are from Hodge (1960a). Four variables, two probably of RR Lyrae type, are mentioned by Thackeray (1959).