DOMINANT FACTORS AS THE STRENGTHS OF SMALL AND MEDIUM ENTERPRISES OF NATURAL STONE ART AND WOODEN ROOT ART FURNITURE
TO SURVIVE IN THE MARKET COMPETITION (CASE IN BOGOR AND SUKABUMI)
THESIS By
Agus Mulyana Junjungan 011200800005
Presented to
The Faculty of Economics, President University In partial fulfillment of the requirements
for
Bachelor Degree in Economics, Major in Management
President University Cikarang Baru – Bekasi
Indonesia
2012
i
THESIS ADVISER
RECOMMENDATION LETTER
This thesis entitled “DOMINANT FACTORS AS THE STRENGTHS OF SMALL AND MEDIUM SIZED ENTERPRISES OF NATURAL STONE ART AND WOODEN ROOT ART FURNITURE TO SURVIVE IN THE MARKET COMPETITION (CASE IN BOGOR AND SUKABUMI)”
prepared and submitted by AGUS MULYANA JUNJUNGAN in partial fulfillment of requirements for Bachelor Degree of Science in Economics – Major in Management, has been reviewed and found to have satisfied the requirements for a thesis fit to be examined. I therefore recommend this thesis for Oral Defense.
Cikarang, Indonesia, January 27
th, 2011
Acknowledged by, Recommended by,
Irfan Habsjah,MBA.CMA Ir. B.M.A.S. Anaconda Bangkara, MT., MSM Head of Management Study Program Thesis Advisor
ii
DECLARATION OF ORIGINALITY
I declared that this thesis, entitled “DOMINANT FACTORS AS THE STRENGTHS OF SMALL AND MEDIUM ENTERPRISES OF NATURAL STONE ART AND WOODEN ROOT ART FURNITURE TO SURVIVE IN THE MARKET COMPETITION (CASE IN BOGOR AND SUKABUMI)” is, to the best of my life and belief, an original piece of work that has not been submitted, either in whole or in part, to another university to obtain a degree.
Cikarang, Indonesia, 30
thJanuary 2011
Agus Mulyana Junjungan
iii
PANEL OF EXAMINERS APPROVAL SHEET
Herewith, the Panel of Examiners declare that the thesis entitled ” Dominant Factors As the Strengths of Small and Medium Enterprises of Natural Stone Art and Wooden Root Art Furniture to Survive In the Market Competition (Case In Bogor and Sukabumi)” submitted by Agus Mulyana Junjungan majoring in Management International Business, Faculty of Economics was assessed and proved to have passed the Oral Examinations on February 23
rd, 2012.
( Purwanto, S.T., MM ) Chair – Panel of Examiners
( Iman Heru Wijayanto, MBA ) Examiner 1
( Ir. B.M.A.S. Anaconda Bangkara, MT., MSM )
Examiner 2
iv
ABSTRACT
The main objective of this study is to identify the dominant factors as the strengths of SMEs of Natural Stone Art and Wooden Root Art furniture to survive in the market competition.
The study was carried out in 2 cities, districts of Bogor and Sukabumi. The study was conducted since there is decreasing number of artisans of this commodity in these 2 cities because of some internal and external constraints. However, this study would not further analyze the constraints. The main object of the study is analyzing the elements that contribute their survivals in the middle of challenges in the market competition. This study is also only focus on their strategies and internal strengths without treat to any calculations related to total income or profit, number of sales, number of buyer, etc.
This study is using Factor Analysis method to identify the dominant factors. The basic theories being used are Porter’s Generic Strategies and 5 P’s Strategic Management Model.
The respondents consist of 50 respondents from Bogor and Sukabumi. Based on the result, there are 2 factor formed as the dominant factors of the survival SMEs. The first dominant factor related to the capability of SMEs to do export transaction and their focus market in export-oriented business. The second dominant factor related to the passion and strong commitment of the firm / artisans in these natural art craft business.
v
ACKNOWLEDGEMENT
Alhamdulillahi robbil’ alamin.. All prais be to Allah SWT, The God of the Universe
Prayers and greetings are always devoted to the most perfect human being, The prophet Rasulullah Muhammad saw
Finally, I finished my thesis. Thankful to my beloved family, especially Mama, Papa, and Teteh.
Mr. Anaconda (Sir Ienjo), thank you for your time, cares, guidance, and also support so I can finish this thesis completely.
All my friends in Cikarang and Bogor, thanks a lot for your support and everything.
Cikarang, 30 January 2011
Agus Mulyana Junjungan
vi
TABLE OF CONTENTS
Page
THESIS ADVISER RECOMMENDATION LETTER ...i
DECLARATION OF ORIGINALITY ... ii
PANEL OF EXAMINERS APPROVAL SHEET ... iii
ABSTRACT ... iv
ACKNOWLEDGEMENT ... v
TABLE OF CONTENT ... vi
LIST OF TABLES ... viii
LIST OF FIGURES ... ix
I. INTRODUCTION ... 1 – 8 1.1. Background of the Study ... 1
1.2. Problem Identification ... 4
1.3. Statement of the Problem ... 5
1.4. Research Objectives ... 5
1.5. Significance of the Study ... 6
1.6. Theoretical Framework ... 7
1.7. Scope and Limitations of the Study ... 8
1.8. Definition of Terms... 9
II. LITERATURE REVIEW ... 10 – 18 2.1. Small and Medium Sized Enterprises ... 10 – 12 2.1.1. Definition of SMEs... 10
2.1.2. Characteristics of SMEs ... 10
2.1.3. The Potential Economic and Social Benefits of the SMEs ... 12
2.3. Porter’s Generic Strategies ... 13
2.4. 5 P’s Strategic Management Model ... 16 III. METHODOLOGY ... 19 – 34
vii 3.1. Research Method ... 19 – 21
3.1.1. Research Design ... 19
3.1.2. Source of Data ... 20
3.1.3. Analysis Tools ... 20
3.1.4. Research Time and Place ... 21
3.2. Research Framework ... 22
3.3. Research Instruments ... 23 – 28 3.3.1. Pretesting ... 23
3.3.2. Scaling Measurement ... 24
3.3.3. Validity ... 25
3.3.4. Reliability ... 27
3.4. Data Processing ... 28 – 32 3.4.1. Factor Analysis ... 28
3.5. Sampling Design ... 32
3.6. Limitations ... 34
IV. ANALYSIS OF DATA AND INTERPRETATION OF RESULTS ... 35 – 39 4.1. Data Collection ... 35 – 37 4.1.1. Research Variable ... 35
4.1.2. Validity Testing ... 36
4.1.3. Reliability Testing ... 37
4.2. Data Interpretation ... 37 – 39 4.2.1. Factor 1 ... 37
4.2.2. Factor 2 ... 38
4.2.3. Factor 3 ... 39
V. CONCLUSIONS AND RECOMMENDATIONS ... 40 – 42 5.1. Conclusions ... 40
5.2. Recommendations ... 41
REFERENCES ... 43 APENDICES
viii
LIST OF TABLES
Page
Table 3.1. Result of Validity Testing ... 26
Table 3.2. Reliability Statistics ... 28
Table 3.3. KMO and Bartlett’s Test ... 29
Table 3.4. Communalities ... 31
Table 3.5. Total Variance Explained ... 31
Table 3.6. Rotated Component Matrix... 32
Table 4.1. Respondent Dissemination... 35
ix
LIST OF FIGURES
Page
Figure 1.1. Theoretical Framework ... 7
Figure 2.1. Porter’s Generic Strategies ... 15
Figure 2.2. 5 P’s Strategic Management Model ... 18
Figure 3.1. Research Framework ... 22
Figure 3.2. Likert Scale ... 23
Figure 3.3. Correlation Coefficient Formula ... 25
Figure 3.4. Cronbach Alpha Formula ... 27
Figure 3.5. Slovin Formula... 33
1
CHAPTER I INTRODUCTION
1.1. Background of the Study
Indonesia is known as a country with abundant natural resources.
Topographically, Many rivers and forests landscaped from west to east of Indonesia. Along the area, there are many potential endowment resources have been deployed and can be explored and processed to gain the benefits by creating value added commodities. As a vast archipelago country and supported by complete natural endowment, Indonesia potentially can develop its’ resources to be utilized as industrial raw materials, such as mining, logging, fishery, agriculture, etc. Conceivably, Indonesia is one of the richest countries in the world with the availability of natural resources.
Natural resources are one of the important elements in the development of a country. The country with richly endowed of natural resources have an advantage over the country that are not (Sultan, 2007). Thus, Indonesia actually has that advantage if its natural resources utilized effectively and efficiently for the wealth and prosperity of the citizens. However, many industries have been exploiting it in considerable amount till destroyed the balance of nature. Nevertheless, some industries such as small and medium enterprises use it to create a highly artistic value product with innovation and creativity from the skilled hand of the artisans where the art that is created by the nature itself.
From a worldwide perspective, it has been recognized that small and medium sized enterprises ( SMEs) play a vital role in economic development, as they have been the primary source of job / employment creation and output growth, not only in less developed countries, but also in developing and developed countries (Tambunan, 2006). The essential role of SMEs
2 Small and medium business that is particularly prioritized in export-oriented business can contribute the income for the country from international trade for each international transaction agreed in the local market. Historically, Indonesian SMEs have always been the main players in domestic economic activities, accounting for more than 90 per cent of all firms across sectors and providing employment for more than 90 per cent of the country’s work force (Tambunan, 2011).
The majority of SMEs are operating in a networked business environment, in which will extend beyond national and cultural boundaries, particularly those who involved in international trade activities (Nummela, 2010). Besides, the export- oriented small and medium firms also will attract the tourism sector because SMEs sector is dominated by the handicraft sectors which closely related with the culture nuance. Therefore, SMEs development could be emerged as a key instrument in poverty reduction efforts1 (www.oecd.org).
In Indonesia, the development of small and medium enterprises is mostly corresponded with the nature and characteristic of the society. Specifically for small and medium business, the handicraft industry is the example of SMEs that emerged because of the diversity of culture and characteristic of Indonesian people. Every region in Indonesia has their own characteristics which represent their own identity and could be reflected authentically through any commodity, such as creation of handicraft. Viewing from the foreigners’ perspective, Goodfellow (1997, pp.97) stated that the geographic and cultural situation of Indonesia makes it very difficult to generalize about what exactly is ―Indonesian Business Culture‖.
Handicraft are mostly defined as ―items made by hand―, often with the use of simple tools, and are generally artistic and / or traditional in nature (Redzuan and
1 OECD (Organization for economic co-operation and development) Conference in Istanbul, Turkey on 2004 about Promoting Entrepreneurship and Innovative SMEs in a Global Economy
3 Aref, 2010).2 Natural art craft is one of the attractiveness aspects of Indonesia handicraft industry. Many handicraft industries have been emerged through the commodity for export-oriented. One of the examples is natural stone art and wooden root furniture. There are two types of market share for these products: the local and national market; the tourist market and the export market. Over the ninety percent of the market share of these products were export-oriented, which covered by tourist and export market.
Market destination of these natural art craft products are dominated in Asian countries, such as South Korea, Japan, Malaysia, Singapore, and some Middle East countries. Besides, some countries outside Asia such as Netherland, UK and US also begin to be attracted with these commodities. Along the time, in Java, there has been constructed the central city for the marketplace of natural stone art and wooden root art furniture.
There are some types of products that are provided by the artisans in their gallery or work shop, such as petrified wood, suiseki or spirit rock stone, agate stone and some model of wooden root furniture. Mostly, buyer or collector of both natural stone art and wooden root furniture are the same or have similar segmentation.
Therefore, mostly artisans are providing both of these products in their gallery, so that the buyer can choose among those products.
Viewing in the context of cultural aspect, indirectly, this business has been mingling the East Asian culture to Indonesia since the art entered to Indonesia.
The artisans and the buyer dominated by foreigners should interlace the relationship to create a good business climate. Marketing strategic will be emphasizing to encourage its relationship. Language, culture, habits, and business ethics should be paid attention by the artisans to create customer satisfaction and loyalty. For instance, the Japanese customers are very conscious of the image and reputation which influence the purchasing habits. Therefore, the artisans should
2 This statement was taken from a journal of Yojana B, Sansad M (2006). Status Study of Tribal Handicraft- An Option for Livelihood of Tribal Community in the States of Arunachal Pradesh Rajasthan, Uttaranchal and Chhattisgarh.
4 make a good reputation since the first impression in the transaction in order to build their satisfactions (Leong, Ang, & Tan, 1996).
In term of economic aspect, these natural art craft are very profitable. Taken an example, for the wooden root, the producers generally purchase raw materials from the surrounding communities with a low price. After it is being processed till yielding a new value-added product, such as furniture, it can be sold at relatively high price and only affordable for the upper class in this country.
The average price range from $500 up to $20,000, indeed, is potentially reaching higher price depends on the art value of the product. Conceivably, the profit margin that can be scooped by the stakeholder, especially by the local artisans is quite high for each product sold which means this business will be profitable and need to be managed comprehensively.
1.2. Problem Identification
This globalization era has been creating a tight competition in the local market.
Although this condition can usher new opportunities for the native stakeholder, but the real condition told other facts. Majority of the artisans or firms in this sector has been less able or even unable to exploit the benefits of globalization and, to add the situation, is frequently under pressure on the local or domestic market from foreign competition. Whereas in fact, there are many foreigners came to Indonesia and established an illegal small business in this sector in order to cut the flow between supplier of raw material and producer, so that they can decrease the cost and increase the profit.
Beside, this business, due to their size, is particularly constrained by non- competitive real exchange rates, limited access to finance (non bankable), cumbersome the bureaucratic procedure in setting up administration, operation and growth of the business, poor infrastructure and lack of effective and professional management system. Finally, from year to year, the number of artisans of natural art craft is decreasing because they could not survive with this
5 hard situation with many constrains that hampering, from internal and external constrains. This impact also will be creeping to other sector in that surrounding area, from poverty until decreasing to the income for local and central government.
1.3. Statement of the Problem
This research is conducted to assist the problem arises from the real condition and climate of the natural stone art and wooden root artisans. Based on data, it shown that during the year 2003 to year 2011 that a number of SMEs of natural stone art and wooden root art furniture are decreasing. However, the data also shown that a number of SMEs still survive and keep sustain to running their business (complete data and graphs about the amount of SMEs in natural art craft sector in Bogor and Sukabumi is attached in Appendix).
From the description above, this research would like to identify the dominant factors that enduring the survival of the SMEs in natural stone art and wooden root art furniture sectors business in the market competition.
1.4. Research Objectives
The main objective of the research is to identify the dominant factors as the strength point of the SMEs in natural stone art and wooden root furniture sectors located in Bogor and Sukabumi cities in which could made them keep survive among the constraints and challenges in the tight competition in the market. This research also will determine the factors that need to be improved in order to enhance the level of competitiveness of these SMEs. These factors are determined from Porter’s Generic Strategies (1979-80) and 5 P’s Strategic Management Model by Pryor, Toombs, Anderson and White (1998).
6
1.5. Significance of the Study
In light of the analysis, this study would serve as a valuable reference for any parties, who involved in this research, such as for artisans, other SMEs business, President University students, local government and researcher.
As the outcome, this research will help some of the stated issues below:
I. For the researcher
The researcher expect that this study will help the researcher to have a better and deeper understanding about this SMEs business, especially in Natural art craft sector that focusing on export-oriented product. The researcher also could find any strength and opportunities that can maximize the performance of the firms involved and at the same time also can find the solution to solve any constrains in this business.
II. For the artisans or SMEs
This research would serve as a reference for the artisans in order to implementing any factors that is dominating in development of Small and Medium Sized Enterprises with export-oriented, especially in Natural Stone Art and Wooden Root furniture. This research also did in a general way by pay attention to various aspects that come into contact both externally and internally that is expected to be effective in its application to other SMEs industries.
III. For the academic community
This research will give new information for academic community to give more attention to the SMEs in order to analyze and doing more research and detailed examination about SMEs that have potential to be the export- oriented business.
7 IV. For the local government
This research hopefully can improve the competitiveness for handicraft business with export-oriented in order to giving the real contribution to foster the income from handicraft sector to the local government in Bogor and Sukabumi. Besides, it also will contribute to the poverty reduction in those areas.
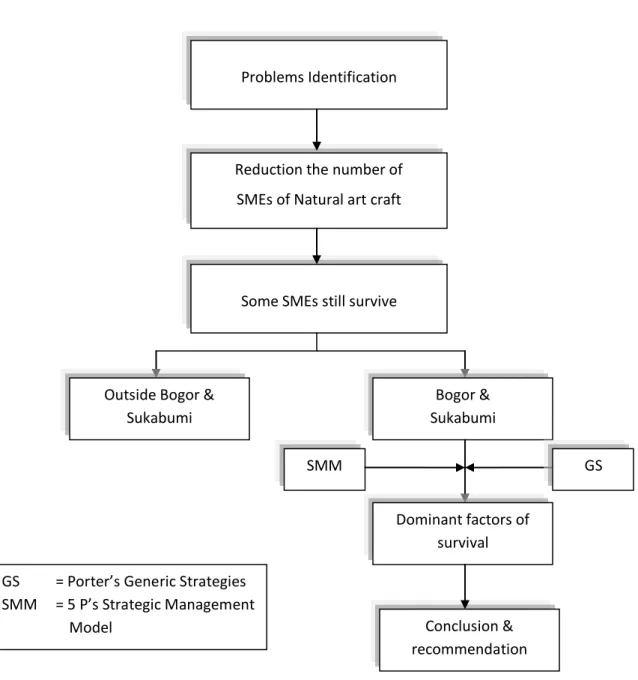
1.6. Theoretical Framework
Figure 1.1. Theoretical Framework Source: construct by researcher
Problems Identification
Reduction the number of SMEs of Natural art craft
Some SMEs still survive
Outside Bogor &
Sukabumi
Bogor &
Sukabumi
Dominant factors of survival
Conclusion &
recommendation
GS SMM
GS = Porter’s Generic Strategies SMM = 5 P’s Strategic Management
Model
8 In this research, there are 8 variables that would be analyzed based on two theories, Porter’s Generic Strategies and 5 P’s Strategic Management Model.
According to Porter’s Generic Strategies, there are 3 variables that will be analyzed. It is covered the cost leadership, differentiation, and focus. According to 5 P’s Strategic Management Model, the variables consist of 5 variables, as follow purpose, principle, process, people, and performance.
Both of those theories will be useful to determine dominant factors which create competitive and strength point of SMEs in natural stone art and wooden root furniture sectors. All those factors will be reflected in questionnaire that is constructed by the researcher and each questionnaire will represent each strength factor based on the theories. In processing the data, factor analysis will be applied to find the dominant factors. The result will show the dominant factor of the firm for survive in the competition.
1.7. Scope and Limitation of the Study
The scope and limitation of this research are presented in order to understanding the border areas of the result that is likely to be improved by using other analysis methods.
Scope:
- This research is focused on the SMEs of natural stone art and wooden root furniture in Bogor and Sukabumi as representation of the Indonesian artisans in this sector of commodity
Limitation:
- This research is only applicable for the SMEs that focus on export-oriented
-
Inaccuracy of the data collection because unavailability data from the local government because most of the firm have not registered yet in the Department of Trade and Industry in local government. The data was taken from APASINDO (Asosiasi Pengrajin Seni Alam Indonesia) or Indonesian Art of Nature Artisans Association.9
1.8. Definition of Terms
There are some terms used in the content as follows:
Artisan or Craftsmen
An artist skilled in the techniques of an art or craft. It could be defined as a skilled manual worker who makes items that may be functional or strictly decorative SMEs (Small and Medium Sized Enterprises)
The enterprise that considered being any entity engaged in an economic activity, irrespective of its legal form. This includes in particular, self-employed persons and family businesses engaged in craft or other activities, and partnership or associations regularly engaged in an economic activity
APASINDO (Asosiasi Pengrajin Seni Alam Indonesia/ Indonesian Art of Nature Artisans Association)
The association of the artisans of natural art crafts, such as natural stone art, wooden root art, rattan art, and other natural crafts throughout Indonesia and is engaged in the development of handicrafts Indonesia in order to be able to penetrate the global market
GDP (Gross Domestic Product)
The total market value of all goods and services produced in a country in a given year, equal to total consumer, investment and government spending, plus the value of imports
10
CHAPTER II
LITERATURE REVIEW
2.1. Small and Medium Sized Enterprises (SMEs)
2.1.1. Definition of SMEs
Small enterprise according to UU No. 9/1995 is an enterprise that belongs to Indonesian resident which in the form of legal entity whether it is individual or group, this enterprise has asset at most Rp. 200 million not included land and building or revenue Rp. 100 million per year at most.
Medium enterprise according to Inpres No. 10/ 1999 is a productive enterprise that belongs to Indonesian resident in the form of legal entity either individual or group, this enterprise has asset range between Rp. 200 million to Rp. 10 billion (without land and building) or have revenue at most Rp. 100 million each year.
SMEs could be defined as: (a) enterprises with a relatively small share of their market; (b) managed by owners or part-owners in a personalized way, and not through the medium of a formalized management structure; and (c) acting as separate entities, in the sense of not forming part of large enterprise or group 3 (Storey, 1994 cited in Sultan, 2007, p.47).
2.1.2. Characteristics of SMEs
There are some characteristics that will interpret the small and medium sized enterprises, especially in developing countries. Most of the SMEs in developing countries are one-person business, and the largest single employment category is working proprietors (Fisher and Ruber, 2000 cited in Sultan, 2007, p.48). The group and family represent the majority of the workforce and the informal
3 This definition was taken from journal of Storey, D.J. entitled Understanding the Small Business Sector, ITP, London, 1994.
11 relationship of the family dominates formal, explicit relationship when trust, loyalty and family ties are important to advancing the business (Habbershon and Williams, 1999 cited in Sultan, 2007, p.48). The size of the SMEs in developing countries is also mostly determined by the domestic market where they operate (Sultan, 2007).
Other sources had classified the characteristics of the SMEs based on some following aspects:
1. Ownership: Privately owned by individuals or partners, typically registered as sole proprietorship, partnership or private limited company 2. Management: the business is managed and operated by the owner. The
entrepreneur or founder of the business leads the company, and act as both manager and worker. The development of the business is determined by the owner. Decision maker is also centralized to the owner.
3. Resources: SMEs often has limited resources. This is especially true for new starts-up due to lack of track record on the business to convince potential investors and bankers. Thus, it is highly dependent on the ability of the owner to generate resources
4. Organizational structure: for a small business, the structure is often flat and informal. The owner has to do almost everything and the workers are normally expected to be able to function as generalists since there is no clear demarcation of tasks.
5. Flexibility of change: the business has more flexibility to adapt to changes in the environment due to its size and informal structure. It is also vulnerable to develop in the business environment and it might become a constraint to the business in order to compete and sustain itself in their market.
(www.radiniz.com)
12 2.1.3. The Potential Economic and Social Benefits of the SMEs
Salvatore (1993) stated that small and medium sized enterprises (SMEs) are playing an increasingly important role in the process-led industrialization in the developing world. SMEs are the largest group of industrial units in most developing countries and make a significant contribution to manufacturing output and employment. SMEs also have the potential to become a powerful engine of manufactured export growth and upgrading in the developing world.
Small and medium sized enterprises are claimed to be the main potential source of economic growth and innovation as they are an important source of export revenue in some developing countries, given their lower exchange rate, cheaper cost of production, and government incentives. SMEs also use relatively less capital to create jobs rather than larger enterprises. Therefore, improvement of SMEs with the tenacious strategy and being supported by providing access to a global pool of new technologies, skills, capital, and markets will potentially faster export growth and profits than ever before.
There are some potential economic and social benefits of the SMEs to their capacity. It is covered: (a) create jobs at low cost capital; (b) contribute positively to the Gross Domestic Product (GDP); (c) provide an opportunity to expand the entrepreneurial base; (d) provide the required flexibility to adapt to market changes; (e) provide support to large scale enterprises; (f) enter into market niche which are not profitable for larger enterprises; (g) contribute to development policies that are more oriented towards decentralization and rural development4 (Tolento, 2000 cited in Sultan, 2007, p.47). Nevertheless, all those things are also need to be supported by the encouraging environment and supportive regulation system that will help them to improve their business.
4 This was taken from Tolento, A., Guidelines for the Analysis of Policies and Programs for Small and Medium Enterprises Development, ILO Working Paper-EMD/13/E, available at http://www.ilo.org, 2000
13
2.3. Porter’s Generic Strategies
Based on Porter’s generic strategies, the strategies of the business can be classified into three main strategies: (a) cost leadership, (b) differentiation, and (c) focus5. SMEs could apply one of these strategies to achieve their objectives depend on the industrial situation and climate of the market. Every new company also will pursue objectives in different point of view from the established company and they have to analyze and determine which strategies that is appropriate and could be implemented in the system of the company.
I. Cost Leadership
In essence, cost leadership strategy is a strategy for a firm to strive to produce a product or service at the lowest possible cost (Chak, 1998).
Source of cost advantage are likely to be rare including learning-curve economies, differential low-cost access to factor of production, and technology (Sultan, 2007).
SMEs could succeed in cost leadership if they have the internal strength, such as access to the capital required in order to make a significant investment in production assets, skill in designing products for efficient manufacturing, high level of expertise in manufacturing process, and efficient distribution channel (quickmba.com).
The downside of this strategy is when a company is too focus on implementing cost leadership strategy, it sometimes will sacrificing some key elements that exist within the company in order to minimize existing cost which will reduce the quality of the other elements. For instance, when the company implemented cost leadership, sometimes it affects the quality of goods sold. As a result, the market will be too wide to all class people that are likely to lose vision from the segment that will be achieved.
5Generic Strategies was first presented by Professor Michael Porter in 1980. He is a lecturer in Harvard Business School. He classified the strategies into those 3 strategies because it is essentially will determine what the company would serve and how to compete in the market.
14 II. Differentiation
Firm can differentiate their products in different ways: product features, linkages between functions, timing, location, product mix, links with other firms, product customization, product complexity, consumer marketing, distribution channels, service and support, and reputation. The focus of the strength point business is determined and adjusted with the objectives that will be achieved by the firm and the target customer in the market.
In the marketing perspectives, Kotler (1994) stated that the main product differentiators are features, performance, conformance, durability, reliability, repairability, style and design. In the context of export-oriented product, especially for handicraft products, feature, design, and services after sales which related to bureaucracy to do export are the important elements that should be noticed by the artisans. It is because mostly buyers considering buying the products depend on those aspects.
A differentiation strategy is appropriate where the target customer segment is not price-sensitive, the market is competitive or saturated, customers have very specific needs which are possibly under-served, and the firm has unique resources and capabilities which enable it to satisfy these needs in ways that are difficult to copy.
III. Focus
The focus strategy concentrate on a narrow segment and within that segment attempts to achieve either a cost advantage or differentiation. The premise is that the needs of the group can be better serviced by focusing entirely on it. A firm using a focus strategy often enjoys a high degree customer loyalty, and this entrenched loyalty discourages other firms from competing directly (quickmba.com). Firm focus on a particular market niche and company resources are devoted to maintain market leadership in that niche (Sultan, 2007).
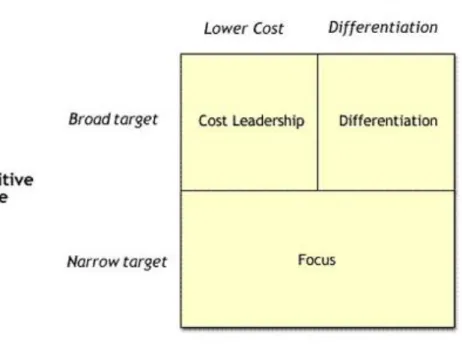
15 The Model of Porter’s General Strategic could be seen as the figure below:
Figure 2.1 Porter’s Generic Strategies
Source: Porter (1985)
From the figure above, the cost leadership strategy can be well implemented when a firm could achieve the lower production cost with the broader target. It means that it will led to the tight competition in the market but it could gained benefit from lower cost which influence to the price or profit margin to the firm itself.
Differentiation strategy could be implemented by a firm when the product and service are differ and has a distinct model. This strategy has broader target of customer but with the differentiate product, the quality and special characteristics will be a particular aspect, both in products or services of the firm, to attract the customer.
Focus (niche) strategy is implemented where a firm focuses the effort and resources on a narrow market scope or the narrow segmentation. The niche strategy is a flexible strategy, meaning that this could be adjusted with
16 either cost leadership or differentiation strategy. However, the firm must choose one between those two strategies because when a firm is fail to achieve it, the firm will get stuck in the middle without competitive advantage in the business.
2.4. 5 P’s Strategic Management Model
The 5 P’s strategic management model is a model which small business or SMEs leaders should use for long-term survival and success. This model consist of 5 elements, those are purpose, principle, processes, people, and performance.
I. Purpose
This element involves all the elements that constitute the strategic intention of the organization. This element is corresponded with the objectives, goals, vision and mission of the company and the strategies to achieve it.
This element usually applied at the beginning. With the explicit goals, the direction and command will be more focused on one ultimate goal for the company’s progress.
II. Principle
These are the guiding philosophies, assumptions, or attitudes about how the organization should operate and conduct business. They are the integrity base, ethnics, and core values to which employees are expected to make a commitment when they are hired. These core values are the foundation for the way decisions are made and employees behave. Leaders of SMEs, especially family-owned businesses, understand the principle upon which their organizations were founded and upon which they currently operate.
III. Processes
Processes are the organizational structures, systems, and procedures that are used to make the products or perform the services that the organization provides, as well as the infrastructure and rules that support these systems
17 and procedures. This element is very important because every company is required to create the effective and efficient system. Through that way, the process that occurred from the start of production until sales process will greatly support the company’s results to be obtained later, such as market expansion, enhance sales volume or increase the profit.
IV. People
They are the employees (individuals and teams) who perform work that is consistent with the principles and processes of an organization to achieve its purpose. This element is associated with the improvement quality of human resources. This element will determine how all the system that have been designed or purpose to be achieved will be implemented and attained by the perpetrators of the business; those are the employees in the company itself.
V. Performance
Performance encompasses all the metrics, measurements, and expected results that indicate the status of the organization and are used as criteria for decision making. Performance results are feedback into the strategic management process to provide a means of feedback and control. It is essential that small business leaders understand and establish measurement and feedback systems for their organizations long-term survive and profitability.
This Strategic Management Model can be applied differently for every single element but it will be effectively if there is an alignment among those elements to be an interlacing flow. The alignment process is interrelated, in which started with the purpose as the basis point, continue to principle, processes, people, and eventually to the performance.
18 The flow of alignment process is shown as the figure below:
5 P’s Strategic Management Model
Figure 2.2
Source: Pryor, White, Anderson and Toombs (1998)
From the figure above, if one of the organization’s core values (Principles) is performance excellence, then Performance must be evaluated and improved. In other words, metrics systems must be developed that measure the right things—
safety, security, quality, on-time delivery, etc.; baselines and targets must established; actual results must be compared to targets; and the results must be fed back through the system so that Processes, products, services, and relationships can be improved. Using the 5P’s Model, small business leaders would incorporate the Strategic management Model and could incorporate and standards management system to assess, manage, and improve their organizations.
19
CHAPTER III METHODOLOGY
3.1. Research Method
This chapter gives an overview of the research method used and any procedure followed during the research. All steps that has been operated would determined the elements that is used to process the data, such as sampling design, respondent selection, collecting the data, computation and the result as the decision of the research.
3.1.1. Research Design
Research design is classified into two main methods, the qualitative method and quantitative method. Qualitative method is a method of inquiry employed in many academic disciplines, traditionally in the social science, but also in market research and further context.6 On the other hand, quantitative method is a research method that is used to analyze quantitative data to organize and understand numbers and, in turn to make a good decision (Brandimarte, 2011). Quantitative research also emphasized detailed planning prior to data collection and analysis (Neuman, 2003).
Shield and Twycross (2003) through their research identified the difference between quantitative and qualitative research as follows:
- At the most basic level, quantitative research methods are used when something needs to be measured, while qualitative methods are used when a question need to be described and investigated in some depth.
- Quantitative research usually contains numbers, proportions and statistics, and is invaluable for measuring people’s attitude, their emotional and behavioral, states and their ways of thinking. On the other hand,
6 This statement originally cited from Denzin, Norman K. & Lincoln, Yvonna S. (Eds.).
(2005). The Sage Handbook of Qualitative Research (3rd ed.)
20 qualitative research usually has no measurements or statistics but uses words, descriptions and quotes to explore meaning.
This research is prefer to quantitative research methods because this research is conducted to determine the dominant factors of survival elements as the strength points by SMEs of natural art craft. This research is interpreted into 8 variables, it covers: the cost leadership, differentiation, focus (Generic Strategies), purpose, principle, processes, people, performance (Strategic Management Model). By using quantitative methods, process of data collection can be done faster, more accurate results, can measure the relationship of the interaction between two variables or even more, and can further simplify or summarize the various data into a single conclusion. Besides, this methods also applicable for a large amount population and compute it in a collection of numerical data.
3.1.2. Source of Data
This research is using 2 types of data, primary data and secondary data.
1. Primary data is the collection of information that gathered by researcher directly from the stakeholders or the people involved in that business. In this research, the researcher was collecting the primary data by using questionnaire as the technique. Questionnaire was chosen because this technique is easier way to get the data from the respondents, was held at the same time and randomly, saving time, and easier to compute the result.
2. Secondary data is the collection of information gathered or provided from
―the second-hand‖ sources or indirect sources, such as in website, article, newspaper, or other similar sources. In this research, the secondary data was taken from APASINDO and some sites that concerned about small and medium sized enterprises in Indonesia.
3.1.3. Analysis Tools
The statistics tools of this research are using SPSS (Statistical Package for the Social Sciences) 16.0 version and Microsoft Excel 2007. These software were
21 chosen because it is easy to use and informative in presenting the result, compatible and suitable to analyzing the data that related with the business activities or corresponded with the decision making process in the business.
3.1.4. Research Time and Place
The research is conducted in Bogor and Sukabumi city, West Java. These locations were chosen because both cities are the central market of the natural art craft in West Java. The Questionnaires would be distributed to the artisans or business person as the stakeholder of this business in Bogor and Sukabumi region. The distribution process of questionnaire was held during 1 month, started from November, 14th to December, 14th, at 08.00 – 17.00 each day.
3.2. Research Framework
The research framework will show the step that has to be followed in this research. The research started by determines the object of the research and the problems occurred in that object. After the problems identified, then it continue with determine the topic that will be a basic for the appropriate title of the research. After that, the research will continue by identifying the theories that will be used as the basic theories to determine the manifest variables for making the questionnaire. The basic theories were taken from Porter’s Generic Strategies and 5 P’s Strategic Management Model.
The next step is construct the questionnaire, which will be used for pretest in order to define whether it valid and reliable or not to be analyzed. The questionnaire for pretest will be distributed to the sample respondents. Once the statements are valid and reliable, it will be distributed to the respondents. The result of the questionnaire which still formed in a raw data will be computed in Microsoft Excel in order to convert it from interval into ordinal data using Successive Interval Method. Next, the data is processed by using SPSS ver. 16.0 with factor analysis method. The rotated component matrix that is presented by SPSS will create the new factors that interrelated among the latent variables and it will show the dominant factors as the result of this research
22 Figure 3.1. Research Framework
Source: constructed by researcher
Find the problem
Determine the basic theories
Question development &
evaluation
Questionnaire for Pretest Transforming Ordinal
into Interval Data
Pretest for validity and reliability
Collect and organize data Valid and
Reliable
Transforming data
Processing data
Data result
Analysis data
Conclusion Successive Interval
Method
SPSS ver. 16.0 software
Microsoft Excel 2007
Successive Interval Method SPSS ver. 16.0
software
Factor Analysis
23
3.3. Research Instruments
The data collection tools for this research instruments is by conducting the survey. The survey will be conducted by disseminated the questionnaire to the respondents. The questionnaire is very effective as a tool because the respondents are widely spread in Bogor and Sukabumi city. Besides, questionnaire is also very potential to get the information from large number of people in a very short time.
The questionnaire that is used is self-constructed in which it is needed to follow the preliminary pretest in order to test for reliability and validity.
3.3.1. Pretesting
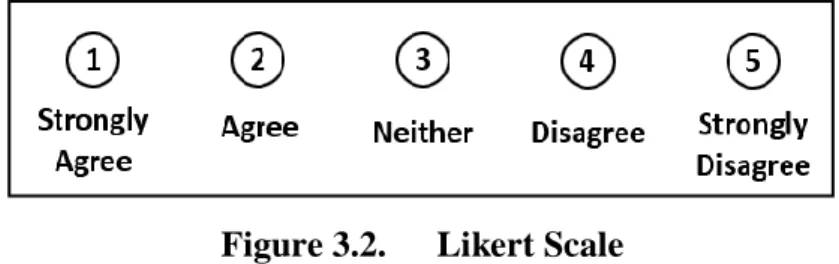
Pretest will be conducted by using the self-constructed questionnaire that contained the statements with Likert Scale standard. Likert Scale is a psychometric measurement that is constructed by statements that corresponded with the respondent’s activities or the other research’s object7. The scoring consist of 5 option from ―strongly disagree‖ to ―strongly agree‖ that will be represented by the numerical score from 1 to 5 in sequence. The Likert Scale is appropriate to be applied in filling questionnaire for this research because it will be easier the respondents to fill the questionnaire by choosing the scale options or the agreement about the object. For example:
Figure 3.2. Likert Scale
Source: www.poincare.matf.bg.ac.rs/~kristina//topic-dane-likert.pdf
The questionnaire is contained the statements that will represent the 8 elements of Porter’s Generic Strategies and 5 P’s Strategic Management Model. Those are consisting of 3 elements from Generic Strategies (Cost leadership, Differentiation and Focus) and 5 elements from Strategic Management Model (Purpose,
7 Psychometric measurement means the measurement that related with the psychological object, such as abilities, knowledge, personality, principle, attitudes, etc. This method was created by Rensis Likert, a sociologist at University of Michigan in 1932.
24 Principle, Processes, People, and Performance). Each element consists of several statements that will emphasize to the respondent’s activities related to the object of the research.
3.3.2. Scaling Measurement
Collection of data from questionnaire was formed in ordinal data. Ordinal data is the numerical data that comes from the rating scale and have a natural order, such as the number scale using Likert Scale. The data need to be converted from ordinal data to interval data. Interval data is the qualitative measurement in which the scale measurement where the distance between any two adjacent units of measurement is the same but the zero point is arbitrary (www.stats.gla.ac.uk).
This conversion step is conducted in order to completing the requirements of parametric statistic. Converting method that will be used is Successive Interval Method (SIM). Some phases should be followed in this method to create the interval data as the end result. It is consist of:
1. Determine the frequency for every respond or answer
2. Calculate the proportion for each respond/answer by dividing frequency with all respondents
3. Adding up all the proportions sequentially for each response in order to obtain the cumulative proportion
4. Determine the Z score for each category (statement) using formula NORMSINV in Microsoft Excel.
5. Calculate the density for each statement from the Z score that has calculated previously
6. Calculate the SV (Scale Value) with formula:
7. Convert the lowest SV (the highest negative value) equal to one
8. Transforming each scale value according to the smallest scale in order to obtain transformed scale value by using formula:
25 Y = SV + | SV Min |
The process of transforming of ordinal data into interval data in this research actually using Microsoft Excel that automatically will transform it.
3.3.3. Validity
The source of data in this research is mainly using primary data using questionnaire. Therefore, the collection of data should follow several steps until it is eligible to be used in the real calculation. Through pretesting, the statements in that have been constructed in questionnaire will be tested. The intention of pretest is to identify whether the statements in questionnaire are valid and reliable or not to be used in the research.
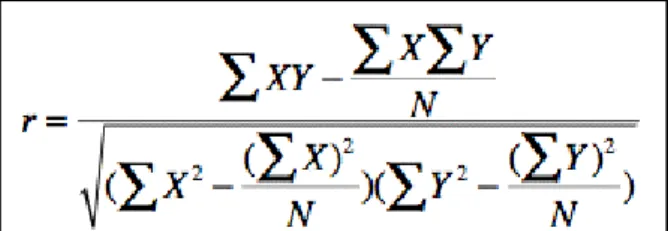
Validity test in this research is using technique correlation from Pearson or usually called Pearson’s Correlation Coefficient. The method is a measure of the strength of the association between the two variables (hsc.uwe.ac.uk). This method is conducted by scoring the correlation between statements and the total score in which usually calculated based on the actual values of X and Y. the formula is shown below:
Figure 3.3. Correlation Coefficient Formula Source: www.davidmlane.com
Where:
r = Pearson Correlation Coefficient (r) N = the number of paired observation
∑X = the X variable summed
∑Y = the Y variable summed
(∑X 2) = the X variable squared and the squared summed
26 (∑X)2 = the X variable summed and the sum squared
(∑Y 2) = the Y variable squared and the squared summed (∑Y)2 = the Y variable summed and the sum squared
∑XY = the sum of the product of X and Y
The validity testing is using SPPS ver.16.0 as a tool to calculate the result automatically. The result of validity could be defined from comparison between the results taken from r computation in SPSS with the value of r table from Pearson’s Product Moment (the detailed data is attached in Apendix). If the result of r computation is higher than r table limit value, it considered valid statement.
Conversely, if the value of r computation is lower than r table limit value, then it considered invalid statement.
Validity testing result
20 respondents are chosen as sample for pretest. At the beginning, questionnaire is constructed by 43 statements from 8 variables (the preliminary questionnaire is attached in Appendix). After following validity testing by using SPSS ver. 16.0, the result shown that 10 statements are invalid and must be eliminated from the questionnaire. After identified the validity items and eliminating the invalid items, there are 33 valid questionnaires. The example of the result from pretesting is shown below:
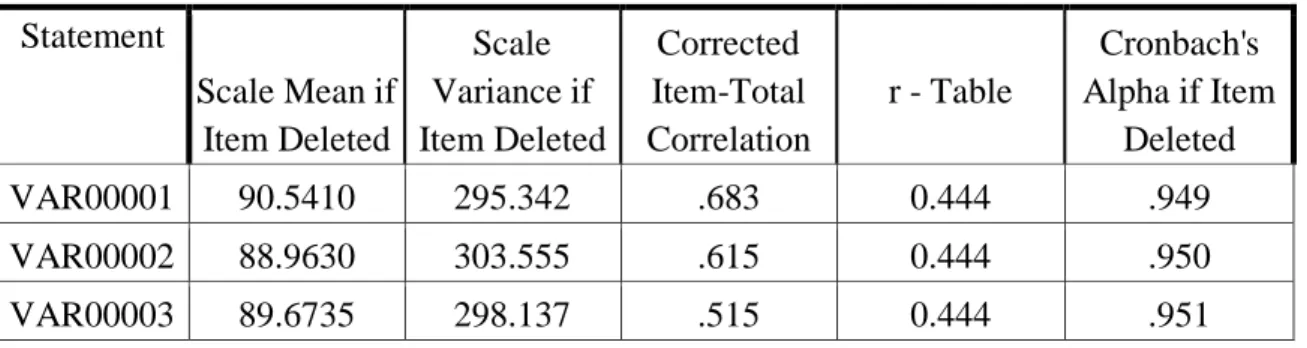
Table 3.1. Result of Validity Testing Statement
Scale Mean if Item Deleted
Scale Variance if Item Deleted
Corrected Item-Total Correlation
r - Table
Cronbach's Alpha if Item
Deleted
VAR00001 90.5410 295.342 .683 0.444 .949
VAR00002 88.9630 303.555 .615 0.444 .950
VAR00003 89.6735 298.137 .515 0.444 .951
Source: SPSS ver. 16.0 and primary data
From the table above, column of Corrected Item-Total Correlation show the validity value for each statement or variable in the questionnaire. That value will be compared with value of r-Table, which show the limit of validity value, which
27 means if the value of Corrected Item-Total Correlation is lower than the value of r-Table, the statement is valid and eligible to be involved in factor analysis.
3.3.4. Reliability
Reliability is the consistency of a set of measurements or measuring instrument, often used to describe a test (nationmaster.com). Reliability testing in this research is using Cronbach Alpha formula. The formula is measure of internal consistency, that is, how closely related a set of items as a group (www.ats.ucla.edu). It is also indicates the extent to which a set of test items can be treated as a measuring a single latent variable (nationmaster.com).
Cronbach alpha formula can be written as a function of the number of test items and the average inter-correlation among the item. The formula shown below:
Figure 3.4. Cronbach Alpha Formula Source: www.nationmaster.com Where:
= instrument reliability’s coefficient
= the average inter-item correlation among the items N = the number of items
This research utilized SPSS ver.16.0 as a tool to calculate the reliability automatically. The higher the value, the better or more reliable (close to 1). The variable that has been calculated should be higher than 0.7 to be accepted in the research.
Reliability testing result
After it has been computed using SPSS ver.16.0, the result of reliability testing is as follows:
28 Table 3.2. Reliability Statistics
Cronbach's
Alpha N of Items
.952 33
Source: SPSS ver.16.0 and primary data
The reliability result shown in column Cronbach’s Alpha is 0.952, which means higher than 0.700 as the basis point. It means that the questionnaire is reliable and is eligible to be continued to the next step of research using factor analysis.
3.4. Data Processing
3.4.1. Factor Analysis
This research will use factor analysis method to determine the dominant factors according to sustainability of the SMEs of natural art craft. Factor analysis refers to a collection of statistical methods for reducing correlational data into a smaller number of dimensions or factors (wilderdom.com). It is begin with collecting a large number of variables and then reduce and divide it into some clusters consist of variables that interconnected one another. There are 2 types of variables involved in this research; these are manifest variable and latent variable.
There are some following steps in performing factor analysis. It consists of:
1. Collect measurement in raw data matrix
The data collected from questionnaire must be arranged in column and row area. It is consisting of data respondents (in row) and data variable/statements (in column). The data collected then will be converted and transformed from ordinal to interval data by using SIM through Microsoft Excel. After that, the data also have to follow pretesting in order to determine the valid and reliable data in which eligible to be processed to the next step in factor analysis. Thus, the valid and reliable questionnaire is distributed to the number of respondents and the result
29 will be collected and computed in raw data matrix collection. (The raw data matrix is attached in Appendix)
2. Obtain the correlation matrix
The correlation matrix will express the degree of relationship between row and column variables of the matrix, in which will determine the relationship between data respondents and data variable/statements. It is shown by the correlation value. The high correlation value is closer to 0 (zero) which means getting good factors for analysis.
The methods to determine the appropriateness of factor analysis examine the entire correlation matrix and used as the preliminary test whether the data collected can be parsed become some factors using Bartlett’s Test of Sphericity and Kaiser-Meyer-Olkin (KMO). In Bartlett’s Test of Sphericity, the significant level for identifying matrix should be less than 0.001. The Kaiser-Meyer-Olkin measures (KMO) measure sampling of adequacy has purpose to understand whether the data collected has been adequate.
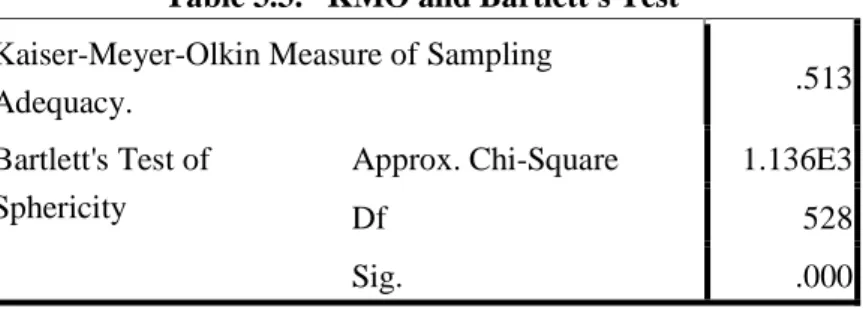
The measurement of KMO could be interpreted with some characteristics as follows: 0.9 or above is characterized as marvelous, 0.8 or above is characterized as meritorious, 0.7 or above is middling, 0.6 or above is mediocre, 0.5 or above is miserable, and below 0.5 is characterized as unacceptable (evolumedia.com). According to the result after computation of data using SPSS, the KMO and Bartlett’s Test are
Table 3.3. KMO and Bartlett's Test Kaiser-Meyer-Olkin Measure of Sampling
Adequacy. .513
Bartlett's Test of Sphericity
Approx. Chi-Square 1.136E3
Df 528
Sig. .000
Source: SPSS ver.16.0 and primary data
30 In this research, the researcher KMO measure of Sampling Adequacy value is 0.513. Based on the criteria of KMO value, the researcher’s KMO value is miserable, but it is still acceptable for factor analysis method.
The significant level of the research is 0.000. It means that the correlation matrix of the manifest variables is not an identity matrix, so it can be measured by using factor analysis method.
3. Extracting factors
The process of factor extraction will determine the minimum number of common factors that will satisfactorily explain the observed correlation among the observed variables. In this research, the method used to extract the factor is by using Principal Component Analysis. This analysis will determine the correlation amongst the variance and intend to conduct data reduction. In order to determine how many factors could be accepted empirically, it depends on the eigen value.
Eigen value is the value that represents the total variance explained by each factor. If the eigen value is bigger than 1 (>1), so it means that the factor is more representative to the related variable. After factors have been extracted, the graph of Scree Plot will show the impact of factoring to the eigen value.
The other values that will be identified from factor extraction are communalities value, factor loadings, and cumulative percentage.
Basically, communality is the sum of variance from the basis variable that can be explained by the existing factor. The range of communality value is between 0 and 1. If the value is closer to 1, it means that the variable can be explained more by factor formed. Factor loadings show the correlation among each variable with the factor formed. Cumulative percentage is the total percentage that shown the representative of total variable variance in the research.
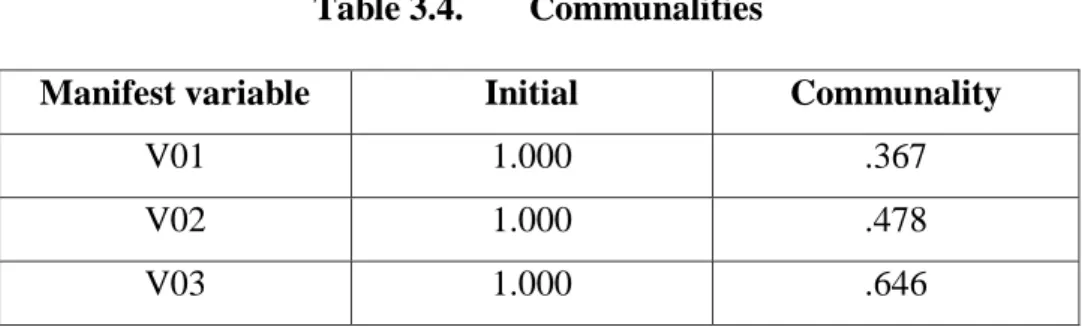
31 Table 3.4. Communalities
Manifest variable Initial Communality
V01 1.000 .367
V02 1.000 .478
V03 1.000 .646
Source: SPSS ver.16.0 and primary data
Table above show the communalities before (initial) and after extraction.
It explains that the communality value is the percentage of variance associated with the manifest variable could be explained by variable formed. For instance, V01 has communality value .367 means V01 only can explained 36.7% of the variance associated with variable 1. The detail communalities value is attached in Appendix. Besides, factor extraction is also determining several values. It shown in the table below:
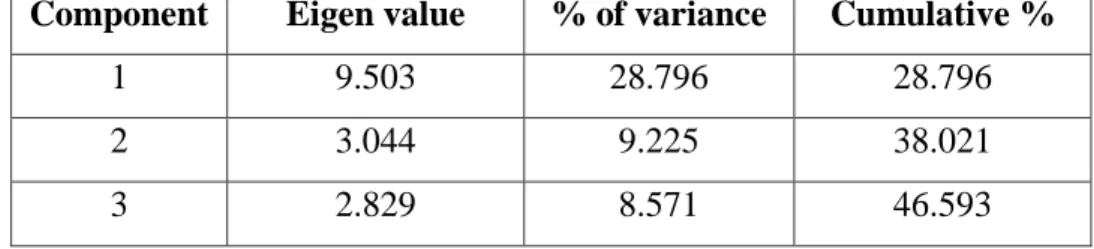
Table 3.5. Total Variance Explained
Component Eigen value % of variance Cumulative %
1 9.503 28.796 28.796
2 3.044 9.225 38.021
3 2.829 8.571 46.593
Source: SPSS ver. 16.0 and primary data
Based on the table above, there are 3 factor formed with the eigen value bigger than 1. Those three factors are constructed by 6 manifest variables.
The first factor is the most dominant factor with 28.796% and the total variance of the entire factor formed is 46.593%.
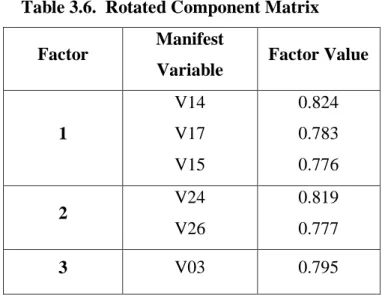
4. Rotated component matrix
The purpose of rotation component matrix is to simplify the factor structure that will easier and meaningful to interpret the variables, in which each variable will be associated with minimal number of factors. In
32 this research, the rotational method being used is varimax rotations.
Varimax rotation will minimize the variables with highly loading on a factor and this method will optimally increase the interpretability of the factor.
The result of rotated component matrix can be shown in table below:
Table 3.6. Rotated Component Matrix Factor Manifest
Variable Factor Value
1
V14 V17 V15
0.824 0.783 0.776
2 V24
V26
0.819 0.777
3 V03 0.795
Source: SPSS ver.16.0 and primary data
3.5. Sampling Design
Sampling is the process of selecting a sufficient number of elements from the population, so that study of the sample and an understanding of its properties or characteristics would make it possible for us to generalize such properties or characteristics to the population elements (Sekaran, 2003). This research is using probability sampling design where all elements in the population are considered and have the same chance to be chosen.
Specifically, this research is using simple random sampling design. The respondents chosen randomly and every element in the population have a known and equal chance of being selected as a subject. The number of respondents was chosen in two cities, Bogor and Sukabumi. Those locations was chosen because the limitation of the researcher (will be explained later on in the limitation) and
33 those cities are the central market for the commodity of natural art craft, especially in West Java.
Since the number or population has been identified, the number of respondent is determined by using Slovin sampling method. This formula is used when nothing about the behavior of the population is known at all. Before calculating the number of respondent or sample needed, the researcher have to determine the confidence level that interrelated with the margin of error. The confidence level of this research is 90%, which means 10% of margin error. The formula is shown below:
Figure 3.5. Slovin Formula
Source: www.ehow.com
n = Number of sample N = Total population
e = Error tolerance percentage toward inappropriate usage of the sample (e=10%)
The sample size for this research will be:
n = 48.45 = 48 sample
In order to avoid the failure data, the researcher decided to distribute the questionnaire to 50 respondents.
34
3.6. Limitations
There were some limitations appeared during the process of the research. The limitations consist of:
1. The area of research is only limited to the performance and strategic management of the firm. The research did not analyze about the profit margin, sales revenue, number of product sold, and so on.
2. How to explain about this research objectives to the artisans as the object of the research becomes limitation. Many of them did not understand about the purposes of the research and how to fill the questionnaire in order to make it valid and reliable.
3. The lack of substantial source or reference is also become a limitation of the research. It is because this research object is related with micro economics and very specific to one sector of industry
4. The research using electronic tools, such as SPSS ver.16.0 and Microsoft Excel to analyze the dominant factors. The limitation is related with the result, where it cannot be changed
35
CHAPTER IV
ANALYSIS OF DATA AND INTERPRETATION OF RESULTS
4.1. Data Collection
The total amount of respondents involved in this research is 50 respondents. It comes from 2 locations; Bogor and Sukabumi city. The data is shown below:
Table. 4.1. Respondent Dissemination
Location Quantity
Bogor 34
Sukabumi 16
Total 50
Source: construct by researcher
The questionnaire successfully collected from all 50 respondents. Therefore, the result of the questionnaire could be processed to the next research step.
4.1.1. Research Variable
The questionnaire being constructed is based on generic strategies and strategic management model. The variable that will be the basis to build each statement classified into 2 types of variables. The variables are as follows:
- Manifest variable
It could be defined as a variable that can be directly measured or observed.
It is considered either continuous or categorical (www.investopedia.com).
- Latent variable
It could be defined as variable that are not directly observed but are rather inferred from other variable that are observed (directly measured)
The manifest variable will construct latent variable that will build the statements to explain each factor. On the other side, latent variable cannot explain all the variance in its manifest variable.
36 There