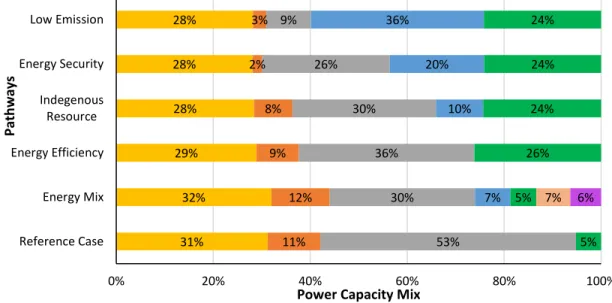
Percentage of ranks obtained by each path for (i) decision makers weight uncertainty and (ii) decision makers. 88 6.2 Candidate power plants for future addition of electricity generation capacity (Ceylon . Electricity Board, 2015; Institute of Policy Studies, Associates, Resource Management Associates, & Tiruchelvam Associates, 2011; Japan International Corporation Agency, 2015; JPower, 2014; Oriental Consultants, Tokyo Electric Power Services and Consulting Engineers and Architects, 2014).
Overview
Sri Lanka's water-intensive economy faces numerous challenges in water resource management and energy systems infrastructure planning. Both the uncertainty of water resource availability and high dependence have created serious national concerns for water resource management.
Study Objectives
Identifying droughts before the season would be really helpful for water and energy planners to take adaptation measures. Water and energy managers face challenges in expanding the infrastructure of hydropower and reservoir networks; in planning and implementation, the technical, economic, social and environmental aspects related to the expansion of the infrastructure must be taken into account.
Introduction
Climate teleconnections have been studied for summer monsoons (Singhrattna et. al., 2005; Surendran et.al., 2015) and winter monsoons (Zubair and Ropelewski, 2006). A negative relationship between ENSO and Indian summer monsoon has been identified (Jha et al., 2016; Surendran et al., 2015). Previous studies have identified climate teleconnections linking rainfall with climate indices over several months and monsoon seasons and have shown the importance of these in predicting rainfall in river basins (Chandimala and Zubair, 2007; Chandrasekara et al., 2003).
Hydrometeorology and Climatology of the Study Area
The country reflects the rainy seasons and has two agricultural seasons "Yala" (April - September) and "Maha" (October - March). The Mahaweli and Kelani hydroelectric power stations with a capacity of 810 MW and 335 MW serve as peak and emergency backup power for the power system (Ceylon Electricity Board, 2015).
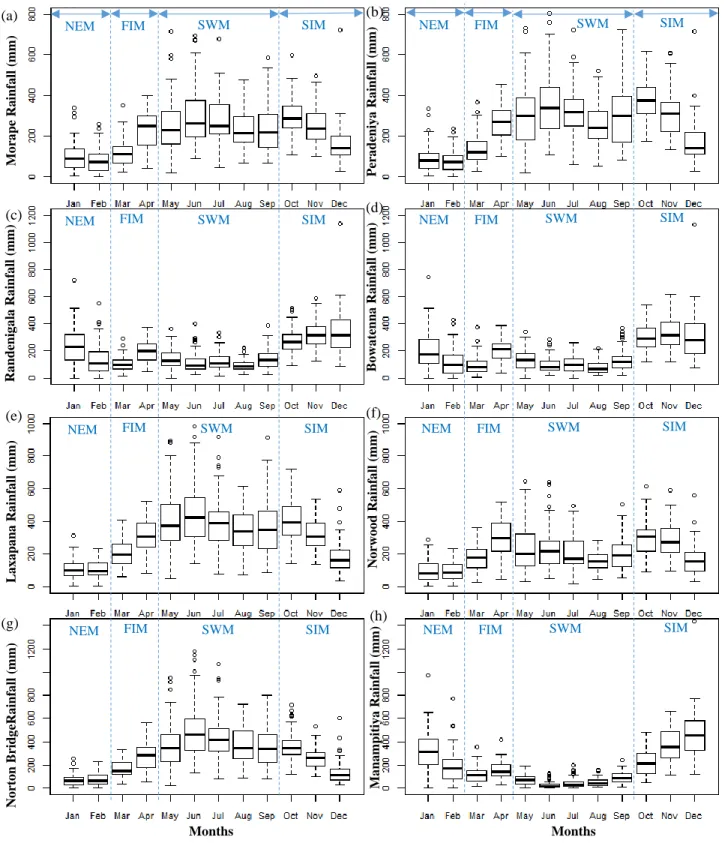
Sub-basin Rainfall (Areal Rainfall)
ENSO & IOD indices
Methods
Quadratic Discriminant Analysis (QDA)
The number of parameters to be estimated for a QDA model for k classes and p predictors is 𝑘. For this study, the output of the QDA model is the probability that a climate category observation will fall into each of the precipitation classes.
Classification Tree Model
First, a very large tree is grown and then a subtree is obtained by removing the weak links of the tree. Tree models give the probability that an observation is included in each of the three precipitation classes.
Random Forest
Using a tuning parameter to examine the trade-off between tree complexity and training error, and determining the minimum samples per node, maximum tree depth, and maximum number of terminal nodes are pruning methods (Vidhya Analytical Team, 2016). For this study, we determined the maximum number of nodes to obtain the simple tree (pruned tree).
Results
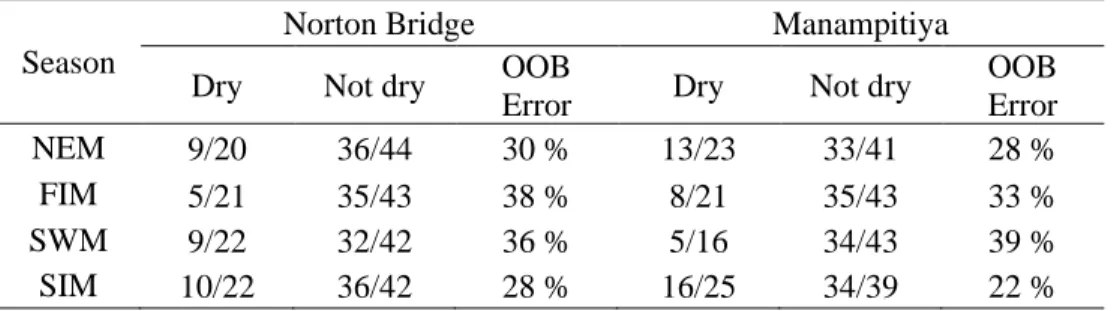
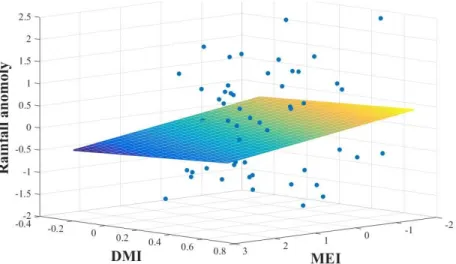
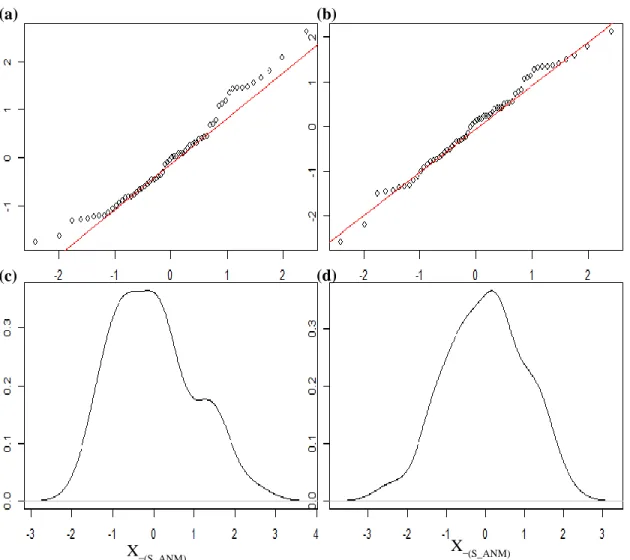
At Norton Bridge, the occurrences of the dry rainfall anomaly class in SWM are seen to "lump" in the area of relatively high MEI and DMI. In the dry zone, the NEM season is one of the most important for rainfall.
Discussion
However, the random forest results for a classification such as "Dry" or "Non-dry". For example, a dry season SWM for Norton Bridge (Table 2.2) and other wet area stations (Table A. 4) was correctly classified with greater than 70% accuracy with QDA and tree models.
Introduction
Conceptual simulation models based on water balance relationships have been used to evaluate reservoir operations in multiple watersheds (Kling, Stanzel, & Preishuber, 2014 ; Tinoco, Willems, Wyseure, & Cisneros, 2016 ). We develop a modular simulation model based on water balance principles for the Mahaweli Reservoir cascade, which can be used to screen water allocation alternatives based on overall system performance, assessed based on hydropower generated, rice yield, fraction of water supplied to agriculture and a series of indices describing the reliability, resilience and vulnerability of the system (De Silva M.
Description of Reservoir Cascade
There are two growing seasons in each year, so there are 126 seasons in the historical record to explore how the hydropower and irrigation systems perform for various water allocation options.
Methods
Simulation model
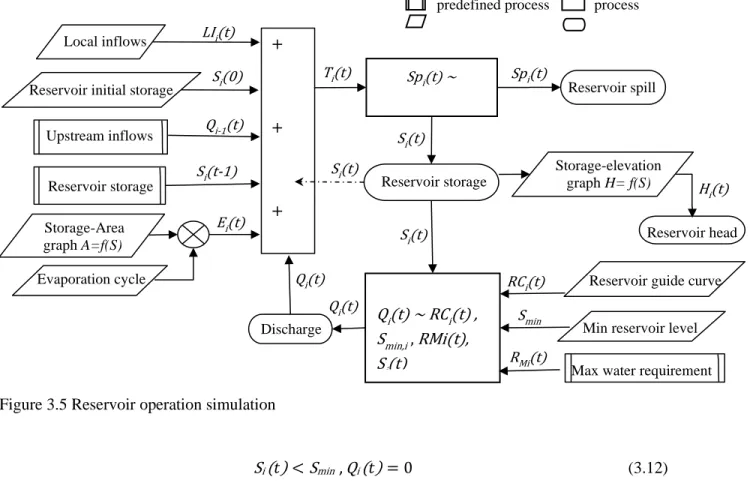
- Reservoir
- Hydropower Plant
- Agricultural Systems
- Water Distribution Decision
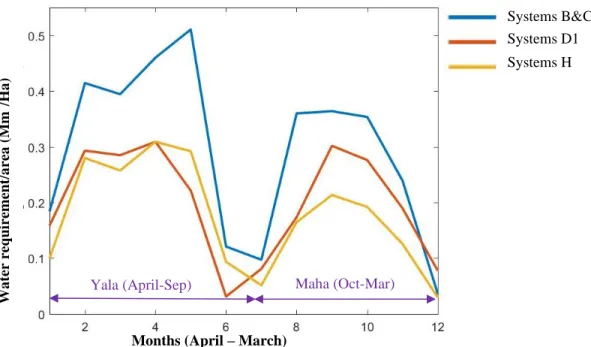
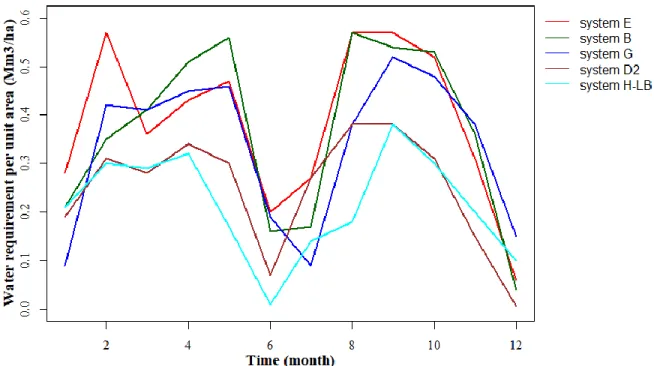
The total water requirement (Dti(t)) is a product of the water load (Di(t)), the water requirement per unit area (Mm3/Ha) (Figure 3.4) and the harvested land (Ai(t)) of the total available land in the system. For these systems, the shortage of irrigation water (𝐷𝑡𝑖(𝑡)) from upstream reservoirs is not covered by local tanks.
Project Performance Measurements
Products of Water Users
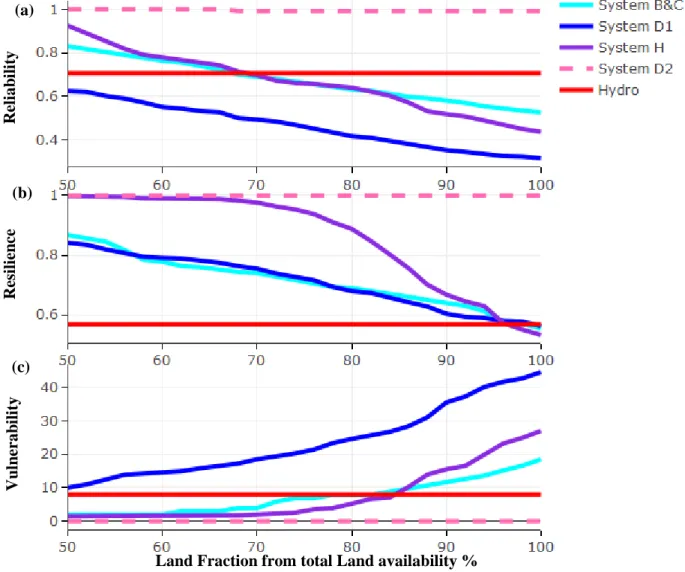
Reliability, Resilience, and Vulnerability
90% of the plant's water demand for 4 months of the season is provided for 90% of the land available for irrigation. We estimate the ratio of total failure-to-success recoveries by the total number of failures during the simulation (3.22).
Fraction of Water Utilization for Irrigation
Evaluation of Water Allocation Alternatives of Mahaweli Project
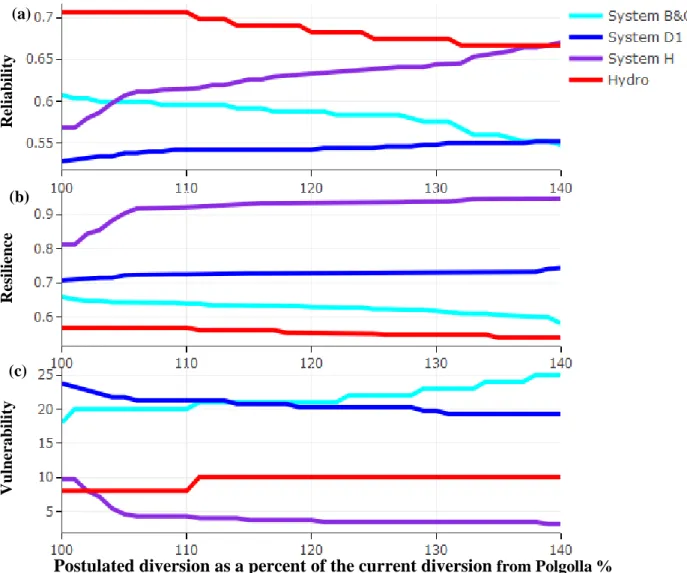
We are investigating performance against management options to maintain the current maximum diversion at Polgolla and to increase the maximum diversion in steps up to 140% of the current value.
Results
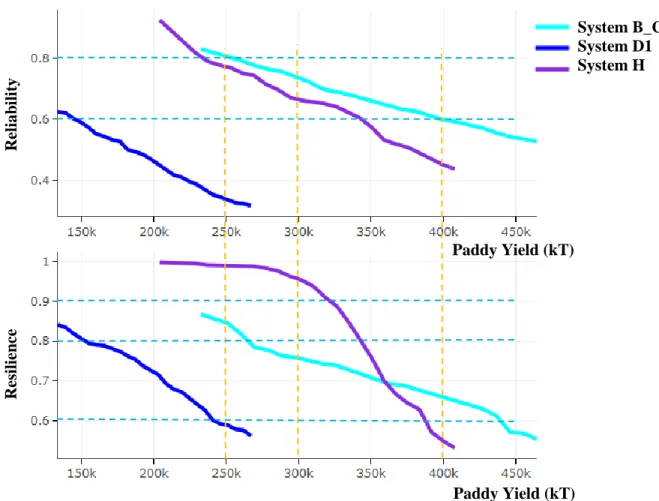
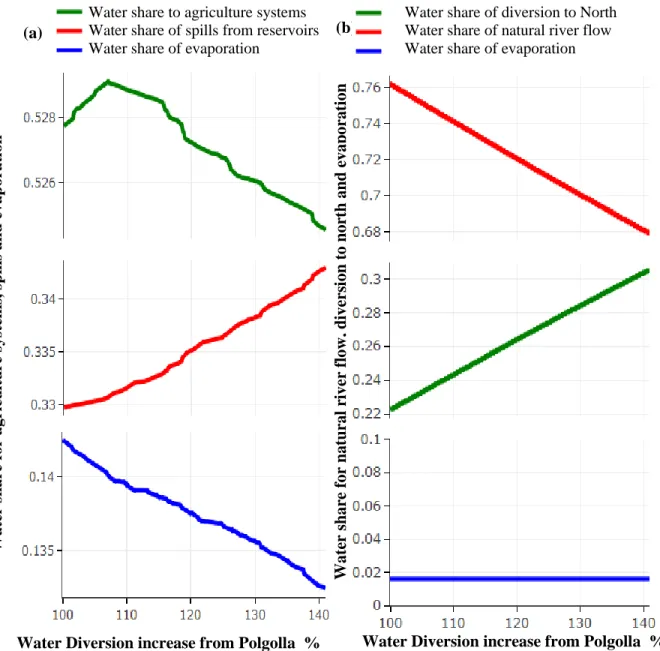
As the diversions at Polgolla increase, releases from the Mahaweli River mainstem reservoirs increase, evaporation losses decrease, and the proportion of water supplied for land irrigation first increases and then decreases (Figure 3.12 (a)). Apart from a 16% increase in the current water discharge at Polgolla, there is no improvement in either paddy yield or energy production (Figure 3.13).
Discussion
Reducing the extent of irrigated lands involves trade-offs between improving risk performance measures and reducing the yield and thus the economic return of agricultural systems (Figure 3.10). Performance measures downstream of the Polgolla diversion are sensitive to water allocation policy (Figure 3.11).
Introduction
Evolutionary algorithms can be used with sequential approximations (Zhou, Guo, Chang, Liu, et al., 2018) to reduce the dimensions of the optimization problems. In this chapter we illustrate how the MOEA optimization method, judiciously applied to a small number of segments of the Mahaweli reservoir cascade to avoid dimensionality issues, can be used to derive operational rules that balance conflicting objectives.
Methods
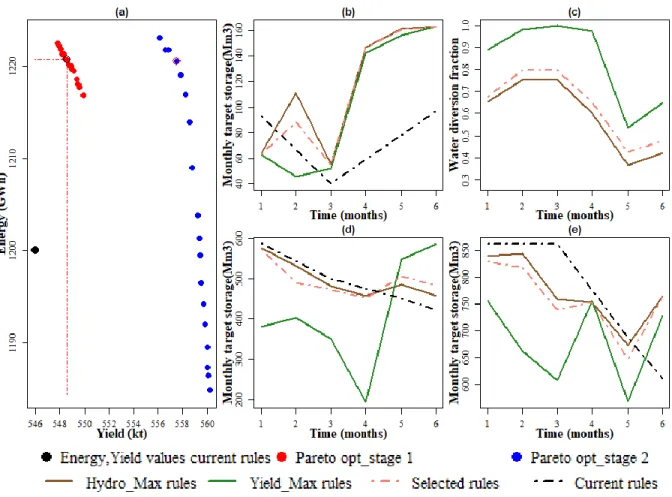
We derive optimal operating rules for three reservoirs and one diversion and the optimization is done in two phases. The optimization exercise is carried out focusing on both the extreme and average inflow conditions (Figure 4.2). river, waterways Agricultural system 1. Steps for deriving the Pareto frontier for maximizing yield from hydropower energy and agriculture and rules for reservoir cascading. a) Identify multiple objectives and decision variables.
Synthetic Stream Flow Generation
Each column M is generated from randomly sampled integers (1,…,𝑁𝐻) which is the number of rows of matrix 𝐵𝐻 (standardized historical data in logarithm). From the correlation of historical data between different months, which is the correlation of the columns of the matrix 𝐵𝐻 (𝛽 = 𝑐𝑜𝑟𝑟(𝐵𝐻)), an upper triangular matrix 𝛼 (𝛽 = 𝛼𝛼𝑇) is generated from the Cholesky decomposition.
Reservoir Cascade Operation Policy Optimization
The diversion of water to Polgolla (D1 (𝑡)) is limited by the physical capacity (𝑉) of the tunnel that can transfer the maximum amount of water each month. The water allocation rules of the other six points for different agricultural systems are specified as a function of time according to the irrigation water demand of the agricultural systems.
Multiple Objectives in Optimization
- Hydropower Energy
- Agricultural Yield
- Formulating Objectives in Optimization
- Multi-Objective Evolutionary Algorithm
The simulation model calculates the yield for a predetermined land area taking into account the satisfaction of the water demand from the irrigation water supply. We perform optimization for two formulations of the performance criteria for 1000 years (N), 6 power plants (K) and 21 agricultural systems (L).
Results
For example, for the point on the Pareto front indicated by the red circled blue dot in Figure 4.5(a), there would be a 1.8% increase in hydropower production and a 3.4% increase. For example, the rule curves for the point on the Pareto front indicated by the red circled blue dot in Figure 4.5 (a) are indicated by the “selected rules” in Figure 4.5 (b-e).
Discussion
Water managers can choose the solution from Pareto optimal solutions that show trade-offs between objectives. Therefore, Sri Lanka's water managers are looking to add new infrastructure for managing water resources.
Introduction
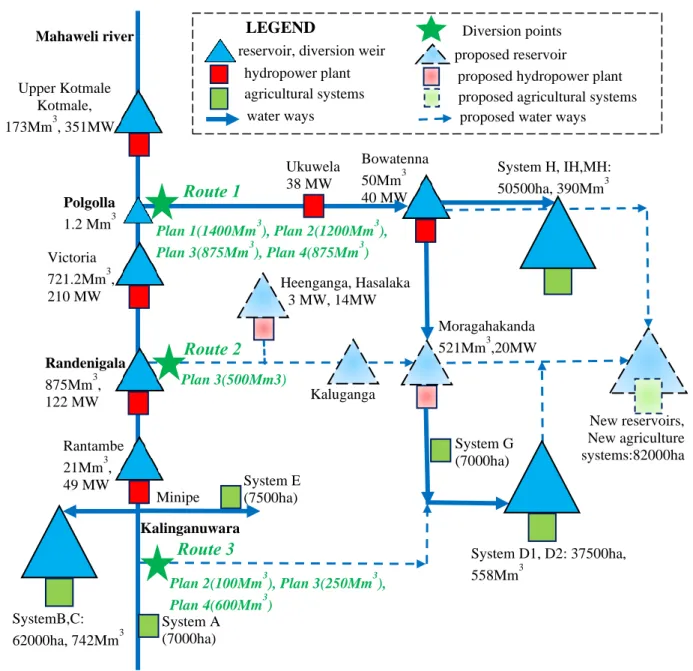
5 Decision Analysis for the Expansion of the Mahaweli Multipurpose Reservoir System in Sri Lanka. The current infrastructure of the project is capable of managing 2400 Mm3 of water in the basin while the upgraded Mahaweli water resource management project with the new infrastructure will increase its capacity to 4000 Mm3 (Ministry of Irrigation and Water Resources Management, 2013a, 2014).
Multicriteria Decision Analysis (MCDA) Method
MAVT with Multiple Decision Makers
In these equations, 𝑖 - 1,.,I refers to the alternative index, 𝑗 - 1, …, J is the criterion index, 𝑘 - 1,…, K is the index representing each DM, E is the criterion evaluation matrix where each entry, 𝑒(𝑖, 𝑗), the performance of plan 𝑖 by measure 𝑗 (standardized), C is the DM's preference matrix in which each entry, 𝑐(𝑗, 𝑘), calculates how important attribute 𝑗 is to DM 𝑘 (tradeoff weights), S is the support plan matrix, 𝑠(𝑖, 𝑘) is the approval rate of DM 𝑘 for plan 𝑖, U is a vector representing the multi-attribute value function of each alternative, 𝑈( 𝑖) is the approval rate of plan 𝑖 by all decision makers. The simplicity and transparency of the cardinal weighting method provides a means for communication and negotiation and for the inclusion of different perspectives in the selection of criteria and value functions (De Montis, Toro, Droste-Franke, Omann, & Stagl, 2000).
ELECTRE III
In (5.48) and (5.49) 𝑐𝑖𝑖′ is the concordance index, 𝑤𝑗 represents the total weight associated with criteria 𝑔(𝑗), 𝐶𝑆(𝑖𝑖′) contains attributes where 𝑖𝗖′) is least (𝑖) reservation (indifference and strict preference). , 𝐶𝑄(𝑖𝑖′) contains attributes (𝑗) that hesitate between the indifference and the opposite that 𝑖 is at least as good as 𝑖′. The discordance index is a measure of the degree of opposition to the hypothesis that 𝑖 is as good as 𝑖′.
Application of MCDA Method to Case Study
- Alternatives
- Evaluation of Criteria
- Eliciting the Decision Makers’ Preferences (Weights)
- Sensitivity Analysis
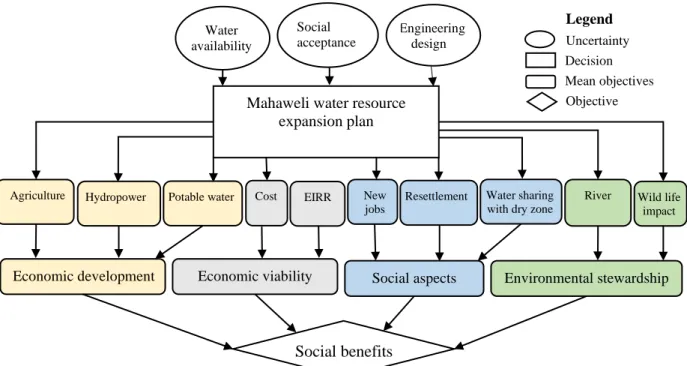
Environmental impacts of the project are measured by natural river flow violations and wildlife disturbance. Economic and environmental aspects of the water resource management projects are two main elements of water policy.
Results
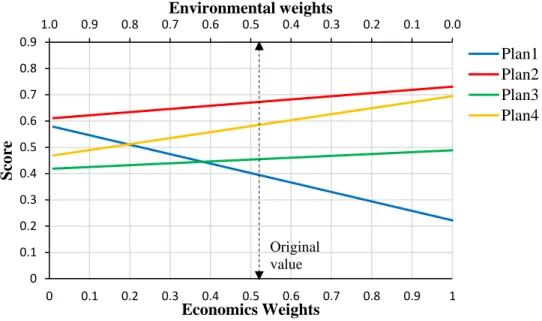
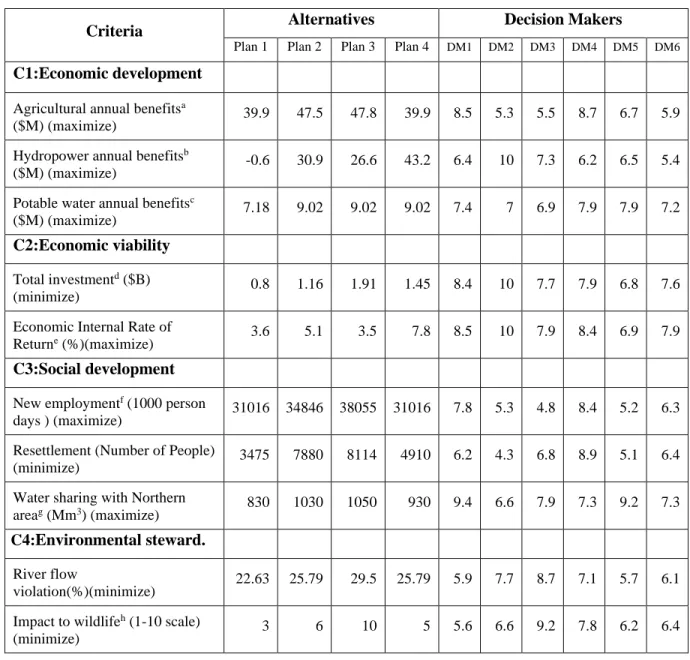
Monte Carlo simulation indicates Plan 2 as the best plan according to six decision makers' weights with both MAVT and ELECTRE III methods. Sensitivity analysis of ranking considering uncertainty of attributes and weight of decision makers in ±20% range.
Discussion
Therefore, common objectives of the project, such as drinking water supply and sharing water with the northern conflict areas in an economically responsible manner, achieve the maximum score values (Table 5.1). Nevertheless, the different weights assigned also showed an appreciation among all stakeholders for the importance of all the criteria taken into account.
Introduction
MCDA has been used for energy production planning in developed countries such as Portugal (Ribeiro, Ferreira, & Araújo, 2013) and other EU countries (Baležentis & Streimikiene, 2017) as well as developing countries Bangladesh (Rahman, Paatero , Lahdelma, & Wahid , 2016) and Mexico (Martinez, Lambert and . Karvetski, 2011). In addition, MCDA has been used to incorporate social concerns into energy production planning decisions (P. Ferreira, M. Ara´ujo, 2010).
Background
Methods
Identification of Alternatives
Power capacity contribution from variable renewable energy (VRE) sources (wind, solar, small hydro, and biomass) is not considered. Power capacity is planned with conventional thermal power station options and both large hydropower and VRE power station options.
Development of Possible Pathways
- Candidate Power Plants to Develop Energy Pathways
- Pathway Optimization
- Identify the Criteria and Attributes and Measure the Performance of Attributes
- Evaluation of Pathways
- ELECTRE III
- Value Path and Weight Tradeoff
- Sensitivity Analysis
The plan's risk-benefit ratio (RBR) is calculated as the risk of exposure of the cost exceeding its expected value, divided by the benefit of the plan costing less than the expected value (Tennessee Valley Authority, 2015). A value path is a graphical representation of the paths' performance across the attributes (B. Hobbs & Meier, 2000).
Results
We use a uniform distribution of decision maker weights around ±20% and a uniform distribution of attribute performance around ±5% to study the sensitivity of trajectory rankings to the uncertainty in the attributes. The ranking of the preferred choice for each decision maker is robust under uncertainty in the decision weights (Figure 6.6 (i)).
Discussion
Large capacity machines (large) with large capacity reservoirs serve roles as peak, spin reserve and frequency control of the power system while power plants with small reservoirs (Run-of-River) provide for energy needs of the power system. Ministry of Irrigation and Water Resources Management (2014) shows this to be equivalent to 30% of the total cost of water supply.
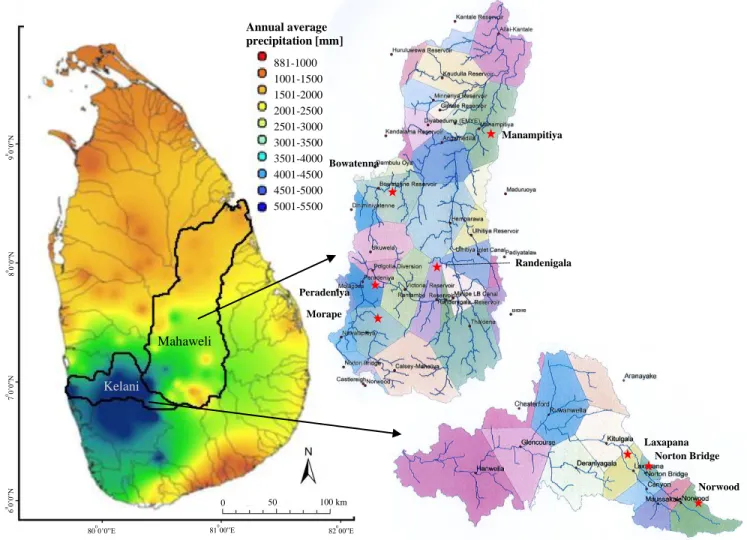
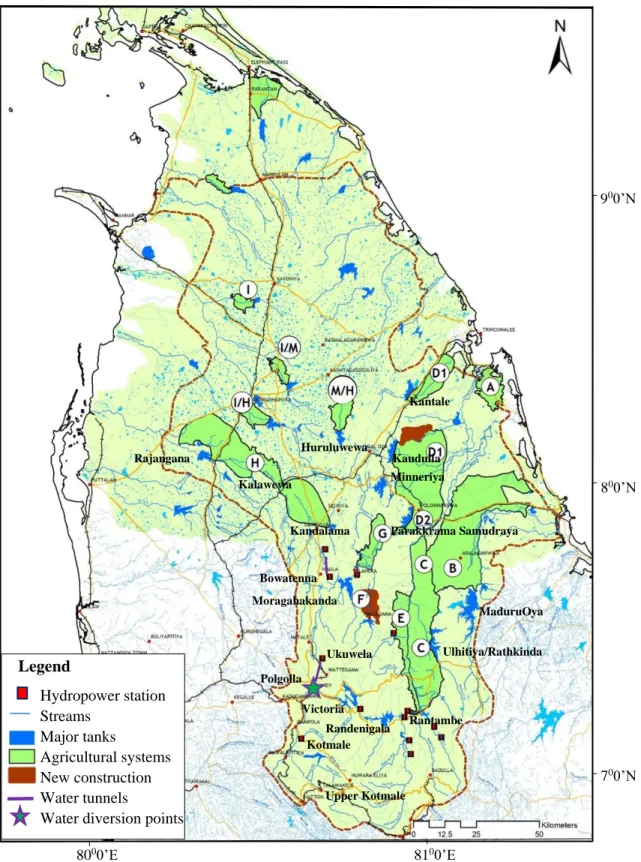
Mahaweli and Kelani river basins of Sri Lanka
Sub basin Rainfall for (a) Morape (b) Peradeniya (c) Randenigala (d) Bowatenna
Linear regression of rainfall anomaly on MEI and DMI. High values of MEI and
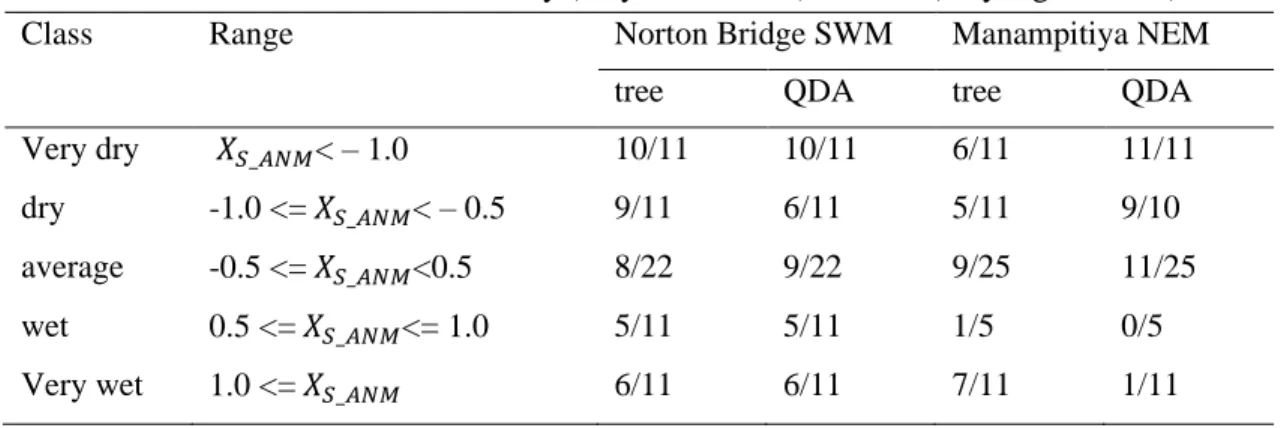
Norton Bridge and Manampitiya rainfall classes (dry, average, wet) identified
Classification tree for Norton Bridge SWM rainfall using two categories (dry
Mahaweli multipurpose project reservoirs, stream network and irrigated
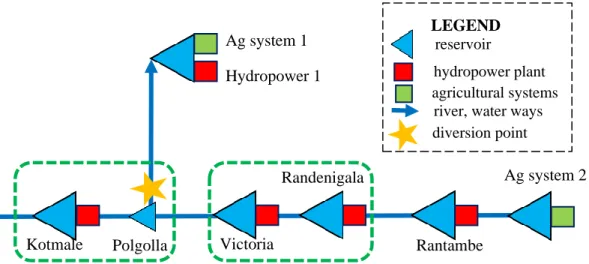
Schematic diagram of Mahaweli multipurpose water resources project
Schematic diagram of Mahaweli hydropower plants and agriculture systems B,
Crop water duty cycle for system B&C, D1, H for two agriculture seasons ‘Yala’
Reservoir operation simulation
Hydropower plant simulation
Agriculture system simulation
Irrigation water distribution decision
Random forest model results. Highlighted cells indicate where there may be
Random forest model results
Agriculture benefits from the project (Ministry of Irrigation and Water
New employment (Ministry of Irrigation and Water Resources Management
Concordance indices
Discordance indices
Credibility indices
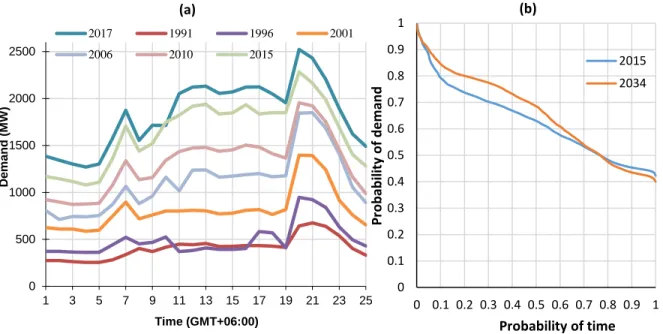
Demand forecasts prepared considering base assumptions of social and
Streamflow and rainfall predictability based on ENSO for water resources management in Sri Lanka. Enhancing energy diversification by introducing liquefied natural gas power generation option in Sri Lanka.
Existing thermal power plant data and fuel data
Emissions of fossil fuel burning from existing thermal power plants
Energy and capacity of total hydropower plants according to variability of
Candidate thermal power plant data and fuel data
Emissions of fossil fuel burning from candidate thermal power plants
New jobs, land requirement, social acceptance calculation
Evaluation matrix, comparison with Reference case