8/2/23, 4:49 PM Editorial Team | MATRIK : Jurnal Manajemen, Teknik Informatika dan Rekayasa Komputer
https://journal.universitasbumigora.ac.id/index.php/matrik/navigationMenu/view/editorialTeam 1/5
Search
HOME PEOPLE ISSUES JOINT AS
dadang 0
Editorial Team
Editor in Chief
Lalu Ganda Rady Putra, Universitas Bumigora, Indonesia Google Scholar | SINTA ID : 6707978 |SCOPUS ID:
Editor
Anthony Anggrawan, Universitas Bumigora, Indonesia
Google Scholar | SINAT ID: 6114236 | SCOPUS ID: 57194213003
Hairani, Universitas Bumigora, Indonesia
Google Scholar | SINTA ID: 6100285 | SCOPUS ID: 57222080524 |Publon: 4183103
Managing Editor
Khairan Marzuki, Universitas Bumigora , Indonesia
Google Scholar |GARUDA ID: 1568552|SINTA ID: 6680270|SCOPUS: 57280266600
Associate Editors
Irwan Oyong, Universitas AMIKOM Yogyakarta, Indonesia
Google Scholar |ORCID ID: 0000-0001-6365-0826 |SCOPUS ID: 57200211469 | SINTA ID: 6721323
Choerun Asnawi, Universitas Jendral Ahmat Yani Yogyakarta, Indonesia Google Scholar | SINTA ID : 5981941 | SCOPUS ID:
Didi Haryono, Institut Bisnis dan Keuangan Nitro, Makassar, Indonesia
Google Scholar |ORCID ID: 0000-0001-8957-2336 | SINTA ID: 5985592 | SCOPUS ID: 57216611534
Andi Sunyoto ,Universitas AMIKOM, Yogyakarta, Indonesia
Google Scholar | SCOPUS ID: 57202197381 | SINTA ID: 6008849 | WoS Clarivate : 501895
Hengki Tamando Sihotang, Institute of Computer Science, Medan, Indonesia Google Scholar | SINTA ID: 6154823| SCOPUS ID: 57211266124
Regional Editor Africa, Australia, New Zealand -
Regional Editor Asia
Che Ku Nuraini, Universiti Teknikal Malaysia Melaka, Malaysia GoogleScholar | SCOPUS ID: 35759291800 |ORCID ID: 9823-5315
Regional Editor Europe
Gerhard-Wilhelm Weber, Poznan University of Technology, Poland
Google Scholar |ORCID ID: 0000-0003-0849-7771 | SCOPUS ID: 55634220900
8/2/23, 4:49 PM Editorial Team | MATRIK : Jurnal Manajemen, Teknik Informatika dan Rekayasa Komputer
https://journal.universitasbumigora.ac.id/index.php/matrik/navigationMenu/view/editorialTeam 2/5
Abdellah Salhi, University of Essex, United Kingdom Google Scholar |SCOPUS ID: 8857392100
Regional Editor North and South America
-
Editorial Board
Anton Abdulbasah Kamil, Nisantasi University, Turkey ORCID ID: 0000-0001-5410-812X |SCOPUS ID: 24481107300
Helna Wardhana, Universitas Bumigora, Mataram, Indonesia Google Scholar | SINTA ID: 6070603 | SCOPUS ID: 57205488284
Siti Soraya,Universitas Bumigora, Mataram, Indonesia
Google Scholar | SINTA ID: 5994189 | SCOPUS ID: 57209226434
Sirojul Hadi, Universitas Bumigora, Mataram, Indonesia Google Scholar | SINTA ID: 6708110 | SCOPUS ID: 57207596263
Muhammad Zul kri, Universitas Bumigora, Indonesia
Google Scholar | SINAT ID : 6719678 |SCOPUS ID : 57222187881| Publon : 4174051
Language Editor
Diah Supatmiwati, SINTA ID: 5994570 | SCOPUS ID: 57211635097
Zainudin Abdussamad, SINTA ID: 6163190 | SCOPUS ID:
Technical Support Sulistianti Dinda Lesta
Quick Menu
History
Focus and Scope Plagiarism Policy Open Access Policy Contacts
Copyright Notice Author Guidelines Publication Charge Publication Ethics Peer Review Process Visitor Matrik
Abstracting and Indexing
8/2/23, 4:48 PM MATRIK : Jurnal Manajemen, Teknik Informatika dan Rekayasa Komputer
https://journal.universitasbumigora.ac.id/index.php/matrik/index 1/6
Search
HOME PEOPLE ISSUES JOINT AS
dadang 0
Matrik : Jurnal Manajemen, Teknik Informatika, dan Rekayasa Komputer is peer-reviewed journal dedicated to interchange for the results of high quality research in all aspect of science, engineering and information technology. The journal publishes state-of-art papers in fundamental theory, experiments and simulation, as well as applications, with a systematic proposed method, su cient review on previous works, expanded discussion and concise conclusion. Matrik follows the open access policy that allows the published articles freely available online without any subscription. Manuscripts can be submitted at any time, with noti cation within 1 - 2 weeks. Please email: [email protected] for a faster response. Click here for Online Submission. MATRIK Journal is published 3 times in 1 year, namely November, March and July.
CURRENT ISSUE
Vol 22 No 3 (2023)
DOI: https://doi.org/10.30812/matrik.v22i3 PUBLISHED: 2023-07-31
Drowsiness Detection Based on Yawning Using Modi ed Pre-trained Model MobileNetV2 and ResNet50
Abstract Viewed : 6 | pdf Download : 27 | DOI https://doi.org/10.30812/matrik.v22i3.2785
Comparison of Machine Learning Methods for Classifying User Satisfaction Opinions of the PeduliLindungi Application
Abstract Viewed : 13 | pdf Download : 9 | DOI https://doi.org/10.30812/matrik.v22i3.2860 ARTICLES
Hepatika Zidny Ilmadina, Muhammad Naufal, Dega Surono Wibowo 419-430
?
Putu Tisna Putra, Anthony Anggrawan, Hairani Hairani 431-442
8/2/23, 4:48 PM MATRIK : Jurnal Manajemen, Teknik Informatika dan Rekayasa Komputer
https://journal.universitasbumigora.ac.id/index.php/matrik/index 2/6
Automation Reporting Bed Ef ciency Using Veri cation and Validation Method
Abstract Viewed : 5 | pdf Download : 3 | DOI https://doi.org/10.30812/matrik.v22i3.2823
Automated Detection of Breast Cancer Histopathology Image Using Convolutional Neural Network and Transfer Learning
Abstract Viewed : 7 | pdf Download : 2 | DOI https://doi.org/10.30812/matrik.v22i3.2803
Detecting Vehicle Numbers Using Google Lens-Based ESP32CAM to Read Number Characters
Abstract Viewed : 1 | pdf Download : 0 | DOI https://doi.org/10.30812/matrik.v22i3.2818
OWASP Framework-based Network Forensics to Analyze the SQLi Attacks on Web Servers
Abstract Viewed : 1 | pdf Download : 2 | DOI https://doi.org/10.30812/matrik.v22i3.3018
Hate Speech Detection for Banjarese Languages on Instagram Using Machine Learning Methods
Abstract Viewed : 14 | pdf Download : 1 | DOI https://doi.org/10.30812/matrik.v22i3.2939
Optimizing the Amount of Production using Hybrid Fuzzy Logic and Cencus II
Abstract Viewed : 1 | pdf Download : 1 | DOI https://doi.org/10.30812/matrik.v22i3.2938
Evading Antivirus Software Detection Using Python and PowerShell Obfuscation Framework
Abstract Viewed : 1 | pdf Download : 0 | DOI https://doi.org/10.30812/matrik.v22i3.3088
?
Iis Gugum Gumilar, Yuda Syahidin, Erix Gunawan, Jeri Sukmawijaya 443-454
?
Didih Rizki Chandranegara, Faras Haidar Pratama, Sidiq Fajrianur, Moch Rizky Eka Putra, Zamah Sari
455-468
?
Tukino Paryono, Ahmad Fauzi, Rizki Aulia Nanda, Saepul Aripiyanto, Muhammad Khaerudin 469-480
?
Imam Riadi, Abdul Fadlil, Muhammad Amirul Mu'min 481-494
?
Muhammad Alka , Muhammad Afrizal Miqdad, Muhammad Fachrurrazi, Muhammad Nur Abdi, Ahmad Zainul Abidin, Raisa Amalia
495-504
?
Susana Limanto, vincentius Riandaru Prasetyo, Mirella Merci a 505-518
?
Umar Aditiawarman, Al an Dody, Teddy Mantoro, Haris Maarif, Anggy Pradiftha 519-528
8/2/23, 4:48 PM MATRIK : Jurnal Manajemen, Teknik Informatika dan Rekayasa Komputer
https://journal.universitasbumigora.ac.id/index.php/matrik/index 3/6
Incorporating User Experience Evaluation into Application Design for Optimal Usability
Abstract Viewed : 2 | pdf Download : 0 | DOI https://doi.org/10.30812/matrik.v22i3.2793
Comparison Of Support Vector Machine Performance with Oversampling and Outlier Handling in Diabetic Disease Detection Classi cation
Abstract Viewed : 7 | pdf Download : 3 | DOI https://doi.org/10.30812/matrik.v22i3.2979
Image Processing Using Morphology on Support Vector Machine Classi cation Model for Waste Image
Abstract Viewed : 2 | pdf Download : 2 | DOI https://doi.org/10.30812/matrik.v22i3.2819
E-Mortality using Agile Scrum Method to Improve Information Services Effectiveness.
Abstract Viewed : 4 | pdf Download : 2 | DOI https://doi.org/10.30812/matrik.v22i3.2830
Data Mining Earthquake Prediction with Multivariate Adaptive Regression Splines and Peak Ground Acceleration
Abstract Viewed : 7 | pdf Download : 5 | DOI https://doi.org/10.30812/matrik.v22i3.3061
K Value Effect on Accuracy Using the K-NN for Heart Failure Dataset
Abstract Viewed : 2 | pdf Download : 3 | DOI https://doi.org/10.30812/matrik.v22i3.2984
Social Media Engagement and Student’s Intention in Indonesian Higher Education Using Uni ed Theory of Acceptance and Use of Technology
Abstract Viewed : 1 | pdf Download : 0 | DOI https://doi.org/10.30812/matrik.v22i3.3019
?
Helen Sastypratiwi, Yulianti Yulianti, Ha z Muhardi, Desepta Isna Ulumi 529-538
?
Firda Yunita Sari, Maharani sukma Kuntari, Hani Khaulasari, Winda Ari Yati 539-552
?
Miftahuddin Fahmi, Anton Yudhana, Sunardi Sunardi 553-566
?
Ardafa Ihromi, Yuda Syahidin, Erix Gunawan, Neneng Yuniarty 567-582
?
Dadang Priyanto, Bambang Krismono Triwijoyo, Deny Jollyta, Hairani Hairani, Ni Gusti Ayu Dasriani
583-592
?
Alya Masitha, Muhammad Kunta Biddinika, Herman Herman 593-604
?
Matrissya Hermita, Budi Hermana, Suryadi Harmanto, Adang Suhendra, Munawir Pasaribu 605-614
8/2/23, 4:48 PM MATRIK : Jurnal Manajemen, Teknik Informatika dan Rekayasa Komputer
https://journal.universitasbumigora.ac.id/index.php/matrik/index 4/6
Quick Menu History
Focus and Scope Plagiarism Policy Open Access Policy Contacts
Copyright Notice Author Guidelines Publication Charge Publication Ethics Peer Review Process Visitor Matrik
Abstracting and Indexing Statement of the Letter
Tools
Digital Forensic Analysis of WhatsApp Business Applications on Android-Based Smartphones Using NIST
Abstract Viewed : 16 | pdf Download : 2 | DOI https://doi.org/10.30812/matrik.v22i3.3033
Performance Prediction of Airport Traf c Using LSTM and CNN-LSTM Models
Abstract Viewed : 6 | pdf Download : 2 | DOI https://doi.org/10.30812/matrik.v22i3.3032
IoT-based Integrated System Portable Prayer Mat and DailyWorship Monitoring System
Abstract Viewed : 3 | pdf Download : 1 | DOI https://doi.org/10.30812/matrik.v22i3.3058
Forensic Analysis of Body Shaming Cases on the IMO Messenger Aplication using the Association of Chief Police Of cers Framework
Abstract Viewed : 6 | pdf Download : 1 | DOI https://doi.org/10.30812/matrik.v22i3.2987
?
William Barkem, Jeckson Sidabutar 615-626
?
Willy Riyadi, Jasmir Jasmir 627-638
?
Luh Kesuma Wardhani, Nenny Anggraini, Nashrul Hakiem, M. Tabah Rosyadi, Amin Rois 639-650
?
Yana Sa tri, Imam Riadi, Sunardi Sunardi 651-664
?
VIEW ALL ISSUES
8/2/23, 4:48 PM MATRIK : Jurnal Manajemen, Teknik Informatika dan Rekayasa Komputer
https://journal.universitasbumigora.ac.id/index.php/matrik/index 5/6
Abstracting and Indexing
Scopus Citedness
Contact Support
Supervised
KEYWORDS
8/2/23, 4:48 PM MATRIK : Jurnal Manajemen, Teknik Informatika dan Rekayasa Komputer
https://journal.universitasbumigora.ac.id/index.php/matrik/index 6/6
Mach
ine Le
arnin g
And roid
Cl ass ifi
ca tio n
W eb si te K-Mean
Klasifikasi s Support Vector Machine
R A D
Pr ed ic ti on
In fo rm asi
OS PF
Fu zz y C -M
ea ns
Prox mox Monitoring
C O V ID -1 9
Pre dik si UT AU T Fir ew all
SVM w at er fa ll
SMS
EIG RP
P H P M yS Q L
P ac ke t T ra ce r
im ag e fuzzy
GPS
Aku rasi on lin e
AHP
Io T
Web
Google Scholar Citation : Journal MATRIK
All Since 2018
Citations 2089 2077
h-index 20 20
i10-index 60 59
Journal MATRIK ><
Publisher:
LPPM Universitas Bumigora
Jl. Ismail Marzuki-Cilinaya-Cakranegara-Mataram 83127 Indonesia
Phone: +6285-933-083-240
e-mail: [email protected]
View Matrik Stats
8/2/23, 4:51 PM Data Mining Earthquake Prediction with Multivariate Adaptive Regression Splines and Peak Ground Acceleration | MATRIK : Jurnal Manajemen, Teknik Informatika dan Rekayasa Komputer
https://journal.universitasbumigora.ac.id/index.php/matrik/article/view/3061 1/7
Search
HOME PEOPLE ISSUES JOINT AS
dadang 0
HOME ARCHIVES VOL 22 NO 3 (2023) Articles
Data Mining Earthquake Prediction with Multivariate Adaptive Regression Splines and Peak Ground
Acceleration
Dadang Priyanto Universitas Bumigora
Bambang Krismono Triwijoyo Universitas Bumigora
Deny Jollyta
Institut Bisnis Dan Teknologi Pelita Indonesia Hairani Hairani
Universitas Bumigora Ni Gusti Ayu Dasriani
Universitas Bumigora, Mataram, Indonesia
DOI: https://doi.org/10.30812/matrik.v22i3.3061 KEYWORDS:Earthquake hazard prediction, Function
base, Predictor variable, Peak ground acceleration, Nonparametric regression
ABSTRACT
Earthquake research has not yielded promising results because earthquakes have uncertain data parameters, and one of the methods to overcome the problem of uncertain parameters is the nonparametric method, namely Multivariate Adaptive Regression Splines (MARS).
Sumbawa Island is part of the territory of Indonesia and is in the position of three active earth plates, so Sumbawa is prone to earthquake hazards. Therefore, this research is important to do. This study aimed to analyze earthquake hazard prediction on the island of Sumbawa by using the nonparametric MARS and Peak Ground Acceleration (PGA) methods to determine the risk of earthquake hazards. The method used in this study was MARS, which has two completed stages: Forward Stepwise and Backward Stepwise. The results of this study were based on testing and parameter analysis obtained a Mathematical model with 11 basis functions (BF) that contribute to the response variable, namely (BF) 1,2,3,4,5,7,9,11, and the basis functions do not contribute 6, 8, and 10. The predictor variables with the greatest in uence were 100% Epicenter Distance and 73.8%
Magnitude. The conclusion of this study is based on the
PUBLISHED 2023-07-24
HOW TO CITE
Priyanto, D., Triwijoyo, B., Jollyta, D., Hairani, H., & Dasriani, N.
(2023). Data Mining Earthquake Prediction with Multivariate Adaptive Regression Splines and Peak Ground Acceleration.
MATRIK : Jurnal Manajemen, Teknik Informatika Dan Rekayasa Komputer, 22(3), 583-592.
https://doi.org/https://doi.org/10.30 812/matrik.v22i3.3061
ISSUE
Vol 22 No 3 (2023) SECTION
/ / /
More Citation Formats
8/2/23, 4:51 PM Data Mining Earthquake Prediction with Multivariate Adaptive Regression Splines and Peak Ground Acceleration | MATRIK : Jurnal Manajemen, Teknik Informatika dan Rekayasa Komputer
https://journal.universitasbumigora.ac.id/index.php/matrik/article/view/3061 2/7
highest PGA values in the areas most prone to earthquake hazards in Sumbawa, namely Mapin Kebak, Mapin Rea, Pulau Panjang, and Pulau Saringi.
DOWNLOADS
Download data is not yet available.
REFERENCES
[1] R. Kumar, “Data Mining Techniques for Weather Forecasting,” The Visual Computer, vol. 15, no. 5, pp. 56–
63, 2023.
[2] O. A. Montesinos L´opez, A. Montesinos L´opez, and J.
Crossa, Multivariate Statistical Machine Learning Methods for Genomic
Prediction. Cham: Springer International Publishing, 2022, no. March.
[3] P. Dubey, “Analysis of Clustering-Algorithms for E cient Data Mining,” no. April, 2023.
[4] A. O¨ zmen, “Multi-objective regression modeling for natural gas prediction with ridge regression and CMARS,”
International
Journal of Optimization and Control: Theories and Applications, vol. 12, no. 1, pp. 56–65, 2022.
[5] A. O¨ zmen, G. W. Weber, and I. Batmaz, “The new Robust CMARS (RCMARS) method,” in 24th Mini EURO Conference on
Continuous Optimization and Information-Based Technologies in the Financial Sector, MEC EurOPT 2010, no. June, 2010, pp.
362–368.
[6] J. Zhen, F. J. de Ruiter, E. Roos, and D. den Hertog,
“Robust Optimization for Models with Uncertain Second- Order Cone and
Semide nite Programming Constraints,” INFORMS Journal on Computing, vol. 34, no. 1, pp. 196–216, 2022.
[7] K. M. Asim, A. Idris, T. Iqbal, and F. Mart´ınez-A´ lvarez,
“Earthquake prediction model using support vector regressor and
hybrid neural networks,” PLOS ONE, vol. 13, no. 7, pp. 1–
22, jul 2018.
[8] T. A. Adagunodo, S. L¨uning, A. M. Adeleke, J. O.
Omidiora, A. P. Aizebeokhai, K. D. Oyeyemi, and O. S.
Hammed, “Evaluation
of 0 M 8 earthquake data sets in African Asian region during 19662015,” Data in Brief, vol. 17, no. April, pp. 588–
603, apr 2019.
[9] B. Sadhukhan, S. Chakraborty, S. Mukherjee, and R. K.
Samanta, “Climatic and seismic data-driven deep learning model for
earthquake magnitude prediction,” Frontiers in Earth Science, vol. 11, no. February, pp. 1–24, feb 2023.
[10] X. Zhang, W. ReichardFlynn, M. Zhang, M. Hirn, and Y. Lin, “Spatiotemporal Graph Convolutional Networks for Earthquake
Source Characterization,” Journal of Geophysical Research: Solid Earth, vol. 127, no. 11, nov 2022.
[11] M. N. Shodiq, D. H. Kusuma, M. G. Rifqi, A. R.
Barakbah, and T. Harsono, “Neural network for earthquake prediction based
on automatic clustering in indonesia,” International Journal on Informatics Visualization, vol. 2, no. 1, pp. 37–
43, 2018.
[12] R. Zakaria, A. N. Jifrin, S. N. Jaman, and R. Roslee,
“Fuzzy Interpolation Curve Modelling of Earthquake Magnitude Data,”
IOP Conference Series: Earth and Environmental Science, vol. 1103, no. 1, pp. 1–12, nov 2022.
[13] X. Jianjun, Y. Bingjie, and W. Rongji, “Study on China’s Earthquake Prediction by Mathematical Analysis and its
Articles
This work is licensed under a Creative Commons Attribution-ShareAlike 4.0 International License.
8/2/23, 4:51 PM Data Mining Earthquake Prediction with Multivariate Adaptive Regression Splines and Peak Ground Acceleration | MATRIK : Jurnal Manajemen, Teknik Informatika dan Rekayasa Komputer
https://journal.universitasbumigora.ac.id/index.php/matrik/article/view/3061 3/7
Application
in Catastrophe Insurance,” IOP Conference Series: Earth and Environmental Science, vol. 128, no. 1, pp. 1–7, mar 2019.
[14] J. Fayaz, Y. Xiang, and F. Zareian, “Generalized ground motion prediction model using hybrid recurrent neural network,”
Earthquake Engineering and Structural Dynamics, vol. 50, no. 6, pp. 1539–1561, 2021.
[15] D.-C. Feng, X.-Y. Cao, D. Wang, and G. Wu, “A PDEM- based non-parametric seismic fragility assessment method for RC
structures under non-stationary ground motions,” Journal of Building Engineering, vol. 63, no. January, pp. 1–17, jan 2023.
[16] G. Zheng, P. Yang, H. Zhou, C. Zeng, X. Yang, X. He, and X. Yu, “Evaluation of the earthquake induced uplift
displacement of
tunnels using multivariate adaptive regression splines,”
Computers and Geotechnics, vol. 113, p. 103099, sep 2019.
[17] D. Priyanto, M. Zarlis, H. Mawengkang, and S. Efendi,
“Analysis of earthquake hazards prediction with multivariate adaptive
regression splines,” International Journal of Electrical and Computer Engineering, vol. 12, no. 3, pp. 2885–2893, 2022.
[18] C. K. Arthur, V. A. Temeng, and Y. Y. Ziggah,
“Multivariate Adaptive Regression Splines (MARS) approach to blast-induced
ground vibration prediction,” International Journal of Mining, Reclamation and Environment, vol. 34, no. 3, pp.
198–222, 2020.
[19] S. D. Prihastuti Yasmirullah, B. W. Otok, J. D. Trijoyo Purnomo, and D. D. Prastyo, “Modi cation of Multivariate Adaptive
Regression Spline (MARS),” Journal of Physics: Conference Series, vol. 1863, no. 1, pp. 1–12, mar 2021.
[20] D. Pan, A. Zeng, L. Jia, Y. Huang, T. Frizzell, and X.
Song, “Early Detection of Alzheimer’s Disease Using Magnetic Resonance
Imaging: A Novel Approach Combining Convolutional Neural Networks and Ensemble Learning,” Frontiers in Neuroscience,
vol. 14, no. May, pp. 1–19, may 2020.
[21] F. Ferraccioli, L. M. Sangalli, and L. Finos,
“Nonparametric tests for semiparametric regression models,” TEST, no. June, pp.
1–25, jun 2023.
[22] D. Priyanto, M. Zarlis, H. Mawengkang, and S. Efendi,
“Alternative approach to seismic hazards prediction using non parametric
adaptive regression method,” Journal of Theoretical and Applied Information Technology, vol. 98, no. 21, pp. 3425–
3435, 2020.
[23] S. Xiang and W. Yao, “Nonparametric statistical learning based on modal regression,” Journal of Computational and Applied
Mathematics, vol. 409, no. January, pp. 1–15, aug 2022.
[24] E. Koken, “Yatay Milli Krclarda Krma Kapasitesinin Regresyon, Yapay Sinir Alar ve C¸ ok Deikenli Uyarlamal Regresyon
Analizi Kullanlarak Modellenmesi,” Afyon Kocatepe University Journal of Sciences and Engineering, vol. 22, no. 5, pp. 1193–
1203, 2022.
[25] A. Arafa, N. El-Fishawy, M. Badawy, and M. Radad,
“RN-SMOTE: Reduced Noise SMOTE based on DBSCAN for enhancing
imbalanced data classi cation,” Journal of King Saud University - Computer and Information Sciences, vol. 34, no. 8, pp.
5059–5074, sep 2022.
[26] M. Rajif and S. Syafriani, “Hazard Seismic Zonation Analysis Of West Sumatra Region Using Probabilistic
8/2/23, 4:51 PM Data Mining Earthquake Prediction with Multivariate Adaptive Regression Splines and Peak Ground Acceleration | MATRIK : Jurnal Manajemen, Teknik Informatika dan Rekayasa Komputer
https://journal.universitasbumigora.ac.id/index.php/matrik/article/view/3061 4/7
Hazard Seismic
Analysis (Phsa) Method,” Pillar or Physics, vol. 14, no. 1, pp. 8–17, jul 2021.
[27] A. Akinci, I. Munaf`o, and L. Malagnini, “S-Wave Attenuation Variation and its Impact on Ground Motion Amplitudes During
20162017 Central Italy Earthquake Sequence,” Frontiers in Earth Science, vol. 10, no. July, pp. 2011–2015, 2022.
[28] W. Haryadi, “Gempa Tektonik Di Pulau Sumbawa Dan Dampaknya Terhadap Bangunan Sipil (Suatu Kajian Geologis),” Ganec
Swara, vol. 6, no. 2, pp. 13–19, 2012.
[29] A. Sabtaji, “Statistics of Tectonic Earthquake Events Each Proovince in Indonesia Territory for 11 Years of Observation (2009-
2019),” Buletin Meteorologi, Klimatologi, dan Geo sika, vol. 1, no. 7, pp. 31–46, 2020.
[30] A. C. Hidajah, F. Febriyanti, and D. R. Faisal, “Faktor Risiko KLB Keracunan Makanan Pasca Gempa Bumi di Kabupaten
Sumbawa,” Jurnal Kesehatan, vol. 14, no. 2, pp. 65–70, 2021.
Most read articles by the same author(s)
Bambang Krismono Triwijoyo, Model Fast Tansfer Learning pada Jaringan Syaraf Tiruan
Konvolusional untuk Klasi kasi Gender Berdasarkan Citra Wajah , MATRIK : Jurnal Manajemen, Teknik Informatika dan Rekayasa Komputer: Vol 18 No 2 (2019)
Donny Kurniawan, Anthony Anggrawan, Hairani Hairani, Graduation Prediction System on Students Using C4.5 Algorithm , MATRIK : Jurnal Manajemen, Teknik Informatika dan Rekayasa Komputer: Vol 19 No 2 (2020)
Abdurraghib Segaf Suweleh, Dyah Susilowati, Hairani Hairani, Aplikasi Penentuan Penerima Beasiswa Menggunakan Algoritma C4.5 , Jurnal Bumigora Information Technology (BITe): Vol 2 No 1 (2020)
Muhammad Innuddin, Hairani Hairani, Rifqi Hammad, Pahrul Irfan, Kurniadin Abd. Latif, Pelatihan Pembuatan Media Pembelajaran Bagi Guru MI NW Darussholohin Kalijaga dalam Rangka Meningkatkan Mutu Pembelajaran , ADMA : Jurnal Pengabdian dan Pemberdayaan Masyarakat: Vol 1 No 2 (2021): ADMA: Jurnal Pengabdian dan Pemberdayaan Masyarakat
Ahmat Adil, Bambang Krismono Triwijoyo, Sistem Informasi Geogra s Pemetaan Jaringan Irigasi dan Embung di Lombok Tengah , MATRIK : Jurnal Manajemen, Teknik Informatika dan Rekayasa Komputer: Vol 20 No 2 (2021)
Bhintang Dirgantara, Hairani Hairani, Sistem Pakar Diagnosa Penyakit THT Menggunakan Inferensi Forward Chaining dan Metode Certainty Factor , Jurnal Bumigora Information Technology (BITe): Vol 3 No 1 (2021): Juni 2021
Dyah Susilowati, Hairani Hairani, Indah Puji Lestari, Khairan Marzuki, Lalu Zazuli Azhar Mardedi, Segmentasi Lokasi Promosi Penerimaan Mahasiswa Baru Menggunakan Metode RFM dan K-Means Clustering , MATRIK : Jurnal Manajemen, Teknik Informatika dan Rekayasa Komputer: Vol 21 No 2 (2022)
Zilullah Nazir Hadi, Dyah Susilowati, Hairani Hairani, Muhammad Innuddin, Implementasi Metode Certainty Factor pada Sistem Pakar Bimbingan Konseling Siswa Bermasalah , Jurnal Bumigora Information Technology (BITe): Vol 3 No 2 (2021)
Muhammad Innuddin, Dedy Febry Rahman, Hairani Hairani, Andi Sofyan Anas, Hasbullah Hasbullah, Sosialisasi Internet Sehat, Cerdas, Kreatif dan Produktif di Era Pandemi COVID 19 pada MA NW Tanak Maik Masbagek , ADMA : Jurnal Pengabdian dan Pemberdayaan
Masyarakat: Vol 2 No 2 (2022)
Anthony Anggrawan, Hairani Hairani, M. Ade Candra, Prediction of Electricity Usage with Back- propagation Neural Network , International Journal of Engineering and Computer Science Applications (IJECSA): Vol 1 No 1 (2022): March 2022
12 > >>
Quick Menu
History
Focus and Scope
Plagiarism Policy
Open Access Policy
8/2/23, 4:51 PM Data Mining Earthquake Prediction with Multivariate Adaptive Regression Splines and Peak Ground Acceleration | MATRIK : Jurnal Manajemen, Teknik Informatika dan Rekayasa Komputer
https://journal.universitasbumigora.ac.id/index.php/matrik/article/view/3061 5/7
Contacts
Copyright Notice Author Guidelines Publication Charge Publication Ethics Peer Review Process Visitor Matrik
Abstracting and Indexing Statement of the Letter
Tools
Abstracting and Indexing
8/2/23, 4:51 PM Data Mining Earthquake Prediction with Multivariate Adaptive Regression Splines and Peak Ground Acceleration | MATRIK : Jurnal Manajemen, Teknik Informatika dan Rekayasa Komputer
https://journal.universitasbumigora.ac.id/index.php/matrik/article/view/3061 7/7
Publisher:
LPPM Universitas Bumigora
Jl. Ismail Marzuki-Cilinaya-Cakranegara-Mataram 83127 Indonesia
Phone: +6285-933-083-240
e-mail: [email protected]
View Matrik Stats
Matrik: Jurnal Manajemen, Teknik Informatika, dan Rekayasa Komputer Vol. 22, No. 3, July 2023, pp. 583∼592
ISSN: 2476-9843,accredited by Kemenristekdikti, Decree No: 200/M/KPT/2020
DOI: 10.30812/matrik.v22i3.3061 r 583
Data Mining Earthquake Prediction with Multivariate Adaptive Regression Splines and Peak Ground Acceleration
Dadang Priyanto1, Bambang Krismono Triwijoyo1, Denny Jollyta2, Hairani Hairani1, Ni Gusti Ayu Dasriani1
1Universitas Bumigora, Mataram, Indonesia
2Institut Bisnis dan Teknologi Pelita Indonesia , Riau, Indonesia
Article Info Article history:
Received June 11, 2023 Revised June 28, 2023 Accepted July 14, 2023 Keywords:
Earthquake hazard prediction Function base
Predictor variable Peak ground acceleration Nonparametric regression
ABSTRACT
Earthquake research has not yielded promising results because earthquakes have uncertain data param- eters, and one of the methods to overcome the problem of uncertain parameters is the nonparametric method, namely Multivariate Adaptive Regression Splines (MARS). Sumbawa Island is part of the territory of Indonesia and is in the position of three active earth plates, so Sumbawa is prone to earth- quake hazards. Therefore, this research is important to do. This study aimed to analyze earthquake hazard prediction on the island of Sumbawa by using the nonparametric MARS and Peak Ground Acceleration (PGA) methods to determine the risk of earthquake hazards. The method used in this study was MARS, which has two completed stages: Forward Stepwise and Backward Stepwise. The results of this study were based on testing and parameter analysis obtained a Mathematical model with 11 basis functions (BF) that contribute to the response variable, namely (BF) 1,2,3,4,5,7,9,11, and the basis functions do not contribute 6, 8, and 10. The predictor variables with the greatest influence were 100% Epicenter Distance and 73.8% Magnitude. The conclusion of this study is based on the highest PGA values in the areas most prone to earthquake hazards in Sumbawa, namely Mapin Kebak, Mapin Rea, Pulau Panjang, and Pulau Saringi.
Copyright2022 The Authors.c
This is an open access article under theCC BY-SAlicense.
Corresponding Author:
Dadang Priyanto, +62818362756
Faculty of Engineering and Computer Science Study Program, Universitas Bumigora, Mataram, Indonesia,
Email:[email protected]
How to Cite:
Author, ”Data Mining Earthquake Prediction with Multivariate Adaptive Regression Splines and Peak Ground Acceleration”,MA- TRIK: Jurnal Manajemen, Teknik Informatika, dan Rekayasa Komputer, Vol. 22, No. 3, pp. 583-592, Jul, 2023.
This is an open access article under the CC BY-SA license (https://creativecommons.org/licenses/by-sa/4.0/)
Journal homepage:https://journal.universitasbumigora.ac.id/index.php/matrik
584 r ISSN: 2476-9843
1. INTRODUCTION
Earthquakes are natural disasters that can cause minor to severe damage. Many lives and property were lost as a result of the earthquake. Research on earthquakes to date has not provided significant results to determine the causative factors or when the earthquake occurred. Many studies have been carried out, but the problem is that the data related to earthquakes is uncertain and involves big data as a result of recording the accelerograph machine, so an appropriate method is needed to perform predictive analysis based on past data. Research has been carried out using various methods, such as classification and regression methods, Artificial Neural Networks (ANN), Support Vector Regression (SVR), Hybrid Neural Networks (HNN), and others, but these methods use a parametric approach, while earthquake data The earth is uncertain, so an appropriate method is needed, namely a nonparametric approach such as the Multivariate Adaptive Regression Spline (MARS) method. Earthquakes can occur anywhere, including on Sumbawa Island, West Nusa Tenggara. Sumbawa Island is part of the Indonesian archipelago and is positioned west of the Alas Strait. Sumbawa, with an area of 15,448 square km, has an active volcano that once erupted violently in 1815 and had an impact on the whole world with changes in weather and the distribution of volcanic ash up to 1,300 km. The existence of Sumbawa is geologically in the position of the western and eastern island arcs due to the subduction of the Australian plate at the continental boundary of the Indo-Pacific plate, which is to the south of Sumbawa Island. Because Sumbawa is at a plate-meeting position, Sumbawa Island is an area that is prone to tectonic earthquakes. History shows that Sumbawa often experiences earthquakes with a magnitude scale of more than 5 with a depth of less than 70 Kilometers. Many methods have been developed, and research on earthquake prediction is included in the scope of data mining research [1]. Data mining is grouped into two, namely predictive data mining and descriptive data mining. Data mining, in principle, is the process of finding certain patterns and knowledge from large data sources [1]. In the data mining process, mathematical functions are needed, such as Association, Correlation, Classification, Regression, and Clustering functions [1–3]. Many methods are used in the data mining process, and one of them is the Multivariate Adaptive Regression Spline (MARS) method [4–6]. MARS is a nonparametric method for solving high-dimensional data problems and is used to find the relationship between predictor variables and response variables. MARS is very effectively used in processing earthquake prediction data mining, as will be done in this study.
Research related to earthquake prediction using various methods has been carried out, such as using the Artificial Neural Network method [7]. The study calculated sixty seismic features with seismological concepts such as the Gutenberg-Richter law, foreshock frequency, seismic energy release, seismic change rate, and total repeat time. Furthermore, Maximum Relevance and Min- imum Redundancy (MRMR) are used to extract the relevant features. Classification methods are used with Vector Regressor (SVR) and Hybrid Neural Networks (HNN) in making earthquake predictions. The numerical results obtained after being compared with previous prediction studies show an increase in prediction performance for all regions considered [7]. This study evaluates earthquake events for 50 years with a magnitude range of 0 to 8 Mw. Artificial Neural Networks are used to analyze earthquake data to pro- duce predictions of the next earthquake magnitude [8]. Comparison Three methods, namely Levenberg Marquardt Backpropagation (LMBP), Recurrent Neural Network (RNN), and Radial Basis Function (RBF), have also been carried out to predict and evaluate four different statistical measures. The results of the three RNN methods provide better predictive accuracy [9,10]. The Artificial Neural Network (ANN) is used to predict aftershocks for the next five days after earthquakes occur in several areas in Indonesia. Six clusters were used for analysis using Valley Tracing and Hill Climbing algorithms, while Hierarchical K-means were applied to the group data set. The evaluation results give better results in predicting the occurrence of aftershocks of or greater than 6 magnitudes [11]. Another technique that uses the Fuzzy Logic System method to model mathematically in predicting earthquakes, and the results of evaluating MAPE and MSE values for the best model for predicting earthquakes is to provide 7 inputs and 1 output from the fuzzy model [12]. The Innovative Mathematical Model (IMM) is used to analyze earthquake events in the last 20 years, and the Poisson distribution and Spatial Connection methods for each earthquake zone and identify patterns of random earthquake events [13].
Earthquake data is random and contains a high element of uncertainty, so choosing the right method for carrying out predictive analysis is necessary. Hence, the MARS method is very suitable for predicting earthquake data [14]. Another study with MARS and C-MARS explains that Ground Motion Prediction Equations (GMPEs) is an empirical relationship used to determine the response of the ground peak at a certain distance from the earthquake source. Conic Multivariate Adaptive Regression Splines (CMARS) method on available data sets to obtain new GMPE. The CMARS model uses PGA and PGV values as dependent variables. In contrast, three other parameters, such as moment magnitude (Mw), station location conditions (Vs30), and distance from earthquake source (Rjb), are used as independent variables. The findings of this study indicate that CMARS can be used effectively to predict PGA and PGV values at various distances from the earthquake source. The results were compared with the other three GMPEs, and CMARs were more effective for ground motion prediction purposes [15–18].
This study aims to develop research using the MARS method in a case study of the earthquake that occurred on Sumbawa Island, Indonesia. This research differs from earthquake prediction research conducted by other researchers because the basic nature of earthquake research is influenced by bedrock conditions where the earthquake’s location varies from one area to another, with
Matrik: Jurnal Managemen,Teknik Informatika, dan Rekayasa Komputer, Vol. 22, No. 3, July 2023: 583 – 592
Matrik: Jurnal Managemen,Teknik Informatika, dan Rekayasa Komputer r 585
different soil and rock structures. This research was conducted by developing the function of the Mathematical model formed by MARS according to the condition of the regional bedrock on Sumbawa Island. This researcher will use three predictor variables to find correlations in predictive analysis. This study will analyze predictions of earthquake-prone areas on Sumbawa Island based on Peak Ground Acceleration data with the highest value.
2. RESEARCH METHOD
2.1. Multivariate Adaptive Regression Spline (MARS)
The MARS method is a nonparametric regression method used to overcome the problem of high-dimensional data, which is used to determine the relationship pattern between the response variable and the predictor variable whose regression curve is not known [19]. In data mining management, predictions can be completed in two ways: Parametric Regression and Nonparametric Regression. These two approaches are commonly used as statistical methods and widely used for investigating and modeling rela- tionships between variables [20]. The MARS method can overcome the shortcomings of Recursive Partitioning Regression (RPR) by producing a continuous model at knots and identifying the presence of an additive linear function. Two stages of the algorithm can solve the MARS method, namely the Forward Stepwise model and the Backward Stepwise model [18,21,22]. The first stage, namely the Forward Stepwise Algorithm, is used for a combination of basis functions (BF), maximum interaction (MI), and mini- mum observation (MO). to find the relationship between the response variables and predictor variables. This research has determined that the response variable is Peak Ground Acceleration (PGA), and the predictor variables are depth, magnitude (Mw), and epicenter distance (Repi). Furthermore, the Backward Stepwise model’s second stage is used to simplify the basis function (BF) obtained from the Forward Stepwise stage. The basis function (BF), which has no contribution or makes a small contribution to the response variable, will be eliminated at the backward stepwise model stage. This deletion process will have the effect of decreasing the number of least squares of the remainder. In general, the Nonparametric Regression model can be presented as in Equation (1) [23–25].
yi=f(xi) +Ei (1)
Whereyiis the response variable on observation I, f(xi)is the vector predictor variable function, andEiis a free error i.
The determination of the independent variable greatly determines the results of the model built using the MARS method so that the MARS model is flexible, and its basic functions can be explained in Equations (2) and (3). Equations (2) and (3) seem almost the same function, so they can be called reflected pairs. The goal is reflected pairs on each variable x j on each observation xi, j on the knots of the variable so that a truncated linear function is formed from the basis function as in Equation (4). The MARS model starts from Equation (5).
(x−r)+=
x−r, ifx > r
0, otherwise (2)
and
(x−r)+=
x−r, ifx≥r
0, otherwise (3)
r=n
(xj−r)+, (r−xj)+|r ∈ {x1j, x2j, . . . , xN j}, j= 1,2, . . . , po
(4)
f(x) =β0+
M
X
m=1
βmβm(x) (5)
Where M is the number of basis functions that make up the function model. βm(x)is a basic function formed by a single element or by multiplying two or more elements contained inr, multiplied by the coefficientβm. The m basic function can be explained into the basis function as shown in Equation (6). WhereKmis the number of truncated linear functions times the basis function tom. ForXkm
j is the input variable associated with the truncated function in the mth basis function.τkm
j is the value of the knot variableτkm
j . WhileSkm
j is operator +/-, which is worth 1 or -1.
βm(xm) =
Km
Y
j=1
Skm j Xkm
j −τkm j
+, (6)
Data Mining Earthquake . . . (Dadang Priyanto)
586 r ISSN: 2476-9843
The MARS model is flexible and can be used to overcome the weaknesses of recursive partition regression by increasing the accuracy of the model. The MARS model is run with a two-stage algorithm: Forward Stepwise and Backward Stepwise. Then the algorithm will determine the value of knots in the continuous model and minimize the value of Generalized Cross Validation (GCV) to obtain the best model. GCV measurement can be seen in Equation (7). Whereyiis Variabel response,xi is Variable predictor, N is the number of observations,fˆM(xi)is the estimated value of the dependent variable on the M basis function onxi, M is the maximum number of base functions,C(Mˆ )isC(M) +d.M,C(M)isT race[B(BT B)−1BT] + 1, whereB is a matrix of M basis functions, and d is the value when each base function reaches optimization(2≤d≤4).
GCV(M) =
1 N
PN
i=1[yi−fˆM(xi)]2 h
1−C(M)ˆN i2 (7)
2.2. Peak Ground Acceleration (GPA)
Maximum Ground Acceleration (PGA) is the maximum ground vibration acceleration that occurs in an area caused by an earthquake. A large PGA value in an area usually has a large damage impact on the area at the center of the earthquake. The unit of PGA value is usually expressed in units of Gravitational Acceleration ”gal.” One way to get the PGA value is by using the empirical calculation of the Attenuation function. The attenuation function determines the relationship between ground vibration intensity, magnitude, and distance from an area to the earthquake’s epicenter. Several factors affect the attenuation function, namely the earthquake mechanism, the epicenter’s distance, and the ground location’s condition. This research is to get the PGA value using the Attenuation function of the Joyner and Boore Attenuation equations as in the following Formula (8) [26,27].
P GA(gal) = 10(0,71 + 0,23(M −6)−Log(r)−0,0027.r) (8) r=
q
R epi2+ 82 (9)
Where M is the magnitude, and r is the root of (R epi2+82). The PGA value will be obtained by assigning a value to ’M’ and the value of ’r’ in Equation (9). Furthermore, the research was conducted with Prediction analysis with previous selection/separation and selection of appropriate variables for Responsive and Predictor variables. This study uses the response variable ’PGA,’ and the predictor variables are depth, magnitude (Mw), and epicenter distance (Repi).
2.3. Data Collection
This study uses earthquake catalog data taken from sources on the USGS website (https://earthquake.usgs.gov/earthquakes/sea- rch/). The data was accessed on May 31, 2022, at 10:47 AM and has been filtered with a magnitude of more than 4 Mw. This is done because a Magnitude of less than 4 Mw does not have a significant impact or may not be felt at all. The coordinate position taken is -8,59491 South Latitude and 117,26121 East Longitude. Earthquake catalog data was obtained over 20 years with a total of 105 records in the range of Magnitude 4 to the highest of 5.5 Mw. The data is processed by a selection system with a magnitude of more than 4 Mw, a depth of less than 250 Km, and an earthquake center distance of less than 300 Km. Data that is not in the provisions or ring will be deleted or not used because it does not cause damage. The data is processed for use in predictive analysis. Three data variables have been determined: Magnitude, Epicenter Distance, and depth of the center of the earthquake location.
The earthquake prediction analysis process used the Multivariate Adaptive Regression Spline (MARS) method using the equa- tion function number 6, and to get the minimum value of Generalized Cross Validation (GCV) used equation number 7. The SPM 8 software was used to predict earthquakes by analyzing the parameter factor of the relationship between the predictor variable and the response variable. MARS works with two algorithms, the Forward Stepwise and the Backward Stepwise algorithms. The Forward Stepwise algorithm determines the combination of the maximum basis function with maximum interaction and minimum observation (MO).
Maximum basis function for cross multiplying between variables that have linkage and correlation. Maximum Interaction (MI) to describe the maximum line in the basis function (BF) that can be traversed or past the knot point, and the minimum observation to obtain a minimum smoothing parameter value or, in other words, the minimum observation between knots. Furthermore, the Backward Stepwise algorithm is used to simplify the complexity of the formed mathematical model functions. This algorithm uses a regularization technique to minimize generalization errors by using the Tikhonov Regularization technique, which gives a penalty if the function of the formed mathematical model is too complex. Peak Ground Acceleration (PGA) is used to determine whether an
Matrik: Jurnal Managemen,Teknik Informatika, dan Rekayasa Komputer, Vol. 22, No. 3, July 2023: 583 – 592
Matrik: Jurnal Managemen,Teknik Informatika, dan Rekayasa Komputer r 587
area is categorized as prone or not to earthquake hazards. A high PGA value in an area will have a high impact due to the occurrence of an earthquake. The PGA value is obtained from recording using an Accelerograph machine or by empirical calculations, and this study uses empirical calculations using the Joyner and Boore Attenuation functions, as in the equations of functions number 8 and 9.
3. RESULT AND ANALYSIS 3.1. Results
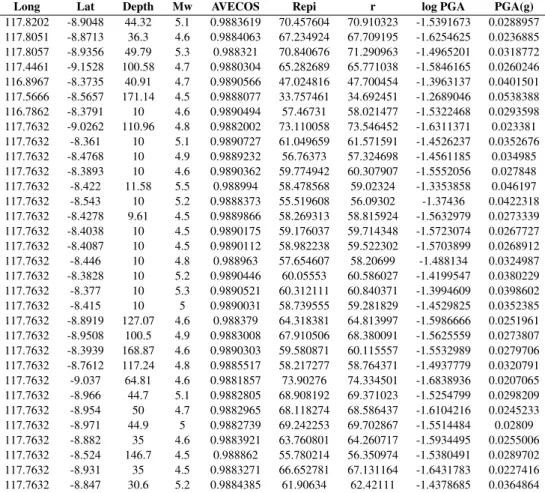
The study’s results began with preprocessing the data to find the value of the epicenter distance and Maximum Ground Ac- celeration (PGA). The Joyner and Boore attenuation functions were used to find the PGA value. After knowing the PGA value, the calculation and prediction analysis can be continued using the MARS method. At this stage, to get the best MARS model, it is necessary to test the data and determine the best model by selecting the minimum GCV value. Peak Ground Acceleration (PGA) is the maximum ground vibration acceleration that occurs in an area caused by an earthquake. A large PGA value in an area usually has a large damage impact on the area at the center of the earthquake. The unit of PGA value is usually expressed in units of Gravitational Acceleration ”gal.” One way to get the PGA value is by using the empirical calculation of the Attenuation function. The attenuation function determines the relationship between ground vibration intensity, magnitude, and distance from an area to the earthquake’s epicenter. Several factors affect the attenuation function, namely the earthquake mechanism, the epicenter’s distance, and the ground location’s condition. This research is to get the PGA value using the Attenuation function of the Joyner and Boore Attenuation equations as in the following Formula (8) and (9) [26]. The PGA value was obtained from the results of processing earthquake data in Sumbawa from 2000 to 2021, as shown in Table1.
Table 1. PGA Value for Earthquake in Sumbawa
Long Lat Depth Mw AVECOS Repi r log PGA PGA(g)
117.8202 -8.9048 44.32 5.1 0.9883619 70.457604 70.910323 -1.5391673 0.0288957 117.8051 -8.8713 36.3 4.6 0.9884063 67.234924 67.709195 -1.6254625 0.0236885 117.8057 -8.9356 49.79 5.3 0.988321 70.840676 71.290963 -1.4965201 0.0318772 117.4461 -9.1528 100.58 4.7 0.9880304 65.282689 65.771038 -1.5846165 0.0260246 116.8967 -8.3735 40.91 4.7 0.9890566 47.024816 47.700454 -1.3963137 0.0401501 117.5666 -8.5657 171.14 4.5 0.9888077 33.757461 34.692451 -1.2689046 0.0538388 116.7862 -8.3791 10 4.6 0.9890494 57.46731 58.021477 -1.5322468 0.0293598 117.7632 -9.0262 110.96 4.8 0.9882002 73.110058 73.546452 -1.6311371 0.023381 117.7632 -8.361 10 5.1 0.9890727 61.049659 61.571591 -1.4526237 0.0352676 117.7632 -8.4768 10 4.9 0.9889232 56.76373 57.324698 -1.4561185 0.034985 117.7632 -8.3893 10 4.6 0.9890362 59.774942 60.307907 -1.5552056 0.027848 117.7632 -8.422 11.58 5.5 0.988994 58.478568 59.02324 -1.3353858 0.046197 117.7632 -8.543 10 5.2 0.9888373 55.519608 56.09302 -1.37436 0.0422318 117.7632 -8.4278 9.61 4.5 0.9889866 58.269313 58.815924 -1.5632979 0.0273339 117.7632 -8.4038 10 4.5 0.9890175 59.176037 59.714348 -1.5723074 0.0267727 117.7632 -8.4087 10 4.5 0.9890112 58.982238 59.522302 -1.5703899 0.0268912 117.7632 -8.446 10 4.8 0.988963 57.654607 58.20699 -1.488134 0.0324987 117.7632 -8.3828 10 5.2 0.9890446 60.05553 60.586027 -1.4199547 0.0380229 117.7632 -8.377 10 5.3 0.9890521 60.312111 60.840371 -1.3994609 0.0398602 117.7632 -8.415 10 5 0.9890031 58.739555 59.281829 -1.4529825 0.0352385 117.7632 -8.8919 127.07 4.6 0.988379 64.318381 64.813997 -1.5986666 0.0251961 117.7632 -8.9508 100.5 4.9 0.9883008 67.910506 68.380091 -1.5625559 0.0273807 117.7632 -8.3939 168.87 4.6 0.9890303 59.580871 60.115557 -1.5532989 0.0279706 117.7632 -8.7612 117.24 4.8 0.9885517 58.217277 58.764371 -1.4937779 0.0320791 117.7632 -9.037 64.81 4.6 0.9881857 73.90276 74.334501 -1.6838936 0.0207065 117.7632 -8.966 44.7 5.1 0.9882805 68.908192 69.371023 -1.5254799 0.0298209 117.7632 -8.954 50 4.7 0.9882965 68.118274 68.586437 -1.6104216 0.0245233 117.7632 -8.971 44.9 5 0.9882739 69.242253 69.702867 -1.5514484 0.02809 117.7632 -8.882 35 4.6 0.9883921 63.760801 64.260717 -1.5934495 0.0255006 117.7632 -8.524 146.7 4.5 0.988862 55.780214 56.350974 -1.5380491 0.0289702 117.7632 -8.931 35 4.5 0.9883271 66.652781 67.131164 -1.6431783 0.0227416 117.7632 -8.847 30.6 5.2 0.9884385 61.90634 62.42111 -1.4378685 0.0364864
Furthermore, the research was conducted with Prediction analysis with previous selection/separation and selection of appro- priate variables for Responsive and Predictor variables. This study uses the response variable ’PGA,’ and the predictor variables are
Data Mining Earthquake . . . (Dadang Priyanto)
588 r ISSN: 2476-9843
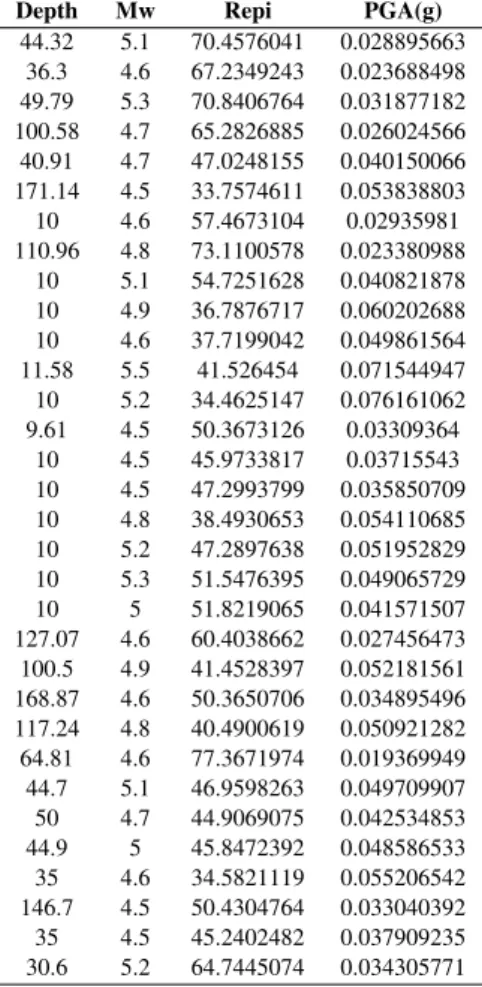
depth, magnitude (Mw), and epicenter distance (Repi). The results of selecting the appropriate type of variables in the prediction analysis data can be obtained, as shown in Table2. The results of the prediction analysis using the MARS method using the Forward Stepwise algorithm and the Backward Stepwise algorithm based on a combination of BF, MI, and MO are in the form of training data. The results of the MARS regression based on the training data are shown in Table3.
Table 2. Data on Response Variables and Predictors of Earthquakes in Sumbawa
Depth Mw Repi PGA(g)
44.32 5.1 70.4576041 0.028895663 36.3 4.6 67.2349243 0.023688498 49.79 5.3 70.8406764 0.031877182 100.58 4.7 65.2826885 0.026024566 40.91 4.7 47.0248155 0.040150066 171.14 4.5 33.7574611 0.053838803 10 4.6 57.4673104 0.02935981 110.96 4.8 73.1100578 0.023380988
10 5.1 54.7251628 0.040821878 10 4.9 36.7876717 0.060202688 10 4.6 37.7199042 0.049861564 11.58 5.5 41.526454 0.071544947 10 5.2 34.4625147 0.076161062 9.61 4.5 50.3673126 0.03309364
10 4.5 45.9733817 0.03715543 10 4.5 47.2993799 0.035850709 10 4.8 38.4930653 0.054110685 10 5.2 47.2897638 0.051952829 10 5.3 51.5476395 0.049065729 10 5 51.8219065 0.041571507 127.07 4.6 60.4038662 0.027456473 100.5 4.9 41.4528397 0.052181561 168.87 4.6 50.3650706 0.034895496 117.24 4.8 40.4900619 0.050921282 64.81 4.6 77.3671974 0.019369949 44.7 5.1 46.9598263 0.049709907 50 4.7 44.9069075 0.042534853 44.9 5 45.8472392 0.048586533 35 4.6 34.5821119 0.055206542 146.7 4.5 50.4304764 0.033040392 35 4.5 45.2402482 0.037909235 30.6 5.2 64.7445074 0.034305771
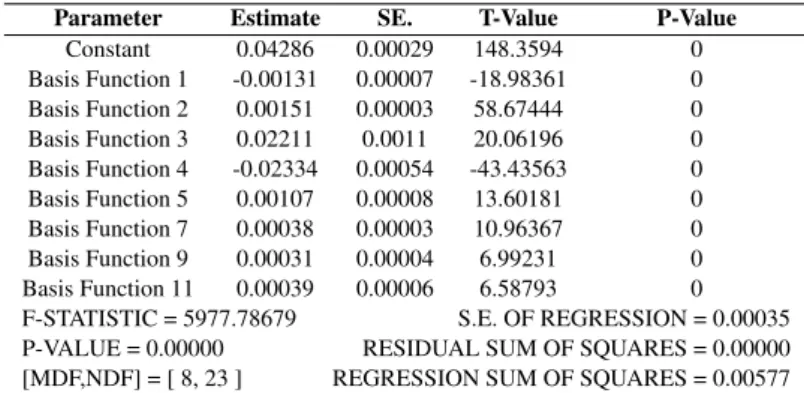
Table 3. Results of Training Data
Parameter Estimate SE. T-Value P-Value
Constant 0.04286 0.00029 148.3594 0
Basis Function 1 -0.00131 0.00007 -18.98361 0 Basis Function 2 0.00151 0.00003 58.67444 0 Basis Function 3 0.02211 0.0011 20.06196 0 Basis Function 4 -0.02334 0.00054 -43.43563 0 Basis Function 5 0.00107 0.00008 13.60181 0 Basis Function 7 0.00038 0.00003 10.96367 0 Basis Function 9 0.00031 0.00004 6.99231 0 Basis Function 11 0.00039 0.00006 6.58793 0 F-STATISTIC = 5977.78679 S.E. OF REGRESSION = 0.00035 P-VALUE = 0.00000 RESIDUAL SUM OF SQUARES = 0.00000 [MDF,NDF] = [ 8, 23 ] REGRESSION SUM OF SQUARES = 0.00577
Matrik: Jurnal Managemen,Teknik Informatika, dan Rekayasa Komputer, Vol. 22, No. 3, July 2023: 583 – 592
Matrik: Jurnal Managemen,Teknik Informatika, dan Rekayasa Komputer r 589
3.2. Testing and Analysis
In predictive analysis, a statistical analysis test is needed to obtain the hypothesis testing results and determine the significance level. The significance level is meant to get the parameter significance. Hypothesis testing is required to use statistical analysis to determine the significance of parameters with the suitability of the mathematical model obtained. This research tests mathematical model analysis using a partial regression coefficient test. In testing the partial regression coefficient, the following Formula is needed:
H0:a1=a2= a3= a5= a7= a8= a9= a11= 0 H1:there is at least one am6=0;
m= 1,2,3,4,5,7,9,11 (significant model)
• Significant level,α= 0,05
• Statistic test:tcount= Se(ˆˆama
m)withSe(ˆam) =p
var(ˆam)
• Critical Area: refuseH0ift > t(α2,61)orP −value < α
P-value in statistical tests used to determine the magnitude of the opportunity, to state the status Reject the null hypothesis or (H0) with the actual condition (H0) is true. As shown in Table3(results of training data) that the P-value is less than 0.05, or in other words, every m< αor (m<0.05) so that the H0 status is rejected. This means that each coefficientα1, α2, α3, α4α5, α7, α9, α11 has a significant effect on the mathematical model obtained. Based on the significance level of 5%, the mathematical model in Formula (10) is significant. It can be used in predictive analysis of the PGA value for earthquake data sets in Sumbawa. Furthermore, after knowing the suitability of the parameters and mathematical models obtained based on testing, it is concluded that the variables that affect the PGA value are epicenter distance (R-epi), magnitude (Mw), and depth (Depth).
3.3. Discussion
It can be seen in Table3that the parameters formed with 11 basis functions that contribute to the response variable are Basis functions 1, 2, 3, 4, 5, 7, 9 and 11. Several basis functions do not contribute to the response variable, namely base functions 6, 8, and 10, then the basic function is omitted or deleted. The results of testing the data at the Backward Stepwise stage by simplifying the function can be obtained from a Mathematical model as in Formula (10).
Y = 0.042863 − 0.00130501 ∗ BF1 + 0.00151234 ∗ BF2 + 0.0221103 ∗ BF3 − 0.0233377 ∗ BF4 +
0.00106639 ∗ BF5 + 0.000377886 ∗ BF7 + 0.000305277 ∗ BF9 + 0.000391561 ∗ BF11; (10) MODEL PGA = BF1 BF2 BF3 BF4 BF5 BF7 BF9 BF11;
WhereY(P GA)is the result of PGA Prediction analysis with the MARS model with the contribution of each basis function (BF) as follows:
BF1 = max( 0, REPI - 50.3651);
BF2 = max( 0, 50.3651 - REPI);
BF3 = max( 0, MW - 5.1);
BF4 = max( 0, 5.1 - MW);
BF5 = max( 0, MW - 4.8) * BF2;
BF7 = max( 0, REPI - 41.4528) * BF4;
BF9 = max( 0, REPI - 64.7445);
BF11 = max( 0, REPI - 44.9069);
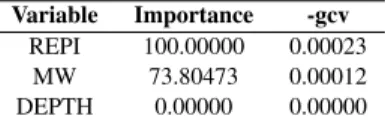
Based on the best MARS model, the predictor variable inference that affects PGA is obtained based on the MARS model according to the smallest GCV value sequentially based on the percentage of its contribution, namely the distance of the epicenter (Repi), the magnitude (Mw), and the depth (Depth) as shown in Table4, which describes the interactivity of the predictor variable’s contribution to the response variable.
Table 4. The Interactivity of Predictor Variable Contributions
Variable Importance -gcv REPI 100.00000 0.00023
MW 73.80473 0.00012 DEPTH 0.00000 0.00000
It can be seen in Table4that the most influential variables in the PGA value are the Epicenter Distance (Repi) of 100% and the Magnitude (Mw) of 73.8%, while the depth (Depth) does not contribute at all or 0%. The test results to clarify the description of the
Data Mining Earthquake . . . (Dadang Priyanto)
590 r ISSN: 2476-9843
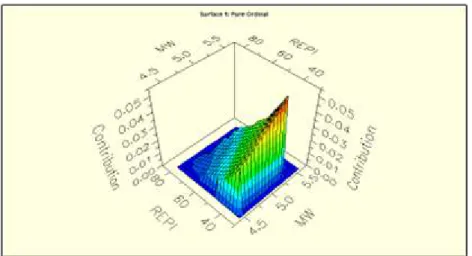
interactivity of the variable contributions of each predictor variable can be seen in Figure1of the Three Dimensional graphs of the contribution of the predictor variable to the response variable.
Figure 1. Graph of the Contribution of the Predictor Variable to the Response Variable
As seen in Figure1, the three-dimensional graph shows that the lower the value of the epicenter distance (Repi), the higher the contribution value to the Response variable, and this means that the closer the epicenter distance, the higher the impact of damage caused by earthquakes. Likewise, it can be seen that the larger the Magnitude (Mw) variable value, the higher the contribution value to the Response variable, meaning that the greater the magnitude value, the greater the damage caused by the earthquake. After going through the testing and validation of the Prediction Analysis results, the Regions in Sumbawa with the Highest Potential for Earthquake Hazards can be identified based on the highest PGA values referring to Table1, namely Mapin Kebak, Mapin Rea, Pulau Panjang, and Pulau Saringi. Based on the calculation of the PGA value, which is influenced by the magnitude, depth, and distance of the earthquake location. In theory, based on a high PGA value will have a high impact on earthquake damage, although other factors affect earthquake damage, such as the condition of the bedrock of the location. Based on the results of the prediction analysis by grouping the areas with the highest earthquake vulnerability in Sumbawa, policymakers can use it to make rules in infrastructure development with special specifications in earthquake-prone areas.
Based on a literature search, no earthquake prediction research was found that specifically mapped areas in Sumbawa prone to earthquakes. However, other studies discuss, in general, that Sumbawa Island is an earthquake-prone area, as explained by Haryadi, that the potential for an earthquake on Sumbawa Island is very likely to occur because in the northern part of Sumbawa Island, there are micro tectonic plates that extend from Singaraja Bali to Dompu Regency and there is a hemisphere fracture. This threat originates from the south, which is at the bottom of the Indian Ocean because of the Indo-Australian oceanic plate [28]. This is reinforced by the results of research conducted by Sabtaji, who stated that the results of his research in West Nusa Tenggara Province, including the island of Sumbawa, have a number of monthly earthquakes the most, namely the seismicity that occurred in August 2018 as many as 1,658 earthquake events [29]. Another research by Hidhajah stated that major earthquakes occurred from July to August 2018, which impacted food poisoning among refugees in the Alas area, Sumbawa district [30]. Based on the results of previous research, it can be concluded that the authors’ research gave the same results that Sumbawa Island is included in areas prone to earthquake hazards.
The authors have been able to cluster Sumbawa Island, which areas have the greatest risk of earthquake hazards.
4. CONCLUSION
Based on earthquake catalog data from 2000 to 2021, this study analyzes earthquake hazard predictions in Sumbawa using the MARS method, which involves 11 basic functions. There is a close relationship between the predictor variable and the response variable, with a percentage of 100% epicenter distance and 73.8% magnitude. Based on PGA data, the Potential Areas with a great earthquake hazard in Sumbawa are Mapin Kebak, Mapin Rea, Pulau Panjang, and Pulau Saringi. The analysis of earthquake hazard predictions in Sumbawa can be used as a consideration in infrastructure development in Sumbawa to minimize the risk of earthquake hazards. Furthermore, this research can be developed by adding the number of predictor variables and the number of basis functions to provide more accurate prediction results.
Matrik: Jurnal Managemen,Teknik Informatika, dan Rekayasa Komputer, Vol. 22, No. 3, July 2023: 583 – 592
Matrik: Jurnal Managemen,Teknik Informatika, dan Rekayasa Komputer r 591
5. ACKNOWLEDGEMENTS
Praise be to God Almighty, who has given His Grace so that this paper can be completed for publication. Many thanks to the Rector of Bumigora University, the Head of LPPM, and all those who directly or indirectly helped in the preparation and publication of this paper.