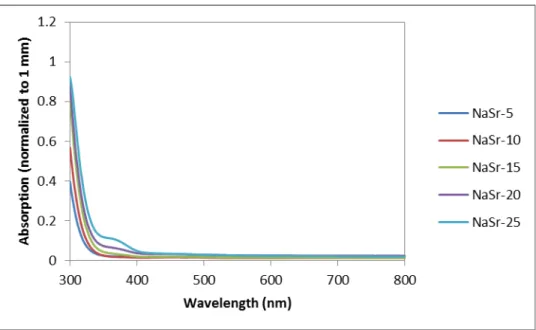
Ultraviolet spectroscopy spectrum for sodium strontium silicate series with strontium as variable modifier. Real and imaginary parts of the dielectric constant as a function of frequency in the Terahertz spectrum for the sodium calcium silicate series with calcium as a variable modifier.
Instrument Background
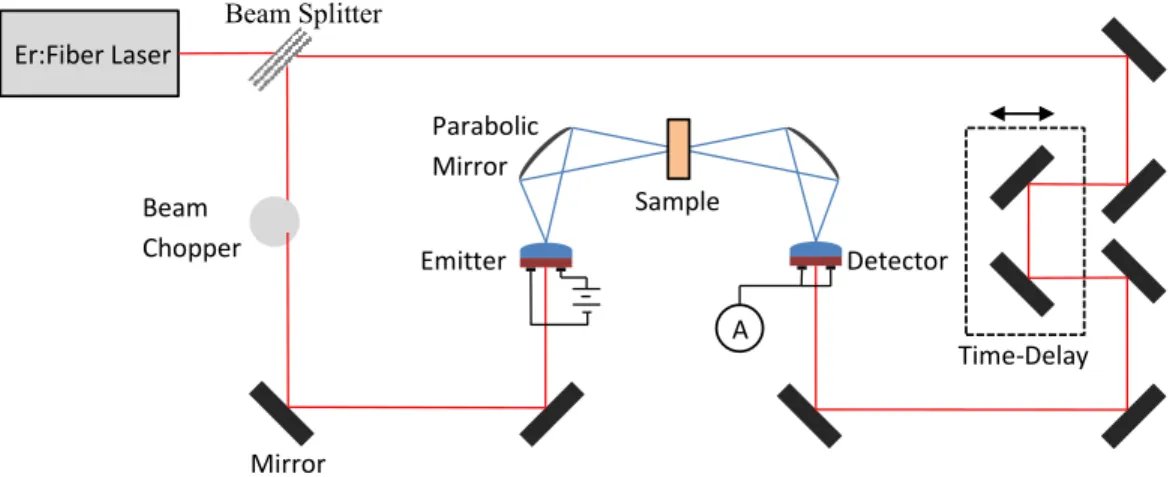
The radiation is then directed towards the sample by means of parabolic mirrors and then redirected towards the detector. A detector works much like a transmitter, except that an electric field generates input radiation that changes the current.
Terahertz Radiation and Materials
- Organic Materials
- Crystalline Semiconductors and Insulators
- Metallics
- Inorganic Glass
Amorphous materials can have the same chemical composition but significantly different properties due to the lack of long-range order. The crystal structure effect for silica increases absorption compared to silica.
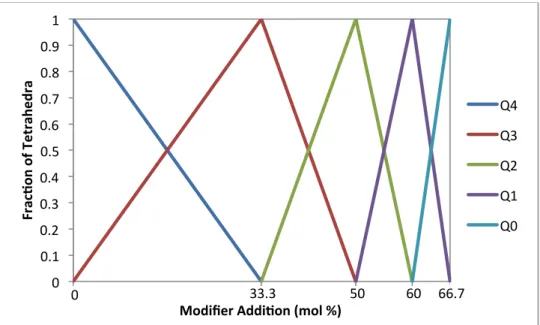
Glass Compositions and Structure
The terahertz radiation gives insight into the glass structure and is closely related to mechanical and optical properties of glass.35 So far, glass is considered to be quite permeable in the terahertz range with fused silica having the highest transmission for oxide glasses. The type of modifier also affects the glass where high refraction (i.e. high polarizability) is a result of the charge of the modifier as well as its size.41 The average electron density is also increased by most modifiers.
Dielectric Properties and Polarizability of Glass
In terms of applications, the non-crystalline nature of glass has some major advantages over conventional capacitor dielectrics. Terahertz radiation is considered low frequency in terms of photonics and high frequency in terms of electronics.
Design of Experiment
Depending on the glass, a certain load still develops - even if it is light - close to the surface of the glass. The density of the glass is measured using Archimedes' method to provide some insight into the structure of the glass.
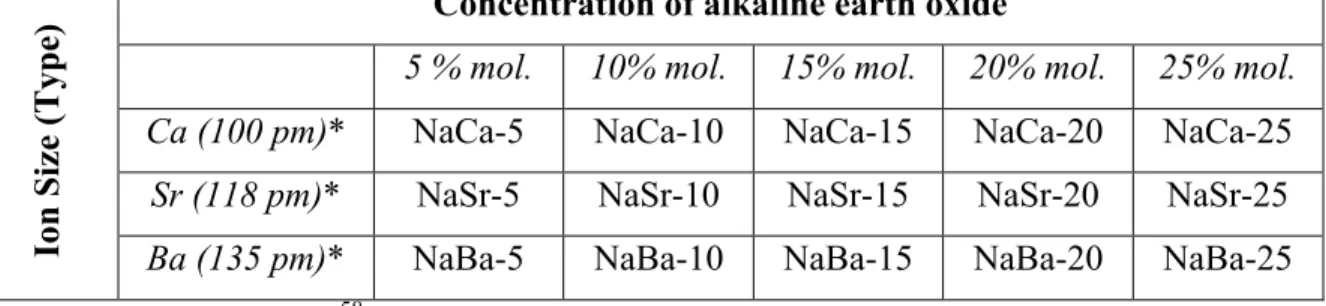
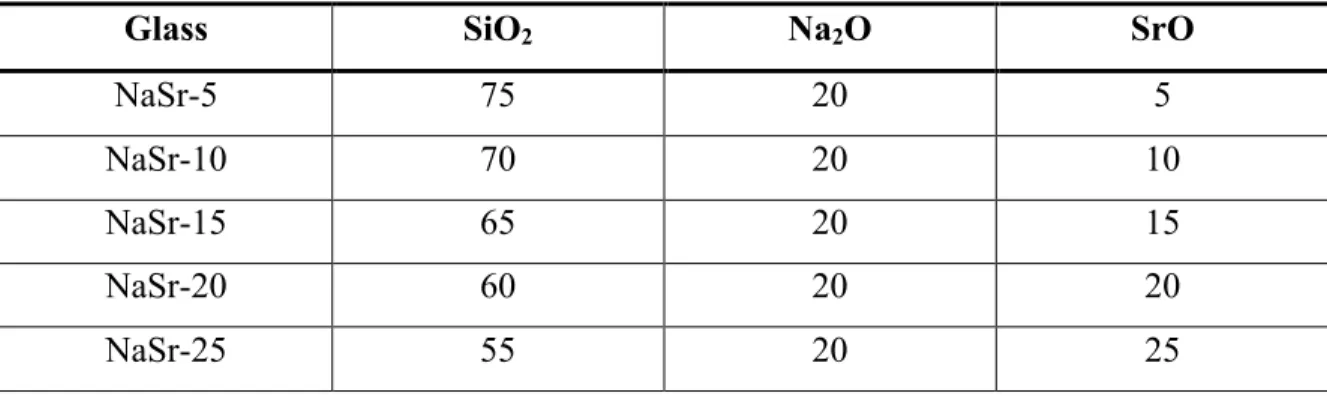
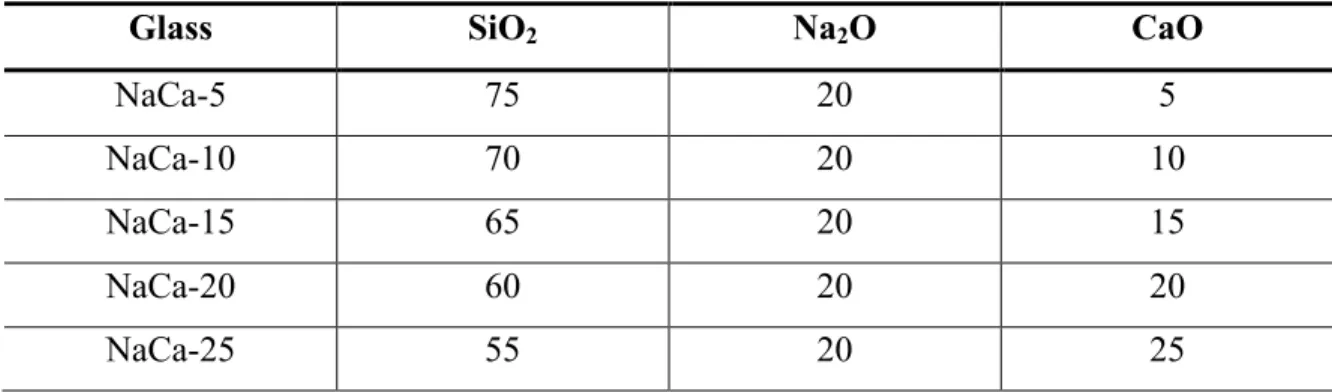
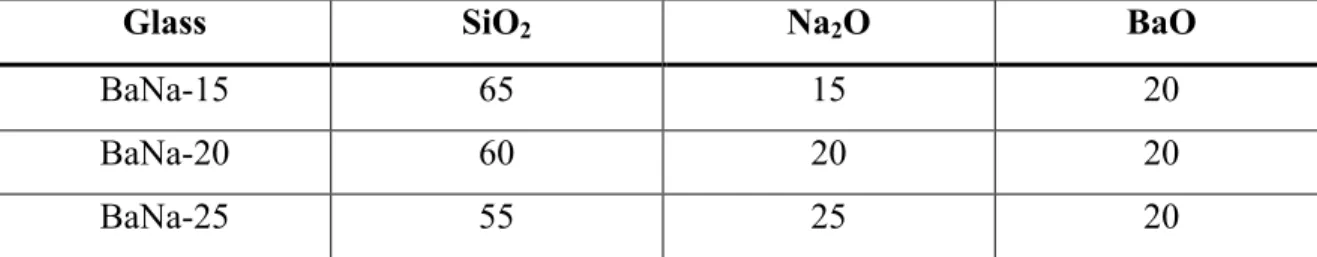
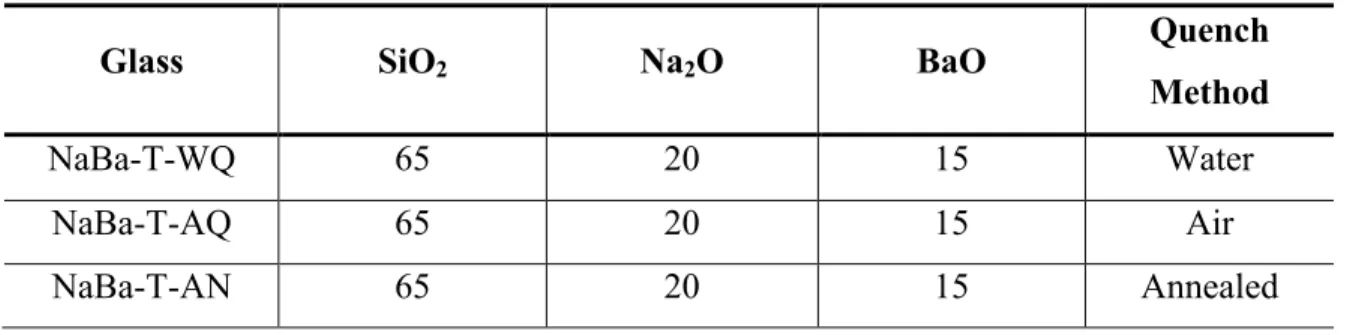
Glass Compositions
Sample Preparation
X-Ray Diffraction
Density
For the glass frit described in Table IX, an AccuPyc II 1340 helium pycnometer (Micromeritics, Norcross, GA) was used to obtain the density, since the frit is in powder form and cannot be measured by the Archimedean method using the setup described in Figure 4 ..
Differential Scanning Calorimetry
Ultraviolet-Visible Spectroscopy
Three scans were averaged together to obtain the results presented in the results and discussion section. Two light sources emit ultraviolet, visible and near-infrared radiation, which is passed through a diffraction grating and a narrow slit, allowing only a small strip of light to pass through, where the band is split into two beams. The two beams then redirect to the detector, which connects to a computer and measures transmission.
Infrared Spectroscopy
Time-Domain Terhartz Spectropscopy
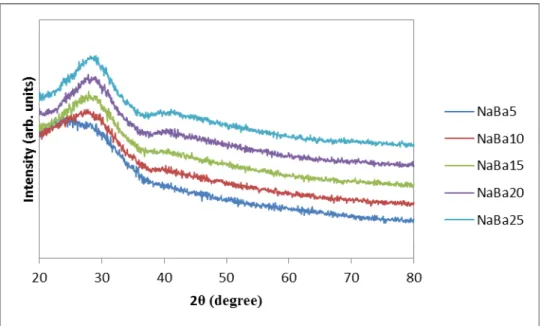
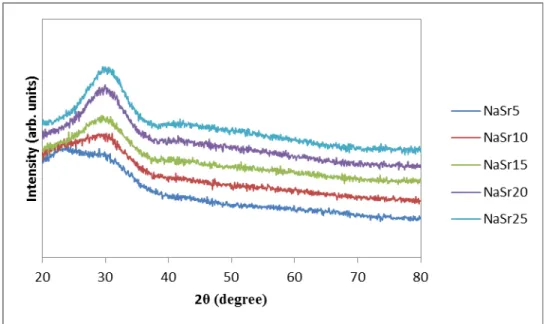
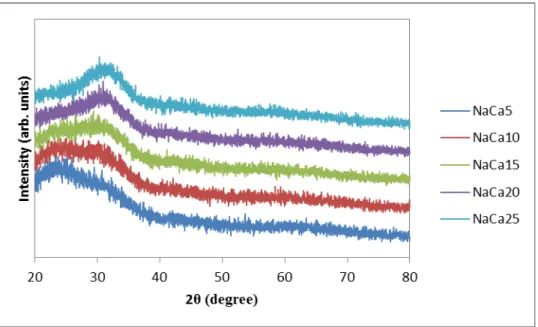
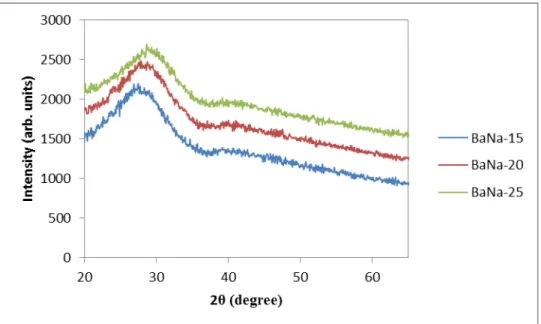
Results and Discussion for X-Ray Diffraction
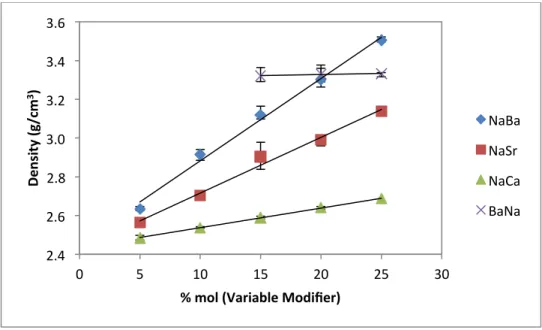
Results and Discussion for Density
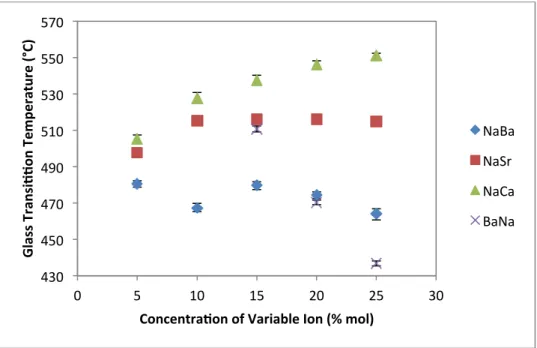
This peak shift is related to the intermediate order of the glass structure and is the subject of debate in the scientific community.59-63. The increase in density for series 1, 2 and 3 (NaBa, NaSr and NaCa) can be attributed to the occupation of divalent alkaline earth ions in the interstitial space within the glass lattice. As the concentration of these ions increases, so does the density of the glass.
It is known that increasing the concentration of the sodium modifier does increase the density, but the increase is slight.39. Changes in the data can also arise from the thermal history of the glass. The cooling nature of the glass can fluctuate the volume depending on the cooling rate of the bulk glass.
Slight variations in size of the glass, placement in the annealer, furnace parameters and environmental conditions can cause a difference in data, although care has been taken to minimize these processing effects through consistent procedure, and tight tolerances in weighing raw materials.
Results and Discussion for Differential Scanning Calorimetry
However, glass transition is sensitive to thermal history as presented in Table X, where higher quench rate increases the glass transition temperature. Glass transition temperature as a function of variable ion concentration (Ba, Sr, Ca and Na) as determined by differential scanning calorimetry.
Results and Discussion for Ultraviolet-Visible Spectropscopy
It is worth noting that there is a shift in the UV edge with respect to variable ion concentration. As the modification content increases for each composition, the UV edge shifts to a higher wavelength (i.e., lower energy). To quantify this effect, Table XI shows the wavelength value where the absorption is 0.2 for each millimeter.
Two other trends can be noted in the table: the UV edge shifts to a higher wavelength (lower energy) with respect to an increase in ion size, and the increase in the UV edge wavelength with the increase in modifier content. It is known that the UV edge is associated with the valence electron of an anion, in this case oxygen, in an excited state.39 This effect becomes stronger the more non-bridging oxygen atoms (NBOs) are present. Special topics on the mixed alkali effect are important to mention but are not applicable in this study.
From Table XI, this effect is evident, and the shift in the UV edge is directly proportional to the electronic band gap of the glasses.
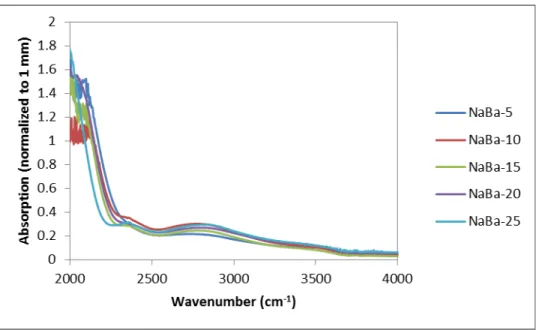
Results and Discussion for Infrared Spectropscopy
Fourier Transform Infrared spectroscopy spectrum for sodium barium silicate series with barium as variable modifier. Three peaks at approx. and 2325 cm-1 are present in each of the samples, which correlate directly with hydroxyl absorption. The hydroxyl absorption comes from the ambient humidity and water used for processing during melting, which trapped hydroxyl groups in the bulk of the glass and could affect the results in the terahertz range.
Fourier Transform Infrared spectroscopy spectrum for sodium strontium silicate series with strontium as the variable modifier. Fourier Transform Infrared spectroscopy spectrum for sodium calcium silicate series with calcium as the variable modifier. Fourier Transform Infrared spectroscopy spectrum for barium sodium silicate series with sodium as the variable modifier.
This edge is the result of multiple absorptions of the many types of vibrational modes present in the glass structure.
Results and Discussion for Time-Domain Terahertz Spectropscopy
Compositional Effects
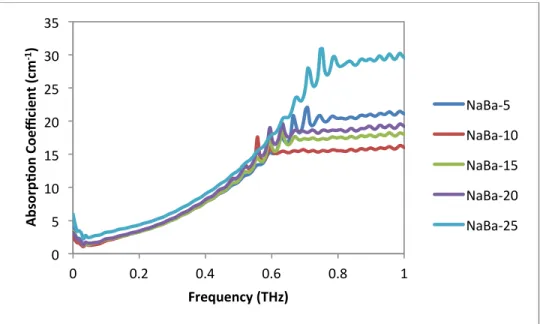
In the same region, the increase in the absorption coefficient, the real and imaginary part of the dielectric constant, can be calculated up to the point where no transmission occurs, which is around 0.6 THz. The same applies to Figure 29 with variable sodium concentration, where the dielectric constant also remains uniform for the region of adequate transmission. Real and imaginary parts of the dielectric constant as a function of frequency in the Terahertz spectrum for the sodium barium silicate series with barium as a variable modifier.
Real and imaginary parts of the dielectric constant as a function of frequency in the Terahertz spectrum for the sodium strontium silicate series with strontium as the variable modifier. Real and imaginary parts of the dielectric constant as a function of frequency in the Terahertz spectrum for the barium sodium silicate series with sodium as the variable modifier. To compare the series, the dielectric constant was averaged over the range 0.050635 to 0.405077 THz and plotted as a function of the modification additive shown in
As shown in the plot, the dielectric constant increases linearly as the concentration of the modifier increases.
Alternative Method of Testing
For example, at 5% mol RO (where R is Ba, Sr, or Ca), the average dielectric constant increases in the order Ba > Sr > Ca, which is in the order of decreasing field strength. In this figure, the more vertical the trend lines are, the more likely it is that the increase in dielectric constant is due to the electronic polarization of the ionic species, and less to the local space (ionic polarization) surrounding polarizing ions. From this figure it is clear that all three reasons contribute to the dielectric constant increase, because none of the series is completely vertical and so the structure change must have an effect, although the sodium oxide varying series (BaNa) is almost linear, which states that sodium ion concentration has a strong effect on the overall dielectric constant.
The goal was to quench the glass melt at a faster rate to change the density/glass transition temperature which is directly related to the structure. In Table XIII, the mass of each of the components in the grains, with the final mass of the grains, and thickness measurements were used to calculate the amount of frit per unit thickness (in this case 1 mm) in each of the samples when you assume complete homogeneity from frit to HDPE. This is a way to calculate the amount of frit in the HDPE for a given thickness, which is used to show how much frit is detected by the spectrometer.
The use of the frit creates a large source of error regarding the increased surface area and thus the scattering effect of the radiation.
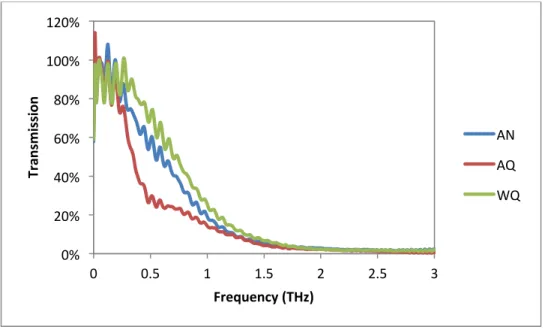
Ion Exchange/Thickness Effects
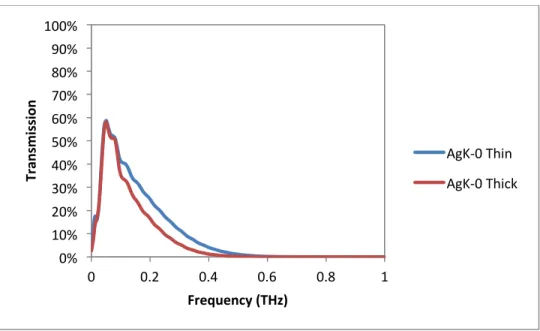
Transmission as a function of frequency in the Terahertz spectrum for a thin and thick commercial float glass. This lack of detection may be the result of the small diffusion layer of the exchanged ions, which is on the order of 10's of microns, being too small to respond to the wavelengths in the terahertz spectrum, where 1 THz equals a wavelength of 300 micron. Real and imaginary parts of the dielectric constant as a function of frequency in the Terahertz spectrum for silver and potassium ion-diffused glass at different temperatures.
Other Considerations for Terahertz Testing
The importance of the choice of modifier will greatly influence the electrical properties of glasses in the Terahertz region. The alkaline earth series will increase the dielectric constant as the ion size increases in the group through ionic polarization. Ion diffusivity of silver and potassium at the surface has no effect on the transmission or dielectric constant in the Terahertz region.
Hydroxyl groups on the surface of the glass can be neglected due to the opaque nature of glass at all water absorption frequencies in the Terahertz region. Koch, “Terahertz time-domain spectroscopy as a tool to monitor the glass transition in polymers,” opt. Clark, “Terahertz Time Domain Spectroscopy of Crystalline and Aqueous Systems in NATO Security via Science Series, Vol.
Miles, "Terahertz time domain spectroscopy: a new tool for the study of glasses in the far infrared", J.