Unopened SEM image of the ion exchange profile produced by a large. left) Unopened SEM image of the ion exchange profile, (right) EDS map of the ion. Ion exchange medium has also been shown to remain on damaged surfaces after machining, cleaning and testing to failure.
INTRODUCTION
LITERATURE REVIEW
G LASS S TRENGTHENING AND I ON E XCHANGE
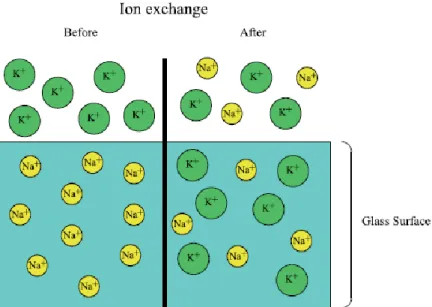
On cooling, the surface layer will move into a compression state, balanced by the tensile stress in the bulk of the glass. The silver in the trap will affect the surface and the tin side of the glass will turn brown.

D IFFUSION
The total chemical potential is the driving force for the transport of the diffusing species in the glass. The depth of the exchange is proportional to the square root of the exchange duration.
S TRESS AND S TRESS R ELAXATION
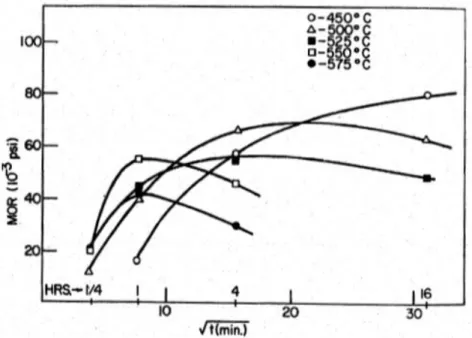
𝐸𝑎 is the activation energy, R is the universal gas constant and T is the temperature.7 The exchange rates of the alkali ions are concentration dependent and by extension also time dependent. Thus, it is important to keep the temperature of the ion exchange treatment below the yield point of the glass so that the compressive stress generated does not subsequently decrease.
F LAWS /I NDENTATION
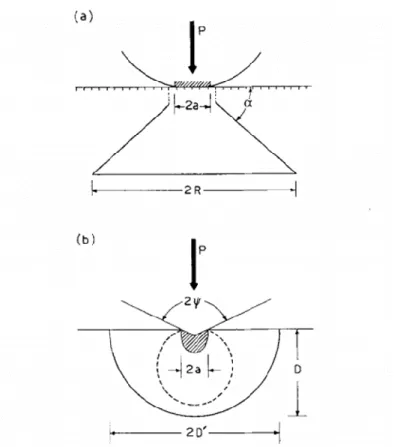
For a crack to grow spontaneously, the stress at the crack tip must exceed the theoretical strength of the glass. The Vickers diamond indenter is in contact with the glass surface under a certain load and for a certain time.

S TRENGTH T ESTING
EXPERIMENTAL PROCEDURE
F LAW C REATION
This mixture was then applied to both sides of the glass plate and the plate was heated to 500˚C. This allows silver ions to diffuse into the glass, the tin side of the glass will turn brown where the "paint" was applied, and the air side will not. Having identified the air side of the glass, defects were only introduced on that surface to avoid variations from the tin content.
In order to create an easily reproducible and consistent defect on the surface of the glass plates, we investigated two methods. A sharp contact or Vickers indenter was then used to introduce a single large defect on the surface of the air side of the glass plates directly in the center. Sharp contact etching was chosen instead of blunt contact etching for easier measurement of the depth of the sharp contact defect.
I ON -E XCHANGE
The simulation was then used to determine the amount of thermal expansion the two underwent along with the tolerances needed to ensure no stress was applied to the glass plates during the ion exchange process. The overall dimensions of the ion exchange rack allow the rack to hold as many glass plates as possible and fit into pot furnaces. Inserted glass plates were loaded into the ion exchange rack with the indentation/air side facing up, then the ion exchange rack was placed in the first pot.
The salt bath was also lowered to 400˚C in subsequent experiments to test for stress relaxations occurring during the ion exchange process. After being ion-exchanged for a predetermined time, the rack and plates were removed from the salt bath and held above the bath for 10 min allowing excess potassium nitrate to drip off and the plate to partially cool. The apparatus was then removed from all heat and allowed to cool to room temperature at which point the glass plates were removed from the rack and cleaned.

B IAXIAL F LEXURE S TRENGTH
After pretreatment, the rack and plates were moved to the second pot furnace which was filled with molten potassium nitrate and held at 450˚C.
I ON -E XCHANGE AT F LAW S URFACE
These scored plates were then ion exchanged and re-scored and broken perpendicular to the original score. This made it possible to observe flaws created by the original nick without looking at a surface that was also undergoing ion exchange. The backscattering mode was used to observe the ion exchange profile and EDS was then used to characterize it.
To make the profiles easier to see, 5% AgNO3 was added to the KNO3 molten salt. Silver atoms are much heavier than any other atom in the glass and provided much more contrast under backscatter and a more easily identifiable ion exchange profile. The ion exchange rate is slightly different for a silver exchange rather than a potassium exchange, but was not important for this application.
I ON -E XCHANGE M EDIUM ON F LAW S URFACE
RESULTS AND DISCUSSION
L ARGE F LAW E FFECT
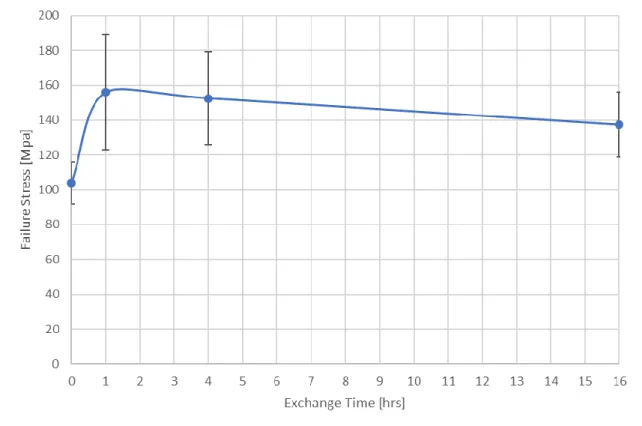
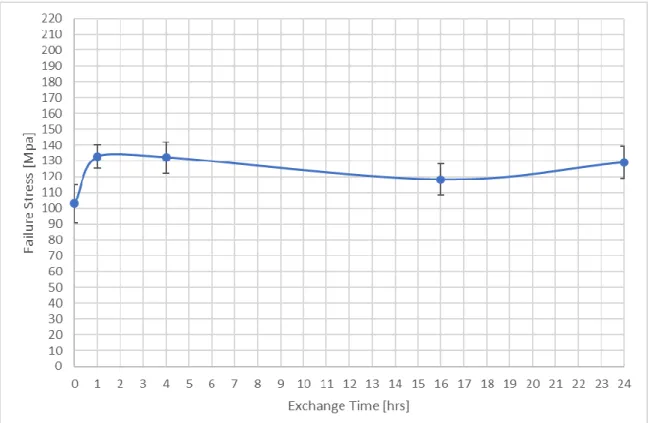
The overall effect, however, will be a large initial strengthening and then continued strengthening at lower rates. There was an expected initial jump in mean strength from the ion exchange deficiency treatment (104 MPa) to 1 h treatment (156 MPa). Continued ion exchange treatment led to lower and lower average strengths that eventually decreased to 137 MPa at 16 h of ion exchange treatment.
It could be argued that there is too much overlap to be considered a weakening effect, but it is indeed a departure from the expected trend of ion exchange amplification. This deviation can be characterized at this point as allowing initial enhancement and then inhibiting enhancement for longer ion exchange treatment. This led to further investigation into this effect, which began to determine whether it could be caused by stress relaxation occurring during the ion exchange treatment.
S TRESS R ELAXATION D URING T REATMENT
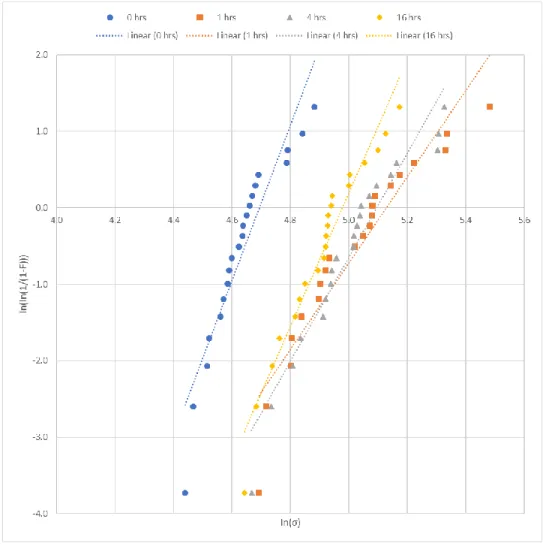
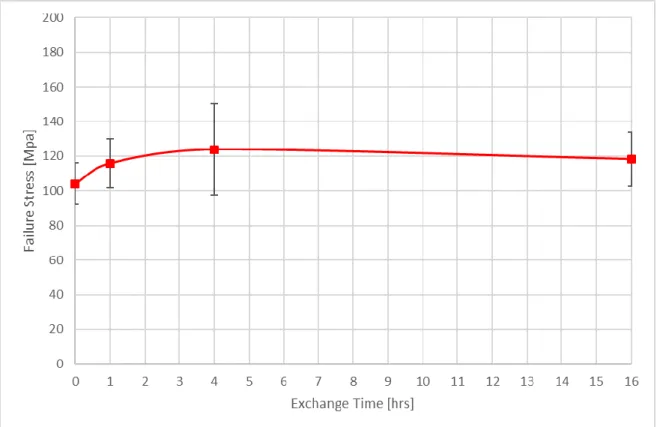
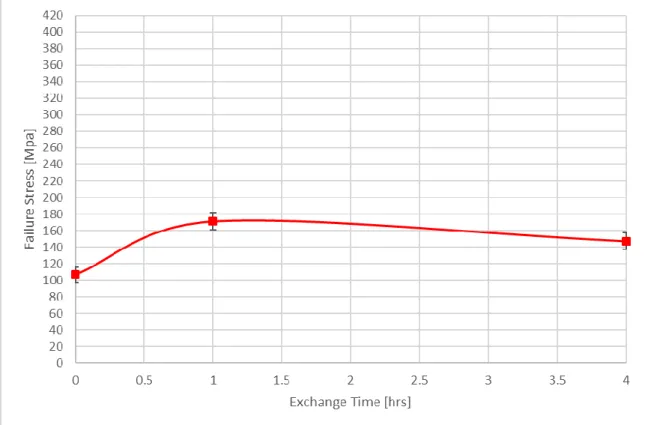
Now this could be characterized as a weakening effect, but the data resulted in large standard deviations and relatively low Weibull moduli. Changing the temperature did lead to a significant change in the data collected and the trend produced from that data. Strengthening did continue to increase up to 4 hours of treatment, peaking at 123.86 MPa, but then dropped to 118.31 MPa for the 16-hour ion exchange.
When analyzing this effect, it is important to keep in mind that ion exchange is also a temperature-dependent process. At higher temperatures, the diffusion rates of ion exchange are higher, meaning the overall ion exchange rate will be higher. These data show that no stress relaxations occurred during the ion exchange treatment and are therefore not the cause of this large error effect.
M OLTEN S ALT B ATH C ONTAMINATION
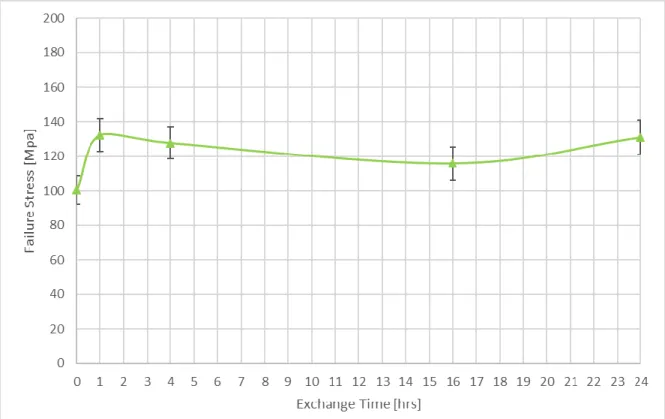
The shift in data from lowering the bath temperature is thus explained by lower diffusion rates delaying the effect previously observed with the higher bath temperature. Again, the highest standard deviation is exhibited at the peak power, this time in the 4-hour treatment sample. The glass initially strengthened as expected and again showed the same trend, peaking early at 132 MPa for the 1-hour replacement treatment and dropping to 116 MPa for the 16-hour replacement treatment.
Interestingly, the 24-hour sample presented another aspect of this large flaw effect with the strength returning to 131 MPa. Changing the molten potassium nitrate bath and eliminating any contamination significantly reduced the variation in performance, but did not remove the large defect effect. Data collection for the 24-hour exchange treatment also showed that this effect is then overcome in very long treatment periods.
S TRESS R ELAXATION D URING P RE -T REATMENT
The same sample manufacturing process was used for both pretreatment temperatures as used previously for indentation, preheating, ion exchange, biaxial bending testing. Changing the pretreatment temperature to 200˚C did not cause any significant difference from the data collected with the 400˚C pretreatment. Changing the pretreatment temperature to 500˚C resulted in significant changes in the obtained power data compared to the 200˚C and 400˚C pretreatment data.
The overall strength was significantly higher for the same ion exchange treatment after 500˚C pretreatment than after the previous two pretreatment temperatures which were very similar to each other. The large error effect persisted for both changes in pretreatment temperature and was magnified by the higher pretreatment temperature. The elevated temperature pretreatment does show that if stress relaxations occur after defect introduction and before ion exchange that higher strengths are obtained, and the large defect effect is increased.
F LAW S IZE E FFECT
The sample set with an indentation load of 500 g showed the trend of initial strengthening and then weakening as the ion exchange time increased. The 200 g indentation sample set did not result in the same trend as all previous data and followed the trend expected from the ion exchange process. The standard deviations were slightly higher than previous data, but there was no overlap in the data between the ion exchange treatments and the Weibull moduli were relatively high.
The 500g indentation load sample set was generally stronger than the 1000g set but the large error effect persisted, with enhancement peaking after 1 hour of ion exchange treatment and declining after 4 hours. The 200g indentation load sample set was even stronger overall as expected, but did not show the same trend. Normal potentiation was shown with an initial large jump in potency at 1 hour of ion exchange treatment and slower but continued potentiation at 4 hours of ion exchange.
I ON -E XCHANGE M EDIUM IN S URFACE F LAWS
SUMMARY AND CONCLUSION
The resulting strength data and sample were used to investigate the effects that large surface defects in the glass can have on the ion exchange process. The first sample set showed a trend where the ion exchange treatment initially strengthened the glass and then was inhibited over longer ion exchange times. This showed that no stress relaxation takes place during the ion exchange treatment and therefore could not cause this effect.
The ion exchange bath was replaced and the same data was collected for indented and replaced glass plates for and 24-hour treatments. 500˚C to get closer to the annealing point of the glass without getting too much higher than the ion exchange treatment temperature. It was then proven that after the glass is ion-exchanged, cleaned and crushed, the ion-exchange medium is still on the defect surfaces.
34;Strength Degradation of Glass Impacted with Sharp Particles: I, Annealed Surfaces." Journal of the American Ceramic Society. Vickers Indentation Fracture Toughness Test Part 1 Review of Literature and Formulation of Standard Indentation Toughness Equations. 34;Residual Stress Effects in Sharp Contact Cracks, Part 1 Indentation Fracture Mechanics ." Journal of Materials Science.
34; Symmetrical bending of thin circular elastic plates on point supports equidistant from each other. National Bureau of Standards Journal Of Research 71C: 1-10.
APPENDIX