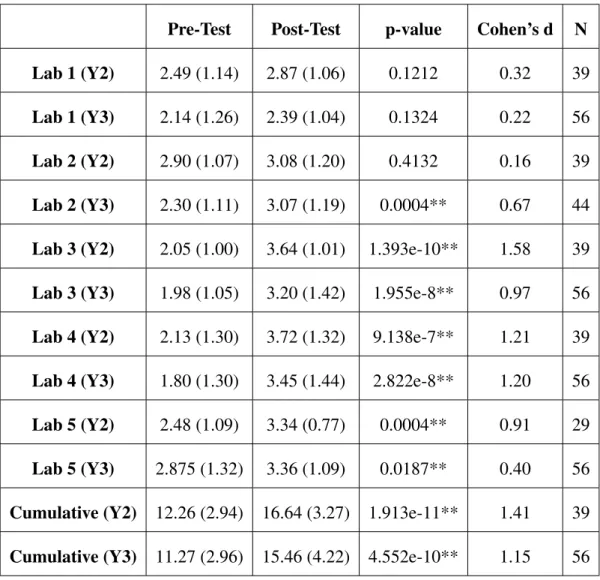
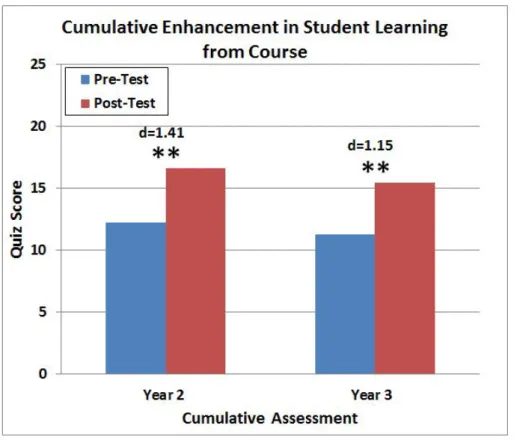
Significant differences in quiz scores from the paired t-test are indicated by a ** at α =0.05 and a * at α =0.1, and the corresponding p-values are shown in Table A.2 in Appendix A The effect size, d, between the two means is shown above the bars. Significant differences in quiz scores from the paired t-test are indicated by an ** atα =0.05 and a * atα=0.1, and the corresponding p-values are shown in Table A.5 in Appendix A. The effect size, d, between the two means is shown above the bars.
Background and Motivation
The Role of Haptics in Education
This is due in part to some of the challenges mentioned above, particularly the high costs associated with haptic devices. By incorporating knowledge of haptics and engineering, this work aims to increase understanding of the potential benefits haptic devices have in education.
Related Work
Haptics in K-12 Education
They conducted pilot studies asking users to rate the software's ease of use and rate its effectiveness in helping students learn or review simple machines. In another study, the Phantom Desktop was combined with simulations to teach middle school students concepts related to centripetal forces and gravity, although the results from this work were very preliminary and only qualitatively assessed the device's usability and engagement [99].
Haptics in Engineering Education
A recent example of a haptic device implementation in engineering education was the implementation of a haptic paddle, a single DOF force feedback device used in teaching system dynamics [ 44 , 65 ]. With the exception of [65], all other studies used commercially available haptic devices in combination with custom software.
Haptics in Math Education of the Visually Impaired
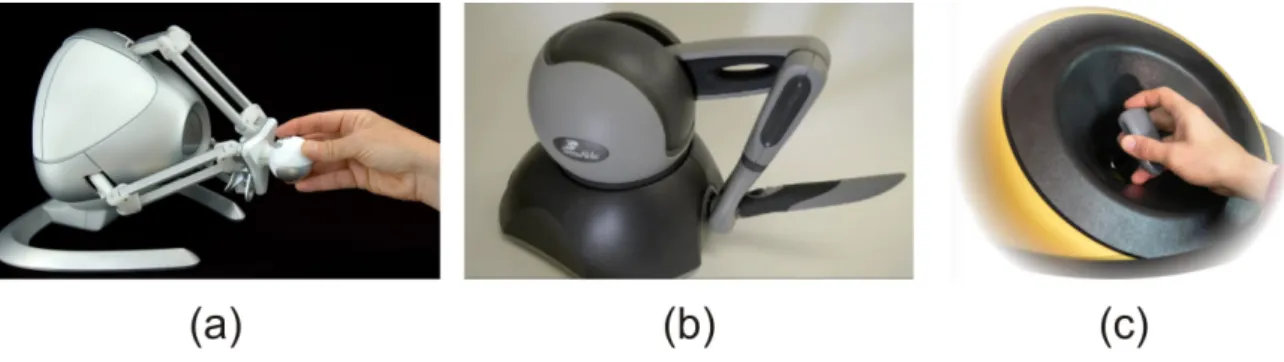
A 7200 pin array refresher device (see Figure 1.4(a)) capable of detecting multiple contact points was also developed in the HyperBraille Project [4], although the cost and commercialization of this device are unclear. Portability and durability to the wear and tear that students will impose on the device, both of which are significant challenges for many existing pin array designs, are also important in classroom applications.
![Figure 1.4: Three examples of haptic devices that have been developed for graphical display for the blind: (a) A refreshable pin-array device [4], (b) A tactile mouse called the VT Player (VirTouch) [5, 71], and (c) Force feedback devices, such as the Phan](https://thumb-ap.123doks.com/thumbv2/123dok/10729878.0/33.892.216.781.149.840/figure-examples-devices-developed-graphical-refreshable-virtouch-feedback.webp)
Dissertation Overview and Contributions
Creation of educational materials is enhanced by modifying existing curriculum associated with the haptic paddle. Additionally, we supplement previous qualitative assessments that evaluated students' perceptions of the value of the haptic paddle labs with a formal assessment.
Haptic Paddle Hardware and Software Enhancements
- Mechanical Design Enhancements
- Low-Cost Electronics and Computer Interfacing
- Matlab/Simulink Control Software
- Updates to the Original Stanford Laboratory Curriculum
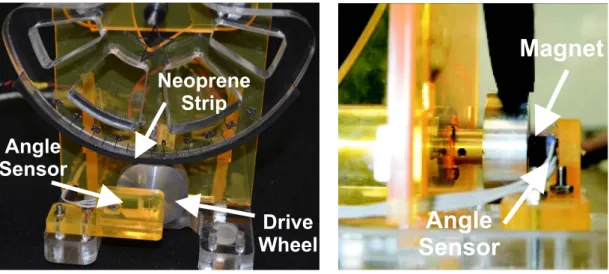
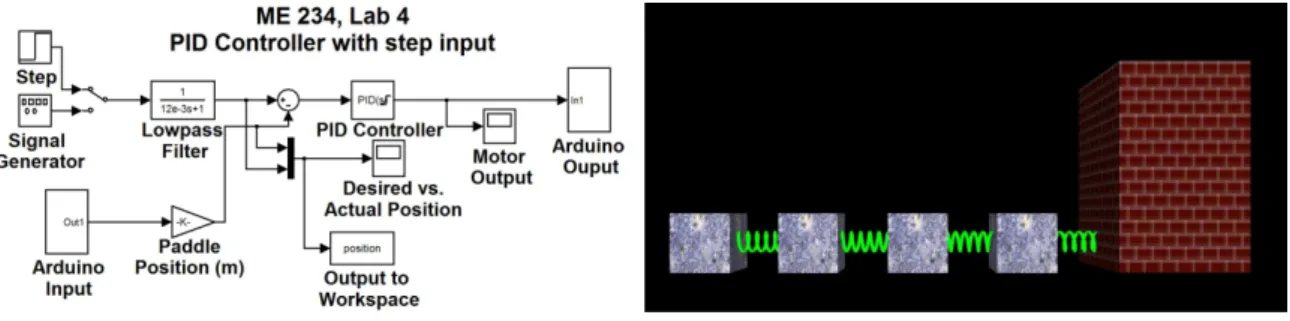
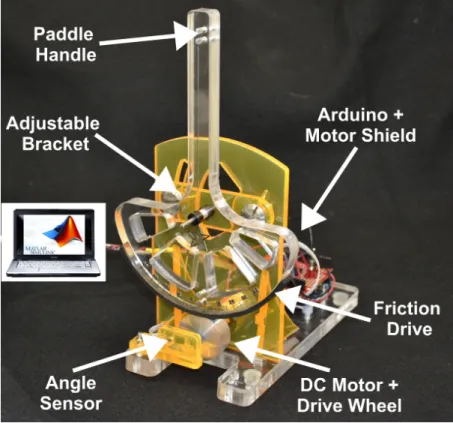
In Simulink, the position and velocity of the oar handle are calculated and the desired forces are calculated. The friction drive consists of a strip of neoprene rubber glued to the bottom of the paddle handle, which rolls in contact with an aluminum drive wheel attached to the motor shaft, as shown in Figure 2.3.
A Formal Assessment of Student Learning: Methods
Research Questions
Statistically, we were interested in determining whether there was a significant increase in the average quiz score between the beginning and end of the semester. Statistically, we were interested in determining whether there was a significant increase in the average quiz score from the beginning of the semester to after completion of the lab.
Verification of Normality and Comparable Student Sections
From the Y2 data, we observed no significant differences at the 95% confidence level (α =0.05) between any student sections' cumulative pretest score, but found a significant difference between section 1 and section 4 on the Lab 5 section . of the pre-test (p-value = 0.04), with section 1 having a significantly higher average on this section of the material. Again, only section 1 data was omitted because there were no significant differences between any combination of sections 2, 3, and 4 scores on the Lab 2 portion of the pretest.
Formal Assessment: Results and Discussion
- Educational Benefit from Course
- Educational Benefit from Lab
- Educational Benefit of Other Learning Opportunities
- Summary of Results
A similar trend was observed when looking at the effect size of differences in quiz scores after completing the laboratory activity. Specifically, looking at pre-test versus post-lab scores, we observed that students scored significantly higher on all 5 lab quizzes in one of the three years of data collection.
Conclusion
This may be due in part to the fact that most currently available commercial haptic devices provide force feedback. The work presented in this chapter was published in The Proceedings of the IEEE WorldHaptics Conference 2011 [84] and has been submitted for publication in the Journal of Special Education and Technology [40].
System Description
- Overview of Touchscreen Classroom Concept
- Hardware: Touchscreens
- Haptic Feedback Characterization
- Haptic and Aural Exploration Software
These devices are specifically designed for portability and durability, are already on the commercial market, and share a small number of common operating systems (eg the Android operating system), meaning that software can be widely and rapidly distributed through stores of web applications. Our software uses Immersion's TouchSense API and consists of a multi-threaded C++ application built on the open source user interface (UI) framework Qt (Nokia, Oslo, Norway).
Experimental Methods
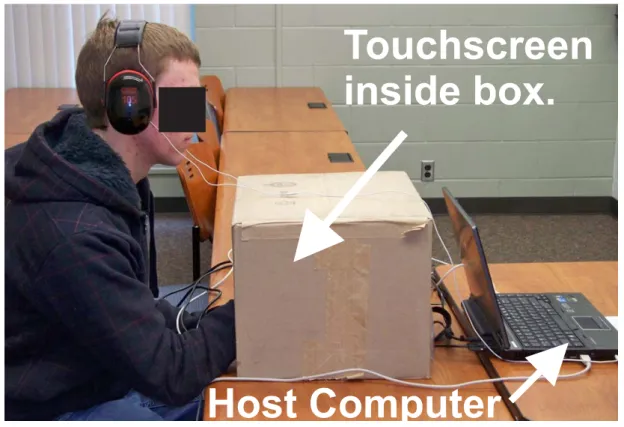
User studies were first conducted on sighted individuals (N = 10, mean age 27 years, two left-handed, two female). During all experiments, the touch screen itself was shielded from the user's view by a box with an opening on the front that allowed them to touch the touch screen without being able to see it (Figure 3.3).
Point/Coordinate Experiment
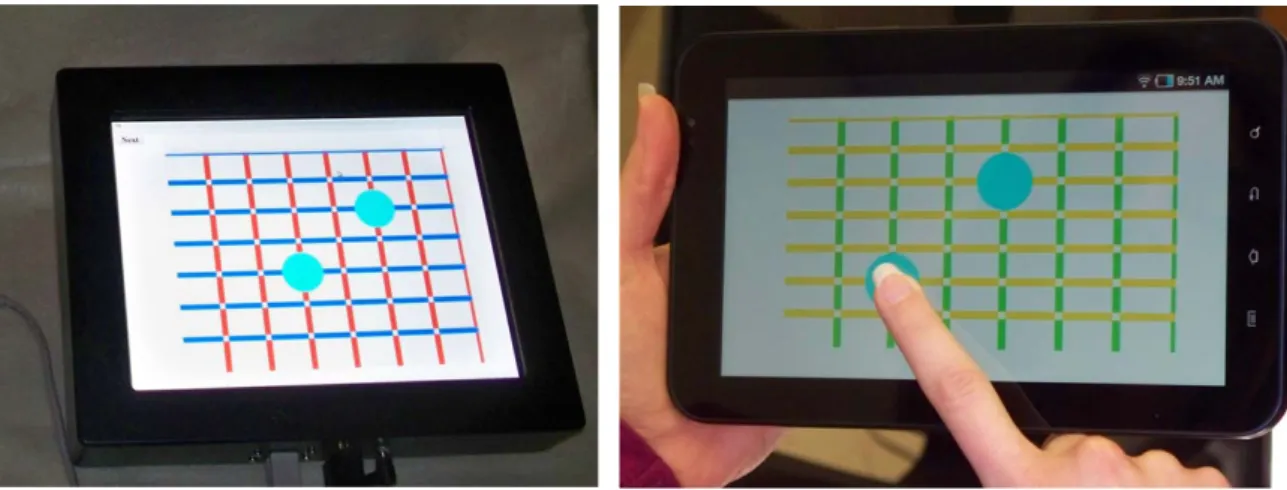
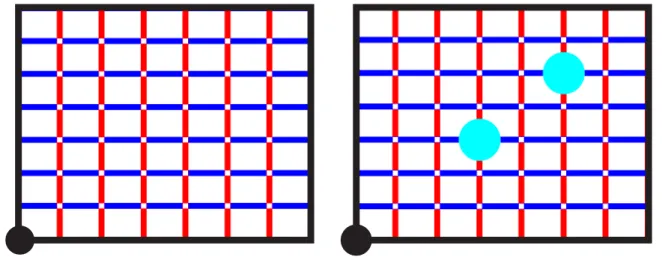
- Experimental Setup and Grid Display
- Finding a Desired Grid Intersection
- Identifying a Displayed Point
- Point/Coordinate Experiment Discussion
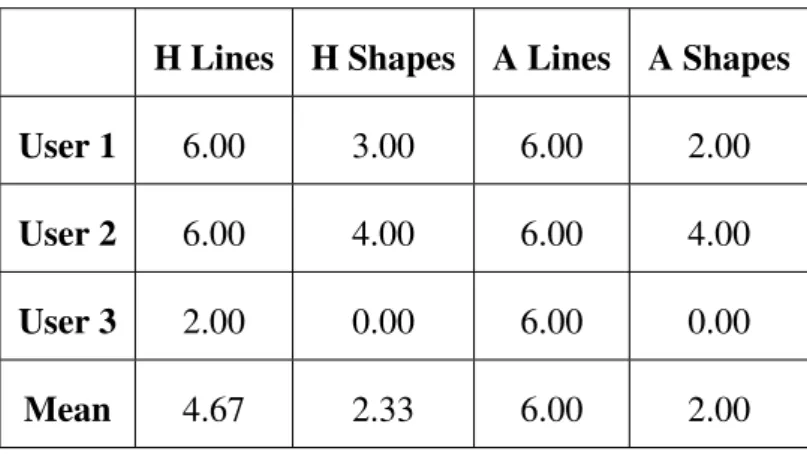
During this part of the training, the experimenter gave verbal feedback to the user about whether the grid size was determined correctly or not. The mean and standard deviation of the correct number of locations (out of 3) found by sighted users on both the haptic and auditory grids are presented.
Shape/Line Experiment
Shape/Line Experiment Discussion
We suspect that shape identification was more challenging, partly because some users used ineffective exploration procedures (no specific exploration procedure was suggested or prescribed in our experiments). Successful users often looked for angles, but not all users realized that angles were a good way to distinguish between different shapes.
Pilot Studies with Blind Students
Participant Feedback
In the words of one blind student, "It would really help to have something like this because it makes us equal to everyone else." One teacher remarked: “One of these haptic tablets would allow them [students] to proceed much better [in class].
Conclusions and Future Work
Contributions
Our simulation enables modal shape prediction of variable friction touch screens of any size, with any number and location of piezoelectric actuators. The simulation allows rapid prediction of the placement of knot lines on the surface and can be used to guide the design of variable friction touchscreens.
Modeling of Coupled System
Assumptions
The deflection of the mid-plane is small compared to the thickness of the plate. Assumptions of the piezoelectric actuator itself, in terms of polarization directions and electric fields, are also stated in [45].
Plate and Piezoelectric Actuator Model
Finally, the electromechanical coupling matrix, Θ, is defined, which gives a relationship between the voltage applied to the piezo actuator and the plate displacement.
State Space Model
Methods
Model Implementation
The resonant modes of the system are identified from the frequency response of the coupled system by observing the peaks in the bode plot within the range 20-40 kHz. The modal response of the coupled system at these resonant frequencies is then calculated by multiplying the eigenvectors of the system by the assumed modal shape function at each output position.
Boundary Conditions
In our simulation, we chose to include all modes that were at least twice the highest frequency of interest (40kHz), but not higher to ensure fast computation. Slab displacement was calculated at 40×40 locations, evenly spaced on the slab, providing enough output locations to capture accurate representations of modal shapes.
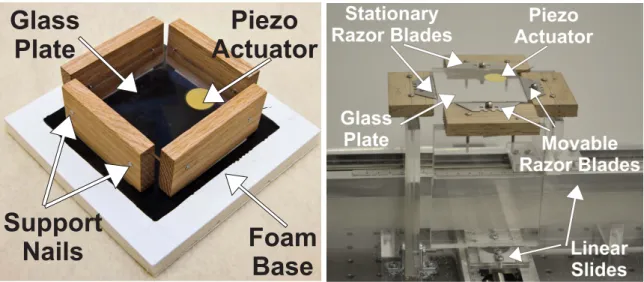
Experimental Setup
This was done using four thin blades that contacted the plate edges, one on each side. For example, if the razor blades are pressed very tightly against the plate edges, the strength of the mode.
Validation Experiments and Results
Frequency Response Validation Experiment
This corresponds to the four experimentally observed resonance modes, indicated by the peaks observed in the frequency response. We note that the strength of these resonance modes, indicated by the magnitude of the peaks in the bode plot, differs slightly between the experimental and simulated cases.
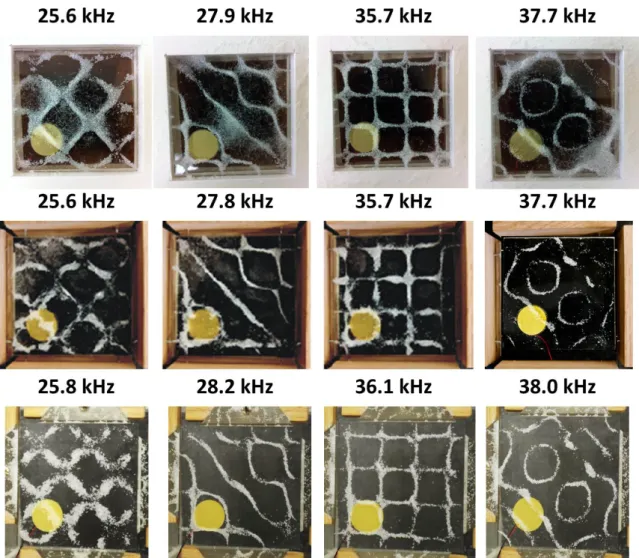
Modal Shape Agreement Experiment
We also note that the frequencies at which we experimentally observed resonance modes differ slightly from the frequencies in the experimental Bode plot (Figure 4.4). This is likely due to the fact that although the accelerometer was small, its extra mass may have caused some shift in the resonant frequencies themselves.

Experiments Demonstrating Simulation Flexibility
Case 1: Multiple Piezoelectric Actuators
The results are shown in Figure 4.6 (bottom) and demonstrate the effectiveness of the simulation in the case of multiple piezos. Nevertheless, this experiment demonstrates the effectiveness and flexibility of the simulation in predicting the modal shapes that can be excited in the case of multiple piezos.

Case 2: Thicker Plates
This is just one example of many of the value a simulation provides by knowing in advance the modal shapes that will be generated from a specific design. We again observe a qualitative good alignment with respect to the predicted modal shapes compared to those we observed experimentally.
Discussion
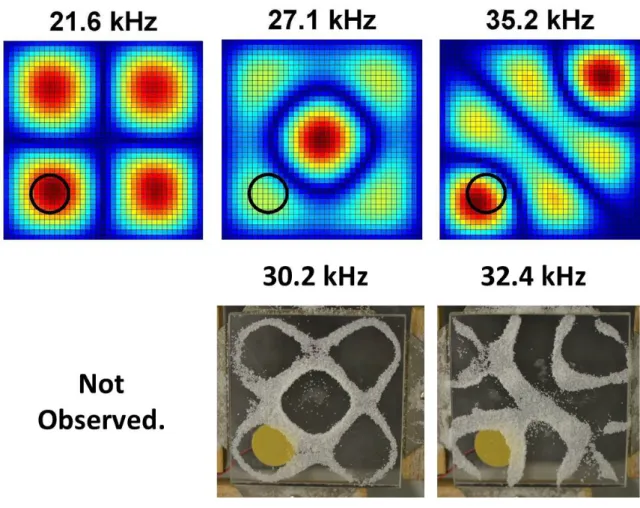
First we ran our simulation, changing the thickness of the plate and locating the piezo one diameter from each plate edge in the corner of the plate. The piezoelectric elements are the gold circles in the experimental images and the black circle in the simulation images.
Conclusion and Future Work
These improvements have reduced the price of the haptic paddle to less than $100 including all components and electrical. Second, one of the main advantages of the haptic paddle is that it can be used to simulate multiple dynamic systems.
Vibratory Touchscreens in Math Education for the Blind
This type of formal assessment in multiple locations would be beneficial for broadly validating the learning benefits of haptic interfaces such as the haptic paddle and encouraging wide adoption of such a device. Investigating how to enable edge detection using superimposed vibrations or a combination of vibratory and auditory feedback will be interesting challenges to explore in future work.
Variable Friction Touchscreens
Variable friction touchscreens have the potential to provide more realistic and rich feedback to users by enabling them to perceive changes in friction on the plate surface. An equally promising direction is to use combinations of resonant modes to explore how we can create complex geometries on a slab surface.
The Future of Haptics in Education
Depending on the length and rotational inertia of the pendulum, and the acceleration of gravity. Proceedings of the 14th Symposium on Haptic Interfaces for Virtual Environment and Teleoperator Systems (HAPTICS 06), pp.