EFFICIENCY IN ISLAMIC BANKING:
A NON-PARAMETRIC APPROACH
Umi Karomah Yaumidin1
A b s t r a c t
1 Umi Karomah Yaumidin is researcher at Research Centre for Economic √ the Indonesian Institute of Sciences (RCE-LIPI), [email protected]
Penelitian ini bertujuan untuk membandingkan tingkat efisiensi bank-bank Islam di kawasan Timur Tengah dan Asia Tenggara. Hal ini didasari pada kegagalan perbankan yang mendorong terjadinya krisis keuangan domestik maupun international dalam dasawarsa terakhir. Efisiensi perbankan akhirnya menjadi perhatian penting tidak hanya di Asia setelah krisis di tahun 1997, namun juga di belahan dunia lainnya.
Disisi lain perkembangan bank-bank Islam kiranya telah dianggap sebagai alternatif solusi untuk menuju perbankan yang sehat. Dengan demikian, studi tentang efisiensi bank-bank Islam menjadi kajian menarik, terutama perbandingan efisiensi antar kawasan. Dalam paper ini digunakan metode non parametrik Data Envelopment Analysis (DEA) untuk mengukur efisiensi skor data panel yang mencakup empat puluh delapan bank Islam selama kurun waktu 2000 hingga 2004. Pendekatan yang digunakan dalam paper ini adalah pendekatan intermediasi yang dianggap paling sesuai dengan prinsip-prinsip sistem keuangan Islam.
Secara keseluruhan, hasil perhitungan menunjukkan bahwa bank-bank Islam di Asia Tenggara sedikit lebih effisien dibandingkan bank-bank Islam di Timur Tengah. Salah satu penyebabnya adalah tragedi 9/11 di tahun 2001 dan perang Iraq yang berlangsung di tahun 2002. Oleh karena itu dapat disimpulkan bahwa bank-bank Islam masih sangat tergantung pada sistem keuangan dan segala bentuk peraturan perbankan yang berlaku baik di tingkat nasional, regional maupun global, serta karakteristik perbedaan resiko yang berkonsekuensi pada perbedaan regulasi prudential sangat menentukan fluktuasi skor effisiensi.
Keywords: Efficiency, Islamic banking, Data Envelopment Analysis (DEA) JEL Classification:
JEL Classification:
JEL Classification:
JEL Classification:
JEL Classification: D61, G21, C14
I. INTRODUCTION
The rapid globalization has created a more volatile global market place (Lee, 2002) and increase inter-dependency among the countries. This phenomenon potentially leads any country to be more susceptible to the shock or crises experienced by other countries. On the other hand, this will increase the risk of the international financial transactions and domestic financial management complexities. Along with these, the policy makers should become more cautious on how their national economies will be affected and how to manage the risk and complexities better. Due to these concerns, the banking efficiency has become one of the major issues.
The previous Asian financial crisis, 1997, for instance has brought a deep research and truly ignited the debates on the importance of the banking efficiency. Many economists believe the banking failure caused the financial crisis in Asia; started with the short term liquidity problem created by the international financial markets. Furthermore, as indicated by Radelet and Sach, the Asian crisis was not a macroeconomic problem but a structural problem, in which the most severely hurt countries like Indonesia, Thailand and Korea share a common structure on their financial sector, (Radelet and Sach, 1998). On his study the author also argued that the source and the usage of the funds are more important than the current account deficit itself.
Along with this globalization, the emerging of the Islamic financial institution appears as a new phenomenon. In a current world dominated by western capitalism, the Islamic finance may appear as a novice, regardless its rich history on facilitating the trade and economic transactions in the past age. Eclipsed by the rise of Western colonialism and capitalism, the Islamic finance remained dormant until the resurgence of Islam recently. The Islamic financial services industry has witnessed a frenetic pace of growth during the last decade. While the estimates about the size differ across sources, a conservative estimation put the total assets of Islamic financial institutions at US$230 billion. The Islamic financial institutions operate in over seventy-five countries and are expected to grow at over fifteen percent during the next five years (Obaidullah, 2005).
Initially, the growth of the Islamic finance coincided with the current account surpluses of the oil-exporting Islamic countries especially in Middle East, (Iqbal, 1997). However, its continued growth in the face of eroding oil revenues reflects the influence of other factors, such as the desire for socio-political and economic systems based on Islamic principles and a stronger Islamic identity. Some countries have transformed their banking system to the Islamic models, albeit they may have minor Moslem dwellers. Common motivations to adopt this system is because of the Islamic bank model is not pure profit maximization oriented and its risk sharing nature.
In general, the transition of a developing growth economy (DGE) to a full-fledged market based economy (MBE) requires many structural changes, where the reform of the banking
sector will potentially be the key. This raises a substantive issue on identifying the banking system which suits the developing economies (Ghannadian et al., 2004). On the Islamic bank case, the question would be whether the Islamic banks structure has been an answer to the structural transition, or not. Furthermore, are they only as a temporary action to overcome specific situation, such as financial crises in South East Asia and Middle East? Could the Islamic banking compete with the conventional banks?
The oil-rich states experience a huge inflow of fund after the rising of oil prices. This leads to a huge growth of wealth in all oil-rich country, especially in East Asia and the Middle East. At the same time, the increase of the fund will influence the financial sector on general of these countries. Almost US$1 trillion worth of funds are being managed by world wide Islamic institutions and about US$400 billion is held by 300 numbers of Islamic banks.
The specific characteristic of the observed country in Middle East and South East Asia may differ and potentially influence the structure and performance of their banking sector. The bank size and the size of the economy are important variables (Bashir, 2001; Casu and Molyneux, 2000), where a low income economy may face a lower competition level relative to the rich country. Focusing on the Islamic banking, the share of Moslem population may play important role on the Islamic banking.
Countries Number Number of Population GDP Per- Average Total
of Banks capita (US$) Assets (Million
US$)*
Table III.1
Characteristic of the Middle East Countries and Its Islamic Banks
Middle East 1. Uni Emirate Arab 2. Bahrain 3. Qatar 4. Jordan 5. Kuwait 6. Saudi Arabia 7. Oman 8. Lebanon
4 28 2 3 5 17 1 2
2,407,460 Muslim 96% (Shi'a 16%), Christian, Hindu, and other 4%
725,385 people Islam 100%
863,051 (July 2005 est.) Muslim 95%
5,439,952 people Islam (94%), Christian (6%) 2,459,534 people Islam (85%), Others (15%) 23,200,000 people Islam (100%)
3,001,583 people Ibadhi Muslim 75%, Sunni Muslim, Shi'a Muslim, Hindu 3,826,018 (July 2005 est.) Muslim 59.7%
(Shi'a, Sunni, Druze, Isma'ilite, Alawite or Nusayri), Christian 39% other 1.3%
$25,200 (2004 est.)
$19,200 (2004 est.)
$23,200 (2004 est.)
$4,500 (2004 est.)
$21,300 (2004 est.)
$12,000 (2004 est.)
$13,100 (2004 est.)
$5,000 (2004 est.)
3,287 9,377 1,738 6,367 2,173 15,615 4,818 1,141
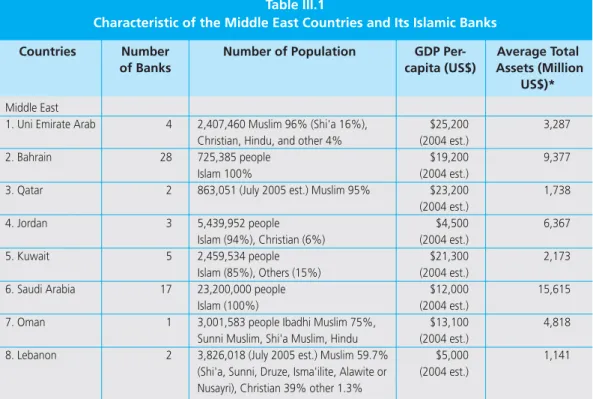
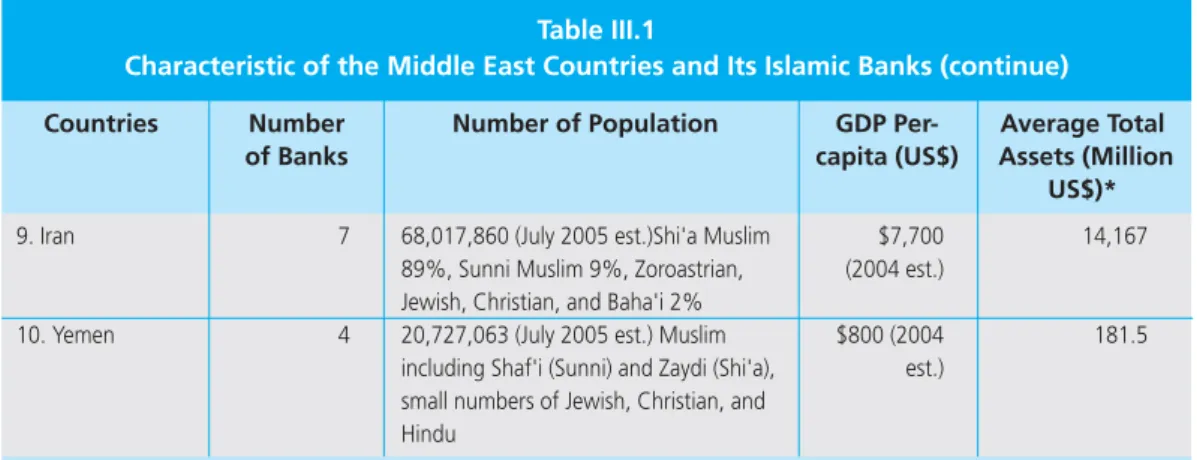
Bahrain has the largest number of Islamic banks. This is not surprising as Bahrain is the premier country, which promotes Islamic banks in the Middle East, followed by Saudi Arabia, Kuwait and Jordan. Cross country cooperation is commonly conducted by a private enterprise venture where the major private shareholders are from Saudi Arabia, Kuwait, the United Arab Emirates and Malaysia.
Saudi Arabia has the largest Muslim community, thus as predicted, this country has the highest demand for Islamic banks services in the Middle East region. The total asset of the National Commercial Bank (NCB), the largest bank in Saudi Arabia, is more than 80 times than the Yemeni banks, (The Banker, 2002). With a total asset of SAR 24 billion, the NCB is the largest provider of Islamic funds in the world.
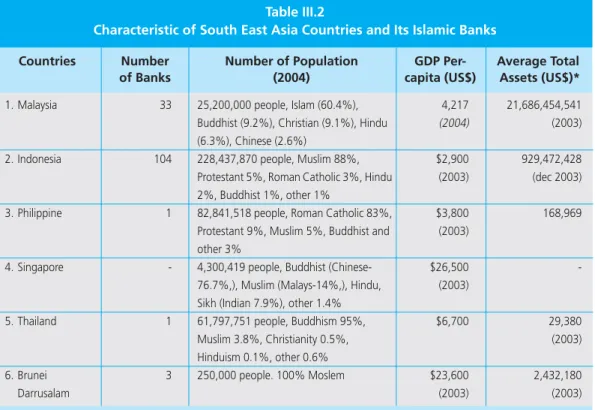
In South East Asia, Malaysia Islamic Bank has the largest average total asset. The banking industry in Malaysia consists of 33 banks; 2 Islamic banks and 31 conventional banks. During 2002-2003, the total capital base of the Islamic banking increased from RM5.1 billion to RM6.8 billion, (Annual Report of Central bank of Malaysia, 2005). Recently, Malaysia continues leading some initiative to support the establishment of Islamic banks in this region. Not only supporting the research and development, Malaysia also proposed the establishment of institutions such as Islamic Financial Services Board (IFSB) and IIFM to develop international prudential regulatory standards in accordance with the distinct features and risks of the Islamic financial institutions.
In Indonesia, the central bank of Indonesia has formulated The Blueprint of Islamic Banking Development of Indonesia, (Bank Indonesia, 2004). During the period of 1998 -2001, the total asset of the sharia2 banking system has a rapid annual growth at 74% from Rp 479 billion to Rp 2.718 billion. At the same period, the third party fund also increased from Rp 392 billion to Rp1.806 billion.
2 Sharia bank is a bank running based on the Islamic concept. The bank does not necessarily a formal Islamic bank.
Countries Number Number of Population GDP Per- Average Total
of Banks capita (US$) Assets (Million
US$)*
Table III.1
Characteristic of the Middle East Countries and Its Islamic Banks (continue)
9. Iran
10. Yemen
Source: Bankscope Database, Mergent Online Database, WDI online databases and other sources
7
4
68,017,860 (July 2005 est.)Shi'a Muslim 89%, Sunni Muslim 9%, Zoroastrian, Jewish, Christian, and Baha'i 2%
20,727,063 (July 2005 est.) Muslim including Shaf'i (Sunni) and Zaydi (Shi'a), small numbers of Jewish, Christian, and Hindu
$7,700 (2004 est.)
$800 (2004 est.)
14,167
181.5
Recently, the sharia system in Indonesia involves 104 institutions at the end of 2004, consists of 3 Islamic banks, 12 conventional banks (Islamic banking units) and 89 Islamic rural banks. In his early stage, the share of the Islamic banking in Indonesia is only 0.26% of the total banking asset. The lack of comprehensive and appropriate framework, limited market coverage due to the lack of public knowledge and understanding, inefficient institutional structure, and operational inefficiency are some of the main problems and calls for better strategies.
The sultanate Brunei mostly populated by Moslems (250,000 people), has nine banks; 3 local bank and 6 branches of foreign banks. Brunei has been keenly promoting the Islamic banking as an alternative to the conventional banking during the past decade.
In Thailand, the idea to establish the Islamic Bank of Thailand was occurred in 1994 when, the Thailand joined the Indonesia √ Malaysia - Thailand Growth Triangle (IMT-GT). In Philippine, the only Islamic bank is the Al-Amanah Islamic Investment Bank of the Philippines, which is owned by government. The response of the public in Philippines, particularly the Muslim population was very favorable and encouraging.
Singapore has the least Moslem population among the South East Asia. In 1990 there were about 350,000 Moslem of 2.3 million total populations. As Singapore is a major financial
Countries Number Number of Population GDP Per- Average Total
of Banks (2004) capita (US$) Assets (US$)*
Table III.2
Characteristic of South East Asia Countries and Its Islamic Banks
1. Malaysia
2. Indonesia
3. Philippine
4. Singapore
5. Thailand
6. Brunei Darrusalam
Source: Mergent Online Database, WDI online databases and other sources, and each countries Central bank website.
33
104
1
-
1
3
25,200,000 people, Islam (60.4%), Buddhist (9.2%), Christian (9.1%), Hindu (6.3%), Chinese (2.6%)
228,437,870 people, Muslim 88%, Protestant 5%, Roman Catholic 3%, Hindu 2%, Buddhist 1%, other 1%
82,841,518 people, Roman Catholic 83%, Protestant 9%, Muslim 5%, Buddhist and other 3%
4,300,419 people, Buddhist (Chinese- 76.7%,), Muslim (Malays-14%,), Hindu, Sikh (Indian 7.9%), other 1.4%
61,797,751 people, Buddhism 95%, Muslim 3.8%, Christianity 0.5%, Hinduism 0.1%, other 0.6%
250,000 people. 100% Moslem
4,217 (2004)
$2,900 (2003)
$3,800 (2003)
$26,500 (2003)
$6,700
$23,600 (2003)
21,686,454,541 (2003) 929,472,428 (dec 2003) 168,969
-
29,380 (2003) 2,432,180 (2003)
service provider in South East Asia, this country may have a larger opportunity by opening his market and establishing the Islamic banking. In 2006, Singapore has prepared to establish an Islamic financial-hub under cooperation with Malaysia, Brunei and the Middle East investors.
One obvious motive is to capture the excess liquidity in Gulf countries.
A comparative study of the efficiency and productivity of the Islamic banks industry in South East Asia and The Middle East is of interest for several reasons. First, banks as financial intermediaries are the conduit for monetary policy to strengthen the soundness and the macroeconomic stability. Second, since 1960 countries around the world have opened their markets and removed barriers in banking industries. This creates a wide opportunity for Islamic banks widely3 to operate and expand domestically or abroad. Finally, the microeconomic transformation has taken place in the business of banking itself, where the Islamic banks has internalized the competitive advantages within their foreign branches instead of only cooperating with their correspondents or independent agents (Haron, 1998).
This paper investigates whether the productive efficiency of Islamic banks in the Middle East and South East Asia has improved from 2000 to 2004 by applying the Data Envelopment Analysis, which capable to analyze how well an individual bank uses its inputs to produce its outputs. The next session will discuss the theory and the methodology will be presented on chapter 3, while the result will be discussed in chapter 4. The last chapter will present the result and suggestions for further research.
II. THEORY
By definition, the financial system efficiency is measured in terms of the efficiency achieved in mobilizing the savings from the savings-surplus units and allocating these funds among savings-deficit units in the economy (Obaidullah, 2005). In general, an increase in the financial assets and instruments varieties would improve the efficiency as the saver or investor has their unique risk-return expectations. The greater the variety of risk-return combinations of the financial assets, the better would be the match between the investor»s preference and the available choice.
The banking efficiency literature distinguishes two types of efficiency; scale efficiency and X-efficiency. The concept of scale efficiency was firstly introduced by Farrell (1957), and defined as the relationship between a bank»s average unit cost and the production volume.
Banks achieve the economies of scale when an increase in outputs is accompanied with a lower
3 For example the Gulf Corporation and Arab Bank operate in all Middle East and Gulf countries except Iran.
unit production cost. The X-efficiency popularized by Leibenstein, refers to the deviations from the cost-efficient frontier that depicts the lowest production cost for a given 1 unit of output, (Leibenstein, 1966).
A more general theory distinguishes 3 types of efficiency; (i) technical efficiency, (ii) allocative efficiency and (iii) scale efficiency. The technical efficiency deals with the possibility of avoiding the wasted resources by producing an optimal output for a given level of inputs, while allocative efficiency deals with the possibility of finding minimal inputs for a given level of outputs (Lovell, 1993). X-efficiency above, stems from technical and allocative efficiency that neither of these two are scale nor scope dependent and thus X-efficiency is a measure of how well management in aligning the technology, the human resources management, and other resources to produce a given level of output.
The technical efficiency refers to the efficiency of transforming the inputs to the outputs, with no reference to prices, (Walding, 2003). Based on this efficiency term, the output vector can be proportionally contracted with a given set of outputs, which makes a radial measure of efficiency, (Farrell, 1957). This means that the technical efficiency is measured from the origin, and not as a difference between the actual performance and the efficient performance.
Essentially, a firm will receive a technical efficiency score of 1 if it produces on the production possibilities frontier, and a less than 1 if it produces beneath the frontier.
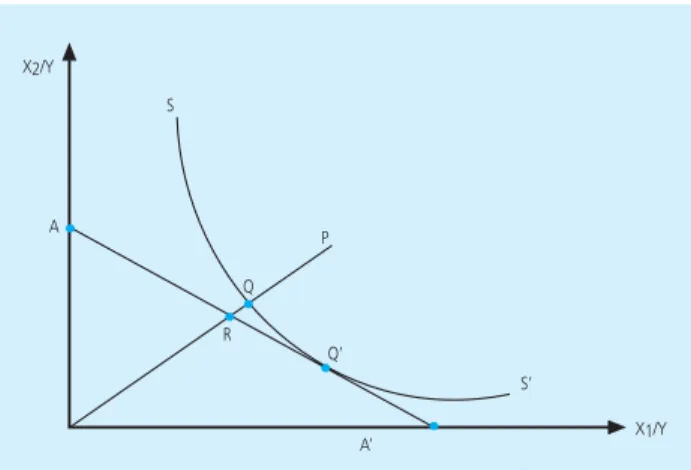
Both technical and allocative efficiency can be explained by the 2 input and 1 output framework described in Figure III.1. The horizontal axis represents the ratio of output Y over input X1 (average product of input 1) while the vertical axis represents the average output of input X2. In this case the isoquant is smooth, which would occur if an infinite number of firms were included in analysis.
Figure III.1 Technical and Allocative Efficiencies
R Q X2/Y
S»
Q»
P S
A
A» X1/Y
In Figure III.1, the technical efficiency is measured by the ratio of the distance from the origin to the point Q over the distance of the origin to the point P. Allocative efficiency is the ratio between the distance between the origin and point R and the distance between the origin and Q. The reduction in production cost that would occur at full allocative efficiency is represented by the distance between R and Q, where full allocative efficiency occurs at the point Q», and the isocost (AA» line) is at a tangent to the production possibilities frontier, which all firms are benchmarked against (SS» curve).
The last form of efficiency is scale efficiency. When a firm is not operating at constant return to scale phase while the full efficiency is assessed in constant return to scale, then the scale inefficiency is (implicitly) included in the technical inefficiency measure.
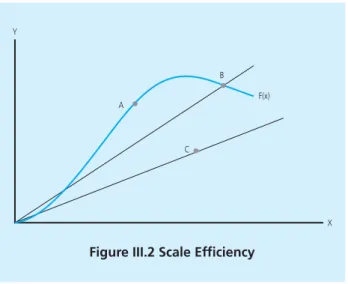
Figure III.2 depict the production level Y as a function of input X. Any straight line from the origin represents the productivity at the rate of Δy/Δx. The full scale efficiency can be achieved when the straight line from origin is a tangent to the production curve, which is occur at point C. At this point, the technical efficiency has been achieved as well.
Figure III.2 Scale Efficiency
A
B
X Y
F(x)
C
The 3 efficiency measures above are an input-oriented efficiency measure, as they measure the efficiency when output is fixed. The input-oriented efficiency is the most suitable when dealing with utilities, (Farell, 1957; Coelli and Perelman, 1996). On the other hand, output- orientated efficiency measure addresses how much quantities of the outputs can be expanded for a given level of input. The output and the input orientated measures are equal on technical efficiency only when constant returns to scale exist (Fare and Lovell, 1978; Coeli, Rao, and Battese, 1998).
In empirical ground, the study on Islamic bank efficiency is rare despite of its significant growth recently (El-gamal and Inanoglub, 2005). The initial development of Islamic banking was in 1961. Since ever, most study only focus on its product variation and its general practice in emerging countries. It turns out that most studies, concern more on the accounting side and the related regulation.
Some studies found that the efficiency in Islamic banks is not too low and its practice is similar to the conventional one, (Aggarwal and Jacques, 1998). Another studies found that the Islamic banks are efficient in their operation (Iqbal, 2001; Samad, 1999; Bashir, 1999; El-gamal and Inanoglub, 2005).
Samad and Hassan (1999) used the financial ratio to analyze the performance of a Malaysian Islamic bank over the period 1984-1997. They concluded that in general the bankers»
lack of knowledge was the main reason for the slow growth of loans under the profit sharing scheme. However, in terms of liquidity and risk measurement, the Islamic bank performs better than the conventional one. Another study by Sarker utilized the banking efficiency model on Bangladesh data. His study showed that the Islamic banks can survive in a conventional banking architecture where the PLS (Profit and Loss Sharing) financing mode is less dominating4. He argued further that the Islamic bank products have a different risk characteristic and consequently requires a different prudential regulation, Sarker (1999).
Using a cross country data during 1998-1999, the study by Yudistira yielded a different result, (Yudistira, 2003). Employing the Data Envelopment Analysis on the Middle East and non Middle East, he found a slightly inefficiency on the Islamic bank during the period of 1998-1999. Further, his study found a very well performance of the Islamic bank after 1999. He also argued a close inter-relationship between the Islamic bank and the conventional one.
However, we argue that the study carried out by Yudistira is questionable due to his sample selection and an extreme difference between the Asian group and Middle East group post the Asian financial crisis. Moreover on his regression analysis, he violated the basic assumption of independence within the sample, (Casu and Molyneux: 2000), on which he should use the bootstrap method.
4 As alternative of interest rate which performs dominantly in conventional banking, Islamic banking relies on profit/loss sharing for purposes of financial intermediation. As a result of from the basic norm of Islamic financial system which is prohibit paying interest.
This is also imply on the organization of an Islamic financial institution which typically has characters; (i) mobilization of funds from savings-surplus economic units (usually household sector) through an array of financial assets (deposit products) and (ii) canalization of funds into profitable projects floated and operated by savings-deficit economic units (usually corporate and government sector).
III. METHODOLOGY
III.1. Methods of Efficiency Estimation
There are 2 options on calculating the efficiency; parametric and non-parametric approach.
The previous is a probabilistic approach and tries to separate the noise from the inefficiencies, while the latter is non-probabilistic and combine the noise and inefficiencies (Lee, 2002). On this study, we choose the so called Data Envelopment Analysis (DEA), one of the non-parametric classes, to analyze how efficient the Islamic banks can locate the opportunities and provide their assets to the borrowers as a measure of efficiency.
III.2. Data Envelopment Analysis
DEA is a methodology directed to the frontiers rather than the central tendencies. It floats a piecewise linear surface on the observation, rather than trying to fit a regression plane trough the center of data. With this perspective, the DEA is adept on uncovering the hidden relationships.
The DEA model is developed by Charnes, Cooper and Rhodes5 using a linear programming technique. It is similar to the microeconomic concept, but it is generated from the actual data for the evaluated firms, (Casu and Molyneux, 2001). In other words, the DEA frontier is formed as the piecewise linear combination that connects the set of «best-practice observations», to construct a convex Production Possibility Set (PPS). With this feature, the DEA is different from the parametric approach, which requires a pre specified functional form of the production or the cost function.
Mathematically, for any possible relationship between variable y and x, the optimal weights of (u,v) can be modeled in the linear programming as follows,
(III.1)
This equation has an infinite number of solutions; if (u*,v*) is a solution, then (α u*, α v*) is another solution. Imposing the constraint v’xi = 1 will transform the model below, from which the multiplier form of the DEA model can be derived:
0
; j = 1,2,...., n 1
max
u,v v'xj u'yj s.t.
v'xi u'yi
u,v
<
>
5 We refer as CCR. See Charnes, Cooper and Rhodes, 1978.
(III.2)
From those equations, the CCR model is defined as:
(III.3)
where θ is scalar and λ is a (Nx1) vector of constants. The value of θ is less or equal to 1, and if θ = 1 the firm is categorized as technically efficient (Coelli, Rao and Battese, 1998).
Since DEA form is a non-parametric frontier, it can cause difficulties in efficiency measurement when the input slack and output slack exist in the model. The excess input (input slack) is the amount of the input inefficiency that is not accounted by the proportional input reductions, while the excess output (output) slack is the amount of the output inefficiency not accounted by the proportional output augmentations, (Lee, 2002). The vector of output slack is denoted by s+ and the input slack is denoted s-.
In order to solve the optimization with inequality constrains, where an increase in outputs or a decrease in inputs will not sacrifice the current inputs or outputs, the CCR model is defined as;
(III.4)
where μ : m x I vector of output weights v : m x I vector of input weights λ : intensity vector
s+ and s- are slack variables
> 0
0 0 min
−y i + Yλ
λ θx i − Xλ
θ,λ θ
s.t. >
>
<
(μ'yi) max
s.t.
u,v
0
,...., 2 , 1
0 ; j = n
v'xi = 1 ,
μ,v μ'yj − v'xj
>
(Y0, X0, μT, νT) : min (μTs+ + νTs-)
- Xλ − s- = −X0. s.t Yλ − s + =Y e CRS
λ,s+,s- >0
In the presence of the slack variable, we can use a multi-stage DEA method to avoid the slack problem (Coelli, 1997). This is one of 3 options available on the DEAP software provided to treat the slack problem (Coelli, Rao and Battese, 1998)6.
In his subsequent papers, Bankers, Charnes and Cooper provide the VRS model, a non parametric as an alternative to the parametric frontier production function analysis, (Bankers, Charnes and Cooper, 1984)7. The differences between CRS and VRS model of DEA is the CRS model do not account the scale efficiency since CRS assume all firms operates at their optimal scale. In contrasts, VRS allows the calculation of technical efficiency devoid of scale efficiencies effect.
The VRS model is:
(III.5)
When the output slack or input slack problem presents on this model, the treatment is the same as in CRS model.
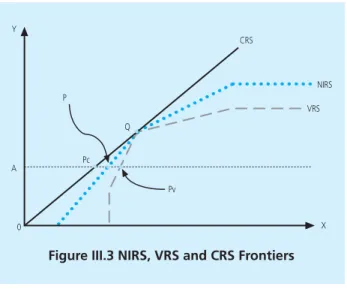
To capture all efficiency measures and the nature of economies of scale, we can impose the non increasing return to scale (NIRS) in DEA specification (Coelli, Rao & Battese, 1998). Figure III.3 shows the difference between the NIRS, CRS and VRS frontiers. Point P is technically inefficient relative to the point Pc on the constant returns to scale (CRS) frontier. When the scale efficiency is taken into account, point P is more efficient than Pv ini variable return to scale (VRS) frontier.
The main advantage of DEA model is its less data requirement. Again, without knowing the specific form of the function, we can asses the efficiency without disaggregating the separate activities and resources. This less required information is helpful when we introduce a cross sectional varieties such as countries with their varied cost structure. On this case, the DEA allows a comparable relative efficiency. Another advantage of DEA is its ability to account for environmental variables, (Coelli, Rao and Battese, 1998).
6 In line with Ferrier and Lovell (1990), Coelli, Rao and Battese emphasis the slack may essentially be viewed as allocative inefficiency, and its score can be provided in the first stage DEA LP. However, they strongly recommended to use the multi-stage method.
7 VRS provides the technical efficiency score, which is greater than or equal to those obtained in CRS model (Coelli et al., 1998). For any particular firm, the difference between the VRS and CRS score yields a pure technical efficiency score, which is free from scale efficiency.
min
−yi + Yλ 0
λ 0
θxi − Xλ 0 θ
N1'λ = 1
s.t. >
θ,λ
>
>
Related to our research goal, analyzing the technical and the scale efficiency is possible either in CRS or other operating condition. The result will be valuable information both in industry and firm level. However the potential measurement errors among the frontier firms could be a problem since the DEA is non-stochastic approach. Another issue is the efficiency score are measured relative to the frontier. We leave these 2 issues out of consideration at this stage, and rely on the transparency of how the model works, altogether the advantages explained above.
III.3. DEA-LIKE Model
The panel data allow the simultaneous investigation of both technical change and the time variation of the efficiency. Malmquist indices8, compare the amount of inputs required for producing a given output level and technology in period t, to the inputs that would have been required to produce the same output level at technology in previous period, (t-1).
A similar method to DEA has been developed to estimate the component distance functions and then calculate the Malmquist TFP change indices, (Fare et al., 1994). These indices are then decomposed into technical change and technical efficiency change (Coeli, Battese, and Rao, 1998). We will briefly outline these process below.
8 The malmquist indices is one method for measuring productivity change over time or between firms. the Malmquist index has some advantages relative to other productivity indices. For example, it does not require input prices or output prices, which makes it particularly useful in situations where prices are misrepresented or non-existent. The Malmquist index does not require the profit maximization or cost minimization assumption. This makes it useful in situations where the objectives of producers differ, are unknown or not achieved, (Lovell (1996), Fare et al., (1994), and Coelli et al., (1998).
Figure III.3 NIRS, VRS and CRS Frontiers
0
A Pc
Q
CRS
VRS
X Y
NIRS P
Pv
The input distance function for firm i with respect to 2 periods, t and s, is defined using Equation (III.6), where St={ (xt, yt) : xt ‡ yt} is the production technology that governs the transformation of inputs for period t, and other variables similar to the previous stated:
(III.6) The distance function above, measures the minimum proportional change in input at period s to make the input-output set, (xs, ys) in period s to be feasible with the technology S t at period t. The Malmquist productivity index comparing periods t and (t + 1) can then be defined using the distance functions,
(III.7)
If we assume there is no technical efficiency then dit(xt, yt)= dit(xt+1, yt+1)=1, and the RHS of Equation (III.7) will only shows the ratio of index change for period (t+1) relative to period t. With this assumption, the Malmquist TFP index can calculate the change index for each observation for any pair of periods being compared. If the index is greater than 1, than there has been an efficiency improvement, vice versa.
However, the above assumption is not realistic, rather we would believe to assume that the firm actually operates below their optimal technical efficiency; hence
(x
t, y
t) and
it
d d
0t(x
t+1, y
t+1) < 1
. On this case, Equation (III.7) will be:(III.8)
where the ratio outside the parentheses measures the change in relative efficiency between period t and t+1, while the geometric mean of the ratios in the parentheses measures the shift in technology between the two periods.
In an empirical application, production technology may varies over time as the result of the best practice technical frontiers, a better production techniques, the new innovations, the financial liberalization or because of higher competition. Dealing with these possibilities, Malmquist index allows us to distinguish the shifts in the production frontier (technological change; how much the shift of production frontier for any innovation or shock) and the
(xs,ys) = min {θ : (ys,θxs)∈ S' } dit
θ>0
mi (yt+1, xt+1, yt, xt)=
(xt, yt)
it
d dit(xt, yt) (xt+1, yt+1)
it
d dit+1(xt+1, yt+1)
mi (yt+1, xt+1, yt, xt)=
(xt, yt)
it
d dit(xt, yt) (xt+1, yt+1)
it
d dit+1(xt+1, yt+1) (xt, yt)
it
d
(xt+1, yt+1)
it+1
d
movements of banks towards the frontier (efficiency change; how much a bank gets closer to the efficient frontier, i.e. catching up or falling behind). Indeed, Equation (III.8) above simply state that the Malmquist TFP change index is simply the product of efficiency change and the technological change.
Following Fare et al. (1994), four linear programming problems must be solved by the firm for 2 states of period:
(III.9)
(III.10)
(III.11)
(III.12)
Relax the CRS assumption and adopt the more realistic VRS, we are able to decompose efficiency change index into the pure-efficiency change and the scale-efficiency change components. Pure-efficiency change index measures the changes in the proximity of firms to the frontier, devoid of scale effects, while the scale-efficiency show whether the movements inside the frontier are in the right direction to attain the CRS point.
Fortunately, the computer program DEAP Version 2.1 (Coelli, 1996) can provide all above measurement types; (i) changes in constant return to scale technical efficiency, (ii) changes in
θ,λ
= minθ
−1
] [
dit(xt+1, yt+1)st −yit+1 + Yt+1λ 0 λ 0
θxit+1− Xt+1λ 0
>
>
>
θ,λ
= minθ
−1
] [
dit(xt+1, yt+1)st −yit+1 + Ytλ 0 λ 0
θxit+1− Xtλ 0
>
>
>
θ,λ
= minθ
]
−1[
dit+1(xt, yt)st −yit + Yt+1λ 0 λ 0
θxit− Xt+1λ 0
>
>
>
[
dit −1= minθθ,λst
(xt, yt)
]
−yit + Ytλ 0
λ 0
θxit − Xtλ 0
>
>
>
technology, (iii) changes in pure technical efficiency (under variable returns to scale), and (iv) changes in scale efficiency and the total factor productivity change. We apply the model with the help of this software on our data, which is explain on the next session.
III.4. Data
We use the panel data to measure the total factor productivity growth during the period of 2000-2004, covering 48 Islamic banks. The data is gathered form the non-consolidated income statements and balance sheets available in London-based International Bank Credit Analysis LTD»s.
Initially the data covers 4 South East Asia countries; Malaysia, Indonesia, Brunei Darussalam and Thailand and 10 Middle East countries; Bahrain, Kuwait, Qatar United Arab Emirates, Jordan, Yemen, Oman, Saudi Arabia, Lebanon and Iran. From 58 banks observed, we then excluded the subsidiaries of the foreign banks, the non-active banks during the observation period, and the central bank institutions. The result is a pooled sample of 48 banks.
The time span was specifically chosen to see the impact of the financial crisis on the efficiency of the Islamic banks. All variables are converted into US dollars using end of year market value to isolate the exchange rate effect, and deflated by the corresponding country»s CPI to exclude the inflation effect. These 2 treatments ensure the comparability to reflect the macroeconomic environment differences across the countries data. Any large discrepancies across countries could be considered as a different banking regulation, (Dietsch and Weill, 1998).
III.5. Selection of Variables
One of the main problems in investigating bank efficiency is its difficulties to define and measure the concept of the bank output, (Casu and Molyneux, 2000). A classic sample is whether the deposit is treated as input or as output of the bank services. On general, there are 3 ways to define the bank»s products; (1) Asset approach, consider the loans and other assets as bank products, while the deposits and other liabilities as banks» inputs, (2) User cost approach consider products as any entry that yields a higher return or lower loss than its opportunity cost, and (3) Value added approach, consider all assets and liabilities of the bank as product, and any items with higher returns is considered as the main products, (Berger and Humphrey, 1993).
Among the 3 approaches, the intermediation approach may be the most appropriate one to evaluate the entire financial institutions because it includes the interest expenses, which often account for one-half to two-thirds of the total costs. Ignoring this significant cost may yield an unreliable result, (Humphrey, 1985; Berger and Humphrey, 1997; Molyneux et al., 1996; Mester,
1996). Unlike the production approach that measure the output of the bank based on the amount of accounts, rather the intermediation approach use their value. Another reason why we choose the intermediation approach is the nature of the Islamic banks, which is often claimed as a joint stock firms hence their shares are highly tradable (Dar and Presley, 2000).
The principle beneath the Islamic financial system is the enterprise participation in employing the funds based on PLS (Profit and Loss Sharing) mode. This study reflects the standard intermediation approach, in which the capital and the labor are used to intermediate the deposits into the loans and other earning assets. Specifically, the capital input is represented by the fixed assets, while the labor input is represented by the overheads expenses; in Bank scope database, staff cost and zakah is classified into this variable. However, some banks only post the staff cost without zakah but others post both of them. In most DEA studies, the number of employees is common to specify input. However, as this study comprises many countries, the general analysis will therefore benefit from the inclusion of personnel expenses in monetary values instead of number of employees.
The inclusion of other operating income in the analysis is particularly important as Islamic banks have been very creative in avoiding interest rate products. Concentrating on completely earning assets would be insufficient to capture the overall output of Islamic banking industry.
Furthermore, total loans of Islamic banks in the sample are consisted of mostly Islamic transactions.
Under the non-parametric approach, an increasing number of variables reduce the number of technically inefficient observations (Coelli et al., 1998). Moreover, the capital structure of an Islamic bank is acknowledged to be equity-based because of the domination of shareholder»s equity and investment deposits, which are derived from PLS principle (Muljawan, Dar, and Hall 2002). In other words, the return on capital would be determined ex post or would be based on the return of economic activity in which the funds were utilized.
Even these issues could be overwhelmed by employing the DEA method; still we need an appropriate specification of an Islamic bank»s inputs and outputs. Empirically, we restrict our choice of variables to be a 3-input and 3-output model. See table below.
Kebijakan Fiskal Longgar Kebijakan Fiskal Ketat Table III.3
Input √ Output Variables
y1: Total loans x1: Overheads Costs
y2: Other Income x2: Fixed Assets
y3: Total Earning Assets x3: Total Deposits
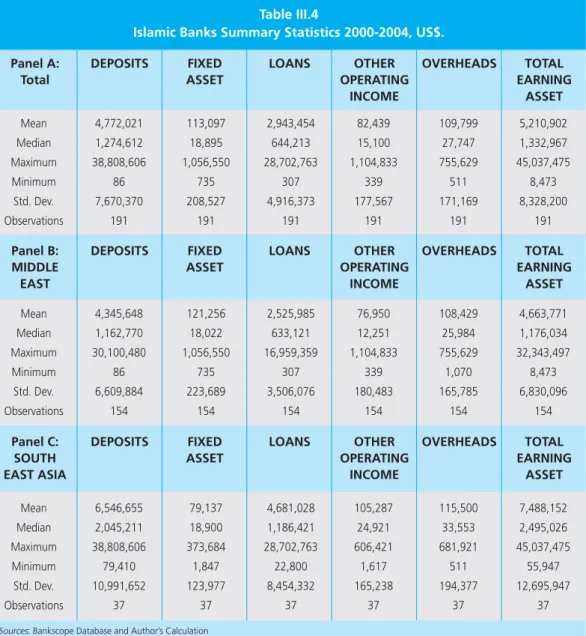
To get a preliminary insight of the data, we present a general description of the 6 variables above. See Table III.4. It was surprising that the South East Asian Islamic bank has a greater total earning assets than the Middle East. However, other operating income and overheads variables show similarity for both regions.
Panel A: DEPOSITS FIXED LOANS OTHER OVERHEADS TOTAL
Total ASSET OPERATING EARNING
INCOME ASSET
Table III.4
Islamic Banks Summary Statistics 2000-2004, US$.
Mean 4,772,021 113,097 2,943,454 82,439 109,799 5,210,902
Median 1,274,612 18,895 644,213 15,100 27,747 1,332,967
Maximum 38,808,606 1,056,550 28,702,763 1,104,833 755,629 45,037,475
Minimum 86 735 307 339 511 8,473
Std. Dev. 7,670,370 208,527 4,916,373 177,567 171,169 8,328,200
Observations 191 191 191 191 191 191
Sources: Bankscope Database and Author»s Calculation
Panel B: DEPOSITS FIXED LOANS OTHER OVERHEADS TOTAL
MIDDLE ASSET OPERATING EARNING
EAST INCOME ASSET
Mean 4,345,648 121,256 2,525,985 76,950 108,429 4,663,771
Median 1,162,770 18,022 633,121 12,251 25,984 1,176,034
Maximum 30,100,480 1,056,550 16,959,359 1,104,833 755,629 32,343,497
Minimum 86 735 307 339 1,070 8,473
Std. Dev. 6,609,884 223,689 3,506,076 180,483 165,785 6,830,096
Observations 154 154 154 154 154 154
Panel C: DEPOSITS FIXED LOANS OTHER OVERHEADS TOTAL
SOUTH ASSET OPERATING EARNING
EAST ASIA INCOME ASSET
Mean 6,546,655 79,137 4,681,028 105,287 115,500 7,488,152
Median 2,045,211 18,900 1,186,421 24,921 33,553 2,495,026
Maximum 38,808,606 373,684 28,702,763 606,421 681,921 45,037,475
Minimum 79,410 1,847 22,800 1,617 511 55,947
Std. Dev. 10,991,652 123,977 8,454,332 165,238 194,377 12,695,947
Observations 37 37 37 37 37 37
IV. RESULT AND ANALYSIS
IV.1. Data Envelopment Analysis Results IV.1.1. Multi Stages Result
This section reports the results of the DEA efficiency analysis of the bank in our data. The sample comprises the largest banks in each region and that the number of banks composing the sample changes in different years. Therefore, we can investigate the impact on cost efficiency of the restructuring process and compare the banks of each region against the same benchmark.
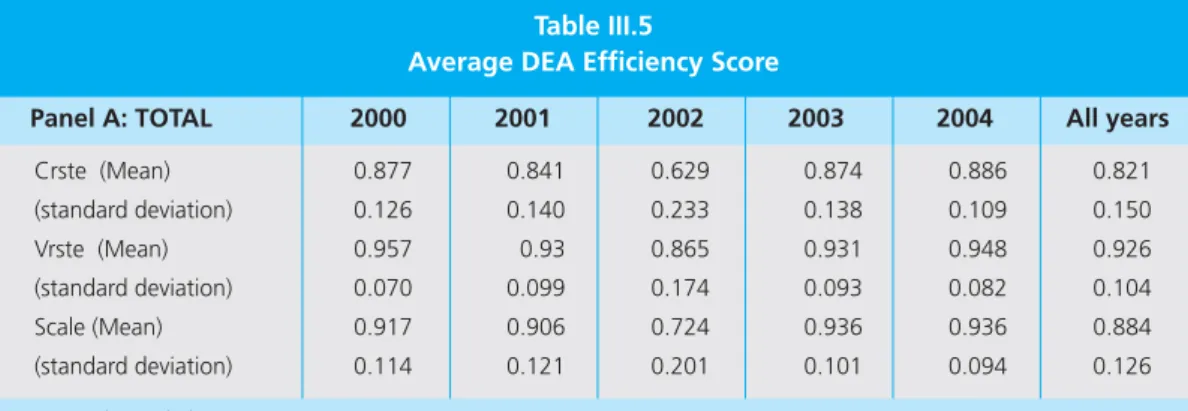
Table III.5 provides the summary statistic of efficiency measure for each year over the period 2000 to 2005 together with the decomposition into the pure technical and the scale efficiency. The geometric mean of technical efficiency for all banks over the sample period is 82.1 percent, which is higher than that of European banks (6.3 percent), Casu and Molyneux (2000). Comparing efficiency score drawing from different sample will provides different result.
This is simply because the efficiency estimates are sensitive to the specification of inputs and outputs (Maghyereh: 2005).
Panel A: TOTAL 2000 2001 2002 2003 2004 All years
Table III.5
Average DEA Efficiency Score
Crste (Mean) 0.877 0.841 0.629 0.874 0.886 0.821
(standard deviation) 0.126 0.140 0.233 0.138 0.109 0.150
Vrste (Mean) 0.957 0.93 0.865 0.931 0.948 0.926
(standard deviation) 0.070 0.099 0.174 0.093 0.082 0.104
Scale (Mean) 0.917 0.906 0.724 0.936 0.936 0.884
(standard deviation) 0.114 0.121 0.201 0.101 0.094 0.126
Source: Author»s Calculation
From the calculation, we may say that year 2004 exhibits as the most efficient year for Islamic Banks in both regions. But, this industry experienced slight inefficient in 2002 (62.9 percent). Overall result indicates the average scale efficiency for all banks over the sample period being 88.4 percent meaning that inefficiency due to the divergence of the actual scale of operation for the most productive scale size is about 11.6 percent. Average pure technical efficiency, on the other hand, is 92.6%, implying that banks could, on average have produced the same amount of outputs with approximately 7.4% fewer resources than they actually employed.9
9 For detail calculation, see Appendix
However, during the period of Iraqi war in 2002, the level of inefficiency is more attributable to pure technical inefficiency (VRS) rather than scale inefficiency. This conclusion is consistent with most empirical result in a global context which found that input X-inefficiencies, such as technical inefficiencies, dominate output inefficiencies, such as economies of scope, (see Maghyereh: 2005). Similarly, Berger and Humprey (1997), Drake and Hall (2003) found that US and Japanese banks typically demonstrates that X-inefficiency is a more stern setback than scale inefficiency, especially during the crisis period.
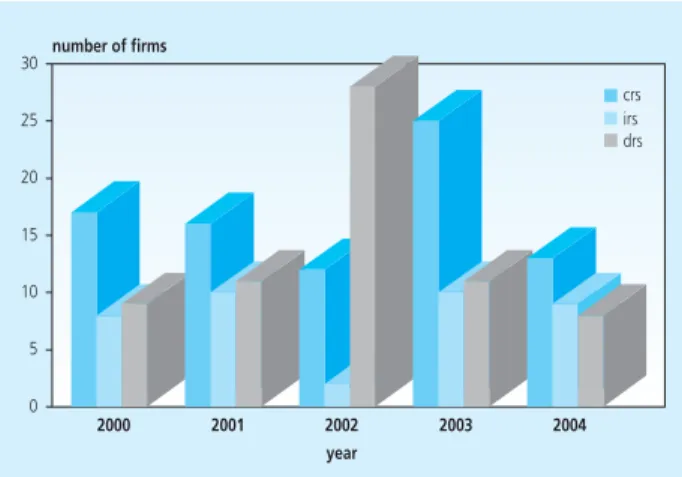
To convincing the result above, Figure III.4 show that banks run constant return to scale nearly 43.8 percent, 34.6 percent run decreasing return to scale and only 21.4 percent run increasing return to scale during the period 2000 - 2004. This Figure emphasized that there is an upward trend of banks to run decreasing return to scale, particularly in 2001-2003. Therefore, it is important to test whether the increases in the annual average of efficiency scores are statistically significant. The Anova test, Kuskal Wallis H test and Median test are important to indicate that banks are becoming more efficient overtime.10 At 5 percent level of significant, all tests for overall and Middle East efficiency score are significant, while those test do not reject null hypotheses for South East Asia efficiency scores.11 It has meaning that scale inefficiency also contributed to overall inefficiency. Although bank size clearly has prominent argument on scale efficiency, it is believed that scale efficiency is also mainly induced by factors regarding to the geographical area, and hence the regulation in the country where bank operates.
10 The Kurskal-Wallis H test, Median test which assume that the variable under consideration is continous and that it was measured on at least an ordinal (rank order) scale.
11 It was not surprising since the descriptive analysis of the data (Jarque- Bera statistic) shows non-normality distribution.
Figure III.4 Numbers of Bank with Scale Efficiency
number of firms
year 0
5 10 15 20 25 30
2000 2001 2002 2003 2004
crs irs drs
Source: Author»s Calculation
International standards of Islamic banking accounting principles should also be encouraged in order to be able to compete within the global environment
The information on efficiency results for Islamic banks grouped by regional area provides significant insights into the analysis. As can be seen from Table III.6 and Table III.7, Islamic banks in the South East Asia region perform better in terms of overall efficiency. While, the Middle East region perform more efficient in the beginning periods, but subsequently showing a sluggish results in 2001 and 2002. This result is similar to the previous study, even use different methodology. Yudistira (2003), Bashir (2001) found the evidence of Islamic banks in the Middle East is less efficient than outside the region, other things constant.
There are two conditions can explain it. Firstly, the 9/11 attacked in USA in 2001, had bad impact on financial sector in Middle East. These countries tend to be suspected as terrorist, whereas it is commonly known that this tragedy was related to the big ≈BushΔ business in oil.
Since the national income of the Middle East countries was driven by oil production (e.g. oil contribution to Bahrain GDP is 70%), thus, the financial sector also sensitive with the oil price fluctuation. The banker reported that in 2001, most of Middle East countries except Qatar,
Panel B: Middle East 2000 2001 2002 2003 2004 All years
Table III.6
Average DEA Efficiency Score for Middle East
Crste (Mean) 0.886 0.855 0.623 0.890 0.891 0.829
(standard deviation) 0.132 0.140 0.244 0.133 0.114 0.153
Vrste (Mean) 0.961 0.949 0.866 0.947 0.955 0.936
(standard deviation) 0.073 0.087 0.187 0.085 0.077 0.102
Scale (Mean) 0.922 0.902 0.715 0.939 0.934 0.882
(standard deviation) 0.115 0.127 0.206 0.104 0.098 0.131
Panel C: South East Asia 2000 2001 2002 2003 2004 All years Table III.7
Average DEA Efficiency Score for South East Asia
Crste (Mean) 1.000 0.980 0.995 0.968 0.995 0.988
(standard deviation) 0.000 0.057 0.015 0.053 0.010 0.034
Vrste (Mean) 1.000 1.000 0.998 0.981 1 0.996
(standard deviation) 0.000 0.000 0.007 0.040 0.000 0.012
Scale (Mean) 1.000 0.980 0.997 0.986 0.995 0.992
(standard deviation) 0.000 0.057 0.008 0.028 0.010 0.026
Source: Author»s Calculation
have suffer from the falling down oil price, even Kuwait has minus growth (√8.5%). Second, this attack, Iraqi war in 2002 contributed also to make the condition worse, because it reduces business confidence. In the massive uncertainties like a war, businessman may not to take risk to invest their funds.12
In contrast, South East Asia Islamic banks performance had not much affected aftermath of the attack. However, when most economies have slowly recovered from the crisis, the overall banking performance in South East Asia show strengthened in efficiency and effectiveness than Middle East Islamic banks. Generally, the reasons for this is that; first, previous studies have already pointed this fact and argued that the explanation lies on depositors» flight to quality which was found mainly in the East Asia region (Chiuri, Ferri, and Majnoni 2001, Yudistira 2002). Flight to quality supposedly consisted of deposit shifting from small to large banks as the latter was perceived too big to fail controversy or simply more likely to receive public sector support in the case of difficulties. Similarly, at least for non Middle East Islamic banks in the sample study, the flight to quality is due to the rising belief (Kaffah) of Islamic banking and finance which has increased their efficiency scores (Yudistira: 2003).
Second reasons is due to Merger and Acquisition act. It can be seen that the DEA efficiency score of South East Asia region decline in 2003. Since there is a consolidation programs for the domestic banking institutions, it leads to increasing competition between conventional and Islamic banks. As reported by Central Bank of Malaysia (2002) there is evidence that some conventional banking groups merged to get well capitalized and undertake a wider scope of business. Conversely, the trend of merger and acquisition (M&A) is not evident in Islamic banking (Yudistira: 2003).
IV.1.2. Malmquist TFP Result
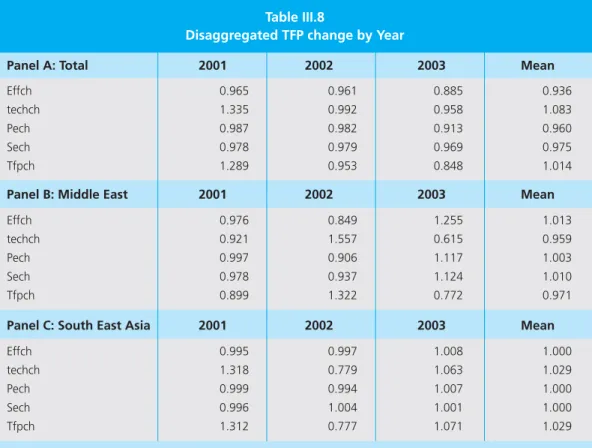
To investigate further whether the improvement efficiency of Islamic banking system, we study year by year result for the Malmquist index of productivity change. From the original data set, we only observe 22 banks which comprise 6 banks in South East Asia and 16 banks in Middle East during the period 2000 √ 2003. The yearly Malmquist index for each of technical efficiency change (EFFCH), technological change (TECHCH), pure technical efficiency change (PECH), scale efficiency change (SECH) and total productivity change (TFPCH) are presented in Table III.8.
12 In monetary policy framework of Bahrain, it is stated that Bahrain has a very open economy and the USA is a major trading partner.
The US market is the largest and most dynamic in the world. Therefore, linking the Bahrain Dinar to the US dollar promotes Bahrain»s non-oil external trade and encourages economic stability and development. In addition, a large part of Bahrain»s exports, specifically oil and Aluminium exports, are US dollar denominated, regardless of the markets to which they are ultimately exported. Oil accounts for over 24% of Bahrain»s GDP and Aluminium for over 10%, (Bahrain Monetary Agency: 2005).
Overall result of the Malmquist analysis suggests that there is decline in technical efficiency during the sample period. The result also show that the late 2001 and 2002 efficiency regress due mainly to technological regress. It was indicating the importance of negative external shock in slowing the process of innovation particularly for the Middle East banks. This seems nonsensical; as there cannot be a reduction in knowledge, but in fact indicates change in political sense such as Iraqi war and 9/11 attack that make this measure appear to be negative.
By combining these changes the total productivity change showed a negative and downward trend, where index is below 1.
It can also be seen that the main source of productivity improvement is the growth in pure technical efficiency rather than scale efficiency. This result is consistent with the previous result in VRS method, where banks failure to operate with the minimum cost during the crisis and or war. However, the Malmquist index results show that the Middle East is conclusively less efficient than that of South East Asia banks. We can conclude that over the period of observations, the rapid improvement was due mainly in scale efficiency for the South East Asia and pure technical efficiency for the Middle East.
Panel A: Total 2001 2002 2003 Mean
Table III.8
Disaggregated TFP change by Year
Effch 0.965 0.961 0.885 0.936
techch 1.335 0.992 0.958 1.083
Pech 0.987 0.982 0.913 0.960
Sech 0.978 0.979 0.969 0.975
Tfpch 1.289 0.953 0.848 1.014
Panel B: Middle East 2001 2002 2003 Mean
Effch 0.976 0.849 1.255 1.013
techch 0.921 1.557 0.615 0.959
Pech 0.997 0.906 1.117 1.003
Sech 0.978 0.937 1.124 1.010
Tfpch 0.899 1.322 0.772 0.971
Panel C: South East Asia 2001 2002 2003 Mean
Effch 0.995 0.997 1.008 1.000
techch 1.318 0.779 1.063 1.029
Pech 0.999 0.994 1.007 1.000
Sech 0.996 1.004 1.001 1.000
Tfpch 1.312 0.777 1.071 1.029
Source: Author»s Calculation