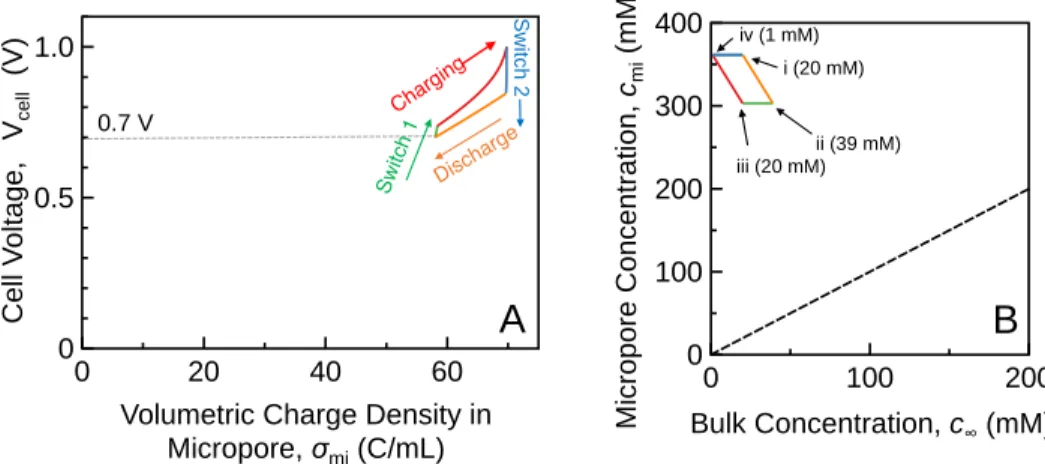
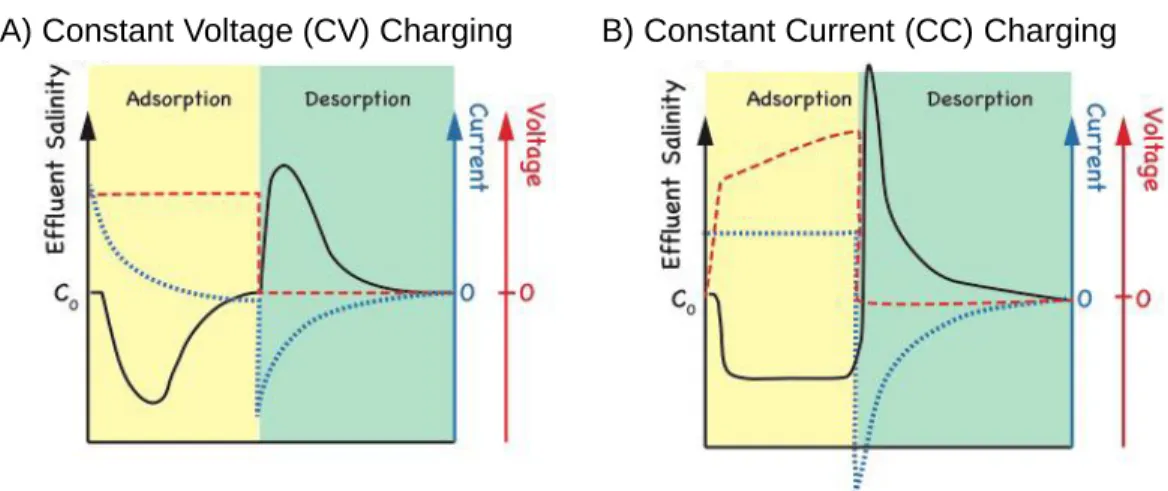
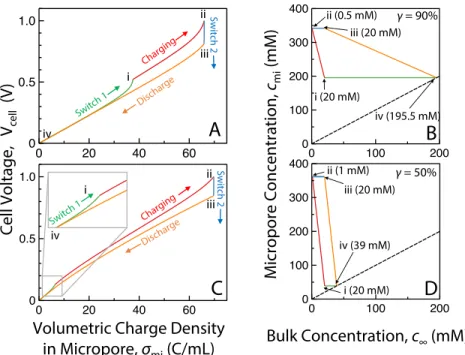
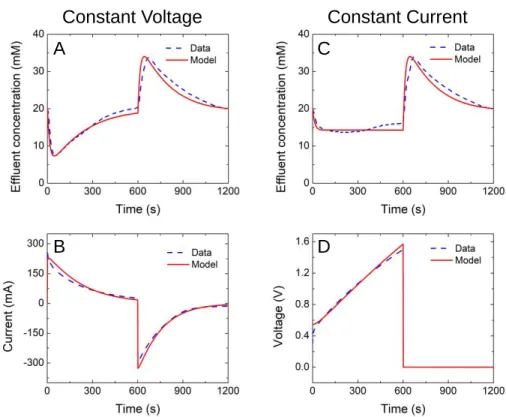
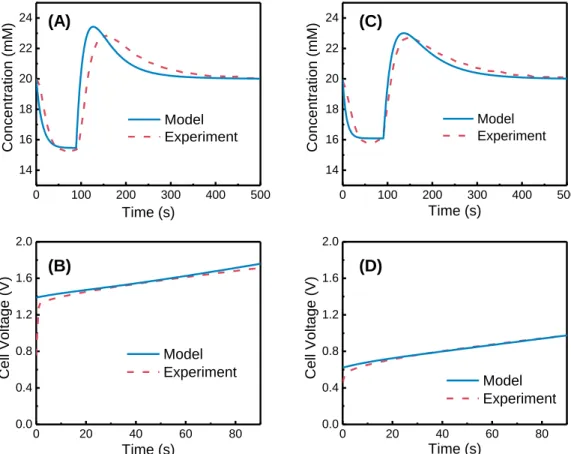
5 Figure 2.1 The quantitative relationship between cell voltage, Vsel, and the volumetric. charge density in the micropores, σmi. 62 Figure 5.1 (A) effluent concentration and (B) electric current in an MCDI process with CV charging; (C) effluent concentration and (D) cell voltage in an MCDI process with CC charging.
Overview
CDI Fundamentals
- Electrical double layer theory
- Ion transport
- CDI cell architectures
- Flow-by cell
- Flow-through cell
- Flow-electrode cell
- Performance metrics
The Stern layer is a charge-free layer, which is applied because the ions cannot approach the electrode surface indefinitely due to the hydration shell of the charged ions. Following the pioneering work of Biesheuvel et al., our study uses the mD model, which assumes a constant electrical potential in the micropores.10 Similar to the GCS model, a charge-free Stern layer is incorporated between the charged carbon electrode matrix and the electrolyte-filled micropores.
Overarching Goal of this Dissertation
Specific Objectives
Furthermore, now that we understand how energy efficiency is affected and where energy is dissipated, we will continue to improve CDI performance. In this regard, we reduce the impedance of the electrode macropore to improve the energy efficiency of the CDI.
Dissertation Structure
In addition, we develop a concept called thermodynamic energy efficiency by comparing the actual energy consumption with the Gibbs free energy of dissociation. By comparing the voltage of each mode of operation with the voltage of the reversible process, we can explain the different performance of the two modes in terms of energy efficiency.
Overview
Specifically, we quantify the energy consumption in a four-stage CDI cycle using the modified Donnan (mD) model and compare it to the Gibbs free energy of dissociation achieved by such a cyclic CDI process. Finally, we compare the energy consumption of these reversible CDI cycles with the Gibbs free energy of the partitions resulting from those cycles.
Specific Gibbs free energy of separation
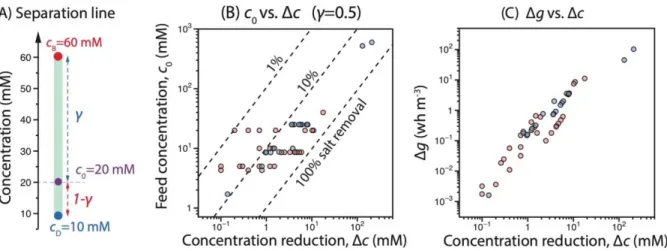
A generic separation defined by 𝑐0, 𝑐𝐷, 𝑐𝐵 and γ always requires a minimal amount of energy to generate a unit volume of the dilute solution as determined by reversible thermodynamics. We note that 𝛥𝑔, unlike the total Gibbs free energy of separation, is independent of the scale of desalting, thanks to the normalization of the volume of the dilute solution.
Modified Donnan (mD) model for ion retention by porous carbon electrodes
At equilibrium, the sum of ∆𝜙𝑆 and ∆𝜙𝐷 is equal to half the potential across the cell 𝜙𝑐𝑒𝑙𝑙 for symmetric cells. 2(∆𝜙𝑆+ ∆𝜙𝐷) = 𝑉𝑐𝑒𝑙𝑙/𝑉𝑇 (2.7) Here, potential drops due to resistances in the circuit, the electrode, the bulk solution and at the interfaces can be ignored due to the zero current in a thermodynamically reversible process. Solving equations 2.3) to 2.7 yields the relationship between 𝜎𝑚𝑖 and 𝑉𝑐𝑒𝑙𝑙 for a given 𝑐𝑚𝐴 (which is also 𝑐∞ in equilibrium) when the system reaches thermodynamic equilibrium.
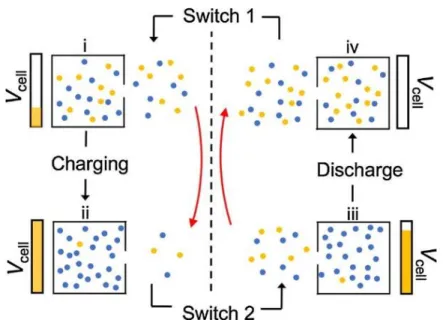
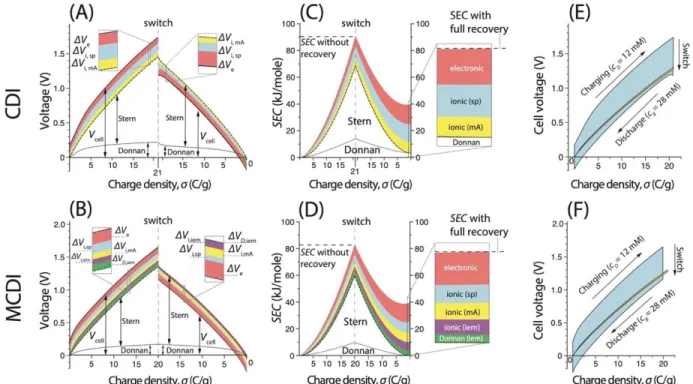
A four-stage reversible cycle for batch-mode capacitive deionization
In the "switch 1" stage, the brine in the bulk solution is replaced by the feed solution while the micropore concentration remains constant. During this solution switch (“Switch 2” in Figure 2.2), the dilute solution is extracted from the system while the micropore concentration is kept constant by reducing 𝑉𝑐𝑒𝑙𝑙 to maintain equilibrium.
Reversible CDI cycles consume Gibbs free energy of separation
The SEC of a reversible CDI cycle is proportional to the area described by the corresponding cycles (A) and (C). 4 shows a CDI cycle with a final discharge voltage of 0.7 V (solid cycle) compared to a reference cycle with a final discharge voltage of 0 (dotted cycle).
Conclusions
This chapter was published in the journal Environmental Science & Technology as part of the following peer-reviewed manuscript: Wang L., Lin S., Energy efficiency of capacitive deionization.
Overview
Furthermore, we discuss the possible reasons that lead to very high energy efficiency in certain CDI processes with electrodes based on intercalation materials and provide an empirical correlation using literature data to elucidate the dependence of energy efficiency on several key parameters. For more comprehensive and systematic discussions of various performance metrics and how CDI processes should be holistically evaluated, readers are referred to several review articles, including those by Porada et.al.,1 Suss et.
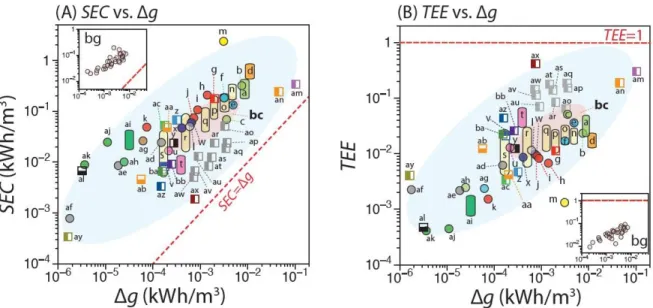
Themordynamics of separation: benchmarking energy consumption
These data are from Table A1 which will be further analyzed in detail in Figure 3.2 for energy efficiency. Numerical studies using the Gouy-Chapman-Stern29 model and the modified Donnan82 model demonstrate that thermodynamically reversible CDI processes do indeed consume 𝛥𝑔.
Thermodynamic energy efficiency
In practice, the efficiency of energy recovery for CDI processes with energy recovery is always less than 100% of the recoverable energy83 and consequently falls between the values calculated using equations 3.4 and 3.5. These two limits define the top and bottom of the bars in Figures 3.2A and 3.2B that represent the possible range of 𝑆𝐸𝐶 and 𝑇𝐸𝐸.
Sources of energy losses in CDI and why TEE can be very low?
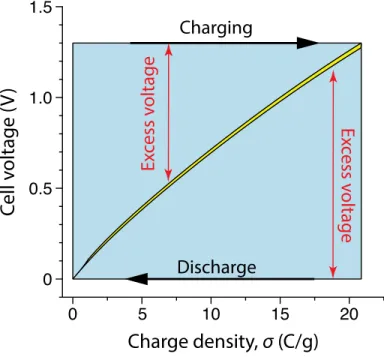
In comparison, 𝛥𝑔 is proportional to the area of the very thin yellow cycle in Figure 3.3E. With CV-ZV operation, however, the resistive energy loss is proportional to the area of the blue region (excluding the yellow region) in Figure 3.4 and is therefore independent of cell resistance.
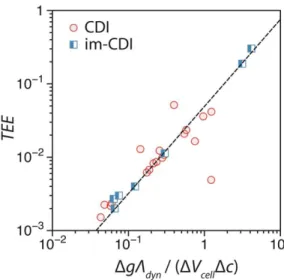
High TEE in (some) CDI processes with intercalation materials
In other words, im-CDI stores less energy in the charging step than CDI based on carbon electrodes for the same amount of salt removal. This correlation can be used to justify the very high TEE of some im-CDI processes.
Energy efficiency and desalination rate: an intrinsic trade-off significance
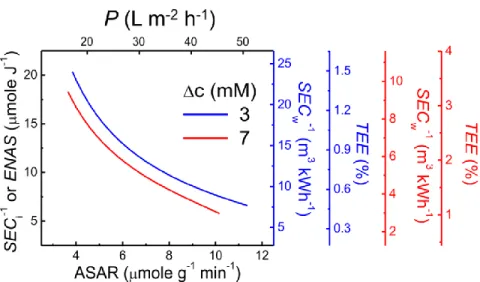
We note that the conversion between SECi (or ENAS) and SECw, and between ASAR and P, can be readily performed if the salinity reduction 𝛥𝑐 (= 𝑐0− 𝑐𝐷) and flow rate are known.77, 117 A trade-off curve is only meaningful if all points on a trade-off correspond to the same separation. Because all points on a trade-off curve correspond to the same separation and thus the same 𝛥𝑔, TEE is simply proportional to SECw-1 for a given trade-off curve (Figure 3.6, additional y-axis).
Charge efficiency: correlation to energy consumption revisited
The trade-off curves in Figure 3.6 indicate that energy efficiency, as quantified by the inverse of SEC, is approximately inversely proportional to the degree of desalination, as quantified by ASAR or P. Because each trade-off curve shown in Figure 3.6 involves a single MCDI system and results at the same separation suggests that TEE depends not only on the resulting separation or the "goodness" of the CDI system, but also strongly on how fast the CDI process is performed to achieve the target separation.
Conclusions
In general, it has been suggested that the techno-economic analysis of CDI systems simultaneously considers energy consumption and desalination rate based on their trade-off relationship.77, 117 In this context, energy consumption should be quantified using SECw, which again has more direct relevance (than TEE) to consideration of practical costs. In other words, 𝑉𝑐𝑒𝑙𝑙 can be adjusted in CV mode to achieve the same separation but different desalination rate only if 𝑉𝑐𝑒𝑙𝑙 is higher than 𝑉𝑒𝑞 at the end of the charging step.
Overview
The energy efficiency of a desalination process is often quantified by specific energy consumption (SEC), typically defined as the energy consumed to generate the unit volume of product water116. Quantifying the trade-off between kinetic and energetic efficiency is essential for optimizing the design and operation of an RO system 45, which has not been systematically implemented for CDI.
Materials and Methods
MCDI module
Therefore, a rational comparison of the kinetic and energetic performance between different CDI operations should be performed in a way that the effluent salinity and underlying separations are kept constant. The trade-off between kinetics and energetics is quantified using ASAR and the inverse of specific energy consumption (SEC-1) from MCDI experiments in which current density and flow rate are varied simultaneously to achieve the same separations with different kinetic efficiencies.
Experimental methods and design
A peristaltic pump drives the water to enter through the perimeter of the square MCDI stack, flow past the spacers sandwiched between the ion exchange membrane/electrode assemblies, and exit the central square hole. The flow rates leading to the target effluent salinity were obtained using an experimental method.
Data analysis
In this study, we take a different approach by adapting the flow to the different loading flows to maintain the same salinity of the effluent and thus achieve the same underlying separation with different flow densities. In this study, we will quantify the trade-off between kinetics and energetics using the relationship between ASAR and the inverse of SEC, that is, SEC-1 (unit: mg J-1).
Theoretical Modeling
Results and Discussion
Experimental results and model validation
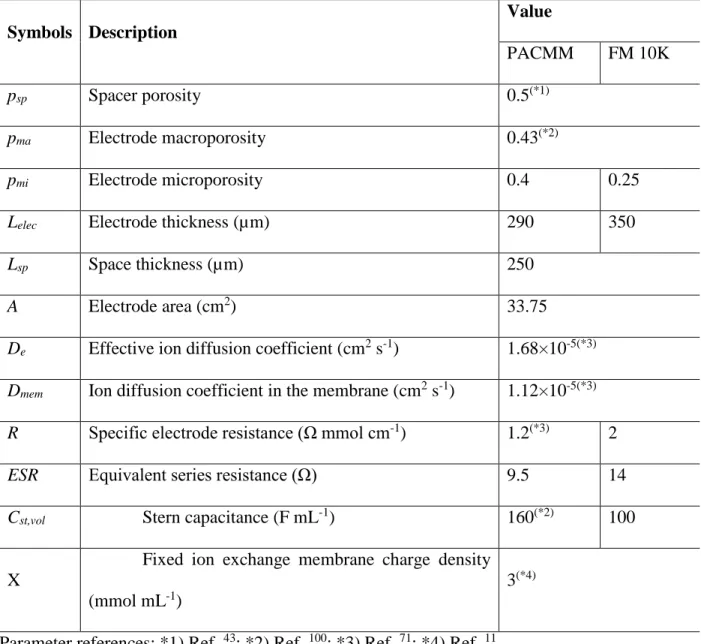
The experimental results from Figure 4.1A are fitted with simulated results from the MCDI transport model described in the theory section (with details in Supporting Information). With a single set of parameters (for each electrode) consistent with those reported in the literature and used consistently in all our simulations (Table 4.2), the MCDI model can generate simulation results that fit the experimental results with excellent precision.
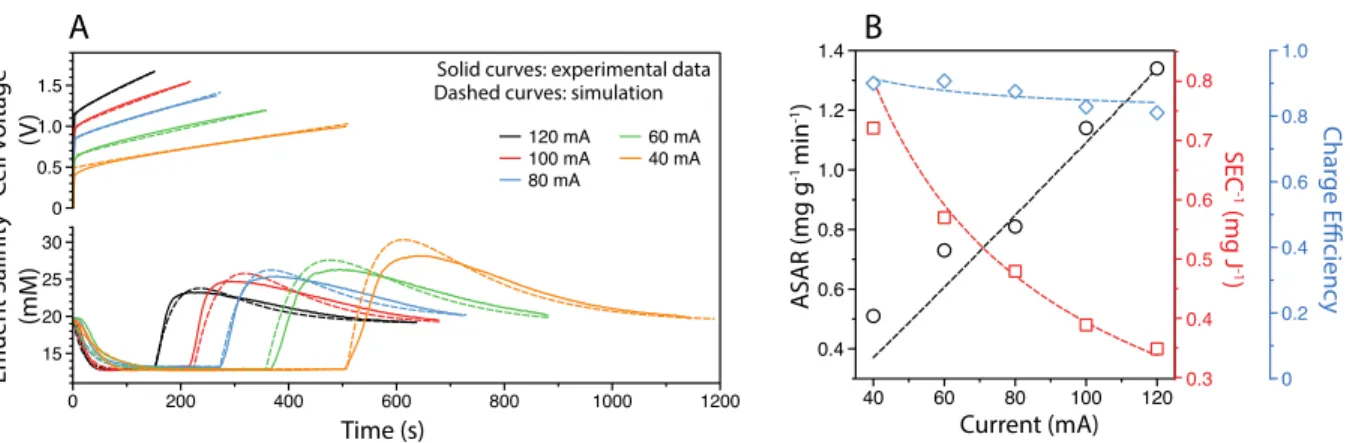
Kinetics and energetics tradeoff
SEC-1” curve, which was also confirmed by the results simulated from the MCDI transport model. The electrode materials used in the MCDI stack appear to have a very significant effect on the position of the trade-off curve.
Practical Implications for System Design
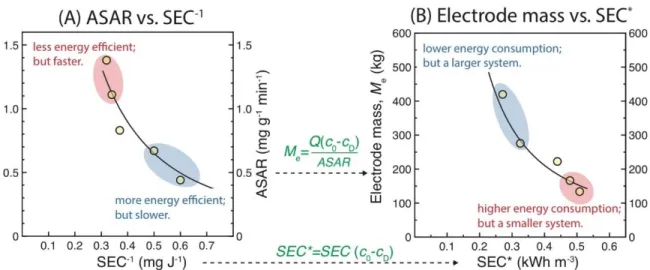
The electrode mass, which represents the scale of the MCDI system, has a major impact on the capital cost of the system. Finally, the trade-off between ASAR and SEC-1, when determined under the same operating conditions (i.e. 𝑐0, 𝑐𝐷 and 𝑣𝐷), can also be used to measure the performance of the electrode material, or more broadly, of the CDI or MCDI cell stacks .
Conclusions
Experimental results in Figure 4.2D have already shown that we can easily compare the quality of the electrode by comparing the positions of their “ASAR vs. ASAR” tradeoff curve. This represents a charging operation defined by the selection of three parameters, including the applied voltage in a CV operation or the applied current in a CC operation, the flow rate of the current through the system and the duration of charging.
Materials and Methods
- MCDI stack
- Experimental methods
- Identical target adsorption and kinetic rate
- Data analysis
In addition to identical target adsorption, another requirement for direct comparison of energy efficiency between the two charging modes is that they remove salts at the same kinetic rate, which is usually determined by ASAR. Similarly, if two operations are of the same ASAR, the one with a higher SEC-1 is considered to be "better" because it is more energy efficient.
Dynamic Ion Transport Model
For example, if two charging operations are of the same SEC-1, ie. they are equally energy efficient, the one with a higher ASAR, i.e. the one that removes salt faster is considered more kinetically efficient and thus "better". The details of the model derivation and parameter selection are provided in the Supporting Information.
Results and Discussion
- Experimental results and model validation
- Comparing CC and CV charging
- Excess voltage and excess energy
- Can CV mode outperforman CC mode?
- Relative energetic-kinetic advantage primarily depends on the target
The ASAR curves in Figure 5.3 show that CC loading is superior to CV loading—at least for this specific target adsorption and within this kinetic rate range. Regardless of 𝑣𝐷, CC loading can operate at a wider ASAR range than CV loading to achieve target adsorptions with 𝑐̅𝐷 of 18 mM.
Conclusions
Overview
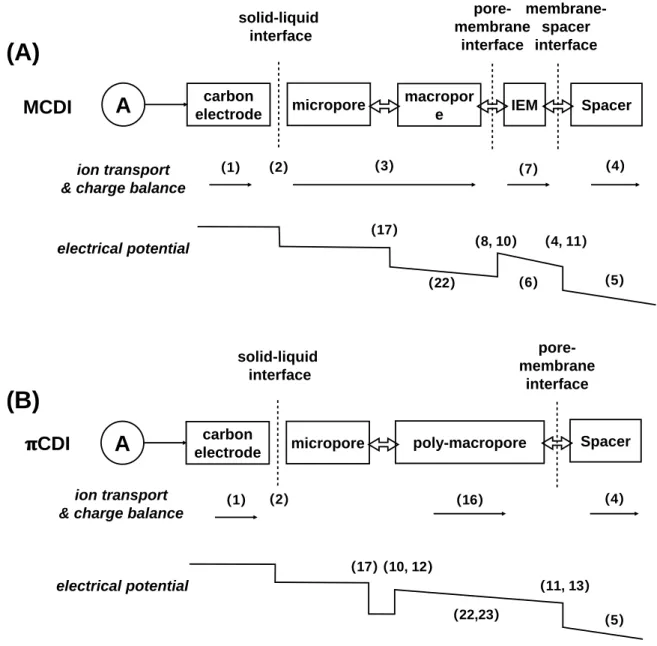
Here, we report a new method by infiltrating an ionically conductive polyelectrolyte into the macropores of carbon electrodes to improve kinetic and energy efficiency. The ions migrated from the spacer through the ion-selective layer to the micropores, eliminating the energy losses due to the macropores in this process.
Model Derivation
Dynamic transport modeling
Ion current to the electrode causes desalination of the feed solution in the spacer channel. 𝐿𝑒𝑙𝑒𝑐 (∆𝑐𝑚𝐴,𝑝𝑖𝑒− 𝜔𝑋𝑝𝑜𝑙𝑦∆𝜙𝑚𝐴,𝑝𝑖𝑒) (6.16) where 𝐷𝑚 𝐴,𝑝𝑖𝑒 is the diffusion coefficient in the macropores filled by the polyelectrolyte, ∆𝑐𝑚𝐴,𝑝𝑖𝑒 is the difference between the concentrations of ions at both ends of the polyelectrolyte filling the macropores.
Micropore charging model
Potential drops
Methods and Experiments
Electrode preparation
Experimental setup and methods
A potentiostat (SP 150, Bio-Logic, France) was used to apply a constant current in the charge step and a zero voltage in the discharge step. 117, 174 The charge and discharge cycles were repeated at least three times to ensure dynamic steady states.
Data Analysis
To evaluate the performance of πCDI compared to MCDI, the kinetic-energetic trade-off curves were constructed for both cells reaching the same diluted volume with the same concentration.
Results and Discussion
- Experimental results and model validation
- Performance analysis
- Evaluate πCDI vs. MCDI
- Comparison of energy breakdown
Nevertheless, the specific energy consumption (SEC) in πCDI is only about half of that in MCDI (Figure 4D) due to the smaller impedance of the electrodes. Apart from the improvement in the macropores, the absence of IEMs in πCDI eliminates the potential drops and thus the energy consumption in the IEMs.
Conclusions
Regarding the equivalent circuit resistance (ESR), which includes the contact resistance between the electrode and the pantograph and the external resistances in the electrical circuit, it is the same for both processes and its contribution to the total SEC is only proportional to the current density. As discussed before, the current density of πCDI is higher than that of MCDI to a small extent, the ESR SEC is approximately the same for both cells.
Overview
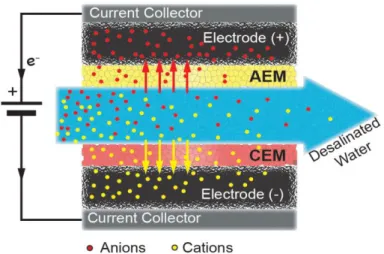
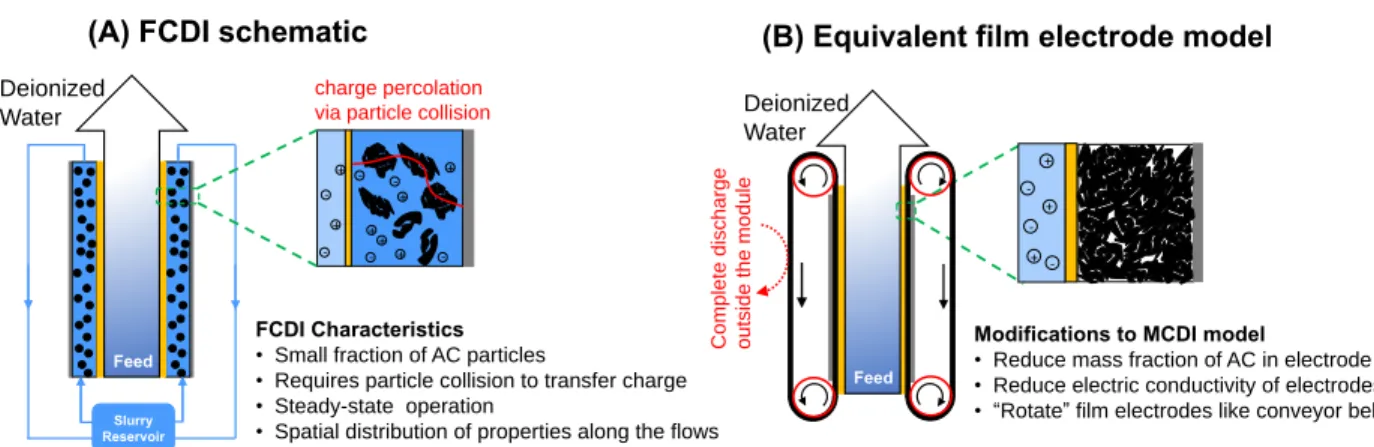
The main features of the FCDI system are listed in (A) and the corresponding measures for modifying the MCDI model to account for such features are listed in (B). Such an equivalent film electrode (EFE) moves in the direction of the flow in a manner similar to a "conveyor belt".
Model Development
- System Description
- Ion Transport in a Unit Cell
- Ion Partitioning between Micropores and Macropores
- Electrode channel modelling
7.3), where 𝑐𝑚,𝑘+ and 𝑐𝑚,𝑘− are the cation and anion concentrations in the IEM of subcell k, 𝑋 the intrinsic charge density of the IEM and 𝜔 the sign of the charge (i.e. -1 for the cation exchange membrane, CEM, and +1 for the anion exchange membrane, AEM). Since the slurry flow of the flow electrode is large in this study, we neglect the influence of the slurry flow in this model.
Experimental Methods
Experimental setup
The total voltage across the unit cell is the sum of all voltage drops. Note that when simulating the steady-state FCDI process, the cell voltage in each unit cell is the same and equal to the total cell voltage.
Experimental conditions
Performance evaluation
Results and Discussion
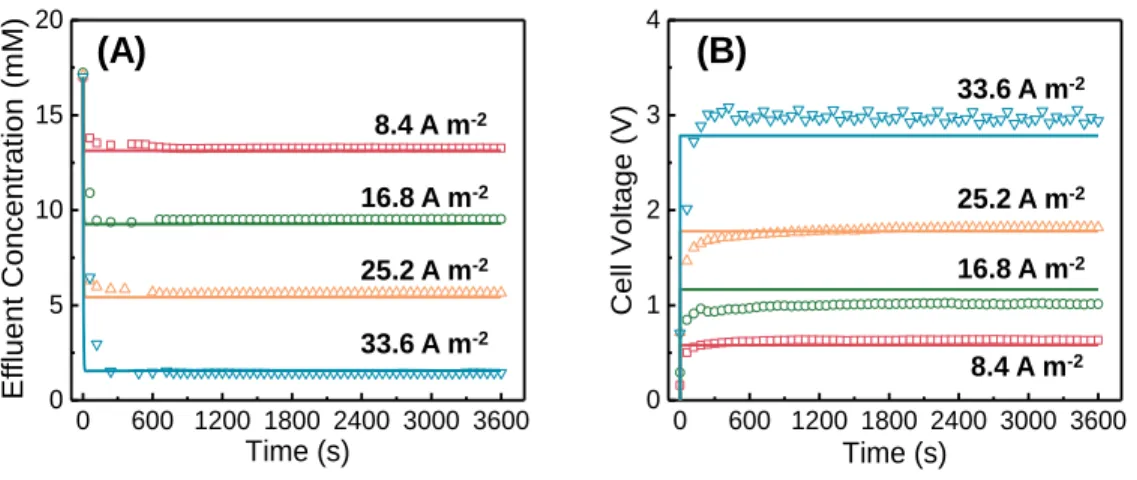
Experimental results and model validation
Increasing the current density for the same HRT leads to a decrease in the effluent concentration (Figure 7.2A). These properties include the volumetric micropore charge density, 𝜎𝑚𝑖 (Figure 7.3A), the current density (Figure 7.3B), the salt concentration in the spacer channel and the solution phase of the flow electrode channel (Figure 7.3C) and the Stern and Donnan potentials (Figure 7.3D).
Performance Evaluation of FCDI
A distinctive feature of FCDI, in contrast to conventional CDI with film electrodes, is that the carbon content of the electrode is adjustable. Although this practical challenge is not specifically explored in the present study, the caveats of increasing the carbon content of the flow electrode should not be overlooked in practical system design.
The Impact of Carbon Content on System Performacne
On the other hand, increasing the carbon content does not affect the ASRR if the current density is kept the same. The positive impact of increasing the carbon content is particularly evident when the carbon content is low.
Conclusions
Supplementary Material for Chapter 3
Supplementary Material for Chapter 4
Supplementary Material for Chapter 5
Supplementary Material for Chapters 6 and 7