Recently, his research directions have evolved to include sustainable design and circular economy in the case of ship design. To summarize, an integrated analysis of the Environmental Management Systems and the Balanced Scorecard for the operation of maritime transport, taking into account the protection of the environment, has been carried out.
Numerical Assessment of Roll Motion Characteristics and Damping Coefficient of a Ship
Kianejad *, Jaesuk Lee, Yi Liu and Hossein Enshaei
- Introduction
- Theoretical Background
- Model Geometry
- Numerical Modelling
- Results and Discussion 1. Verification Analysis
- Conclusions
They found that the roll damping coefficient of the model without bilge keels is linear, but strongly non-linear with bilge keels. The model generates larger roll characteristics at a frequency of 1.4 rad/s, which is close to the natural frequency of the model.

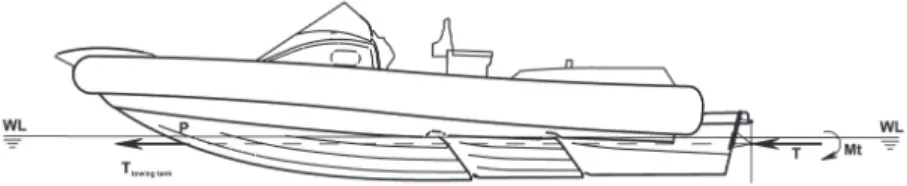
A Validation of Symmetric 2D + T Model Based on Single-Stepped Planing Hull Towing Tank Tests
Mathematical Model
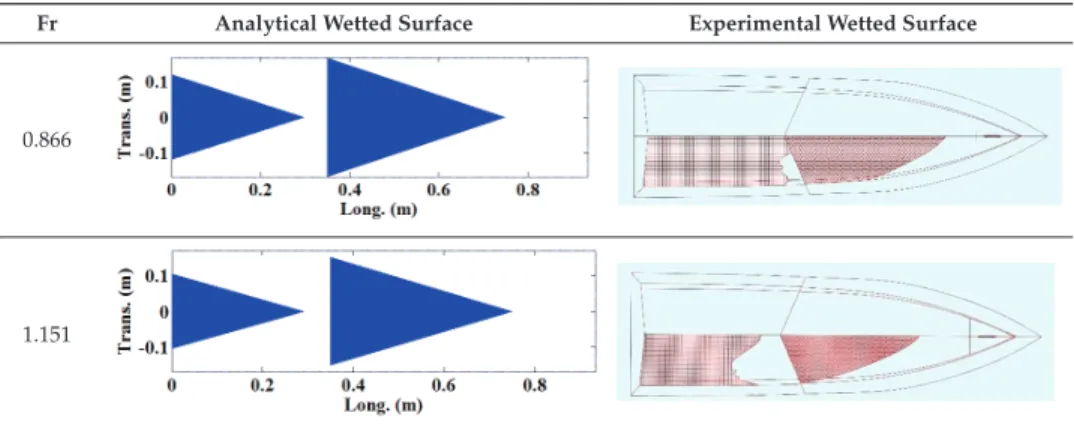
The friction drag force on the pressure area of the single stage planing hull can be calculated by measuring the wetted area of each section for each planing surface as follows. For this purpose, the Matlab command fmincont is applied in the mathematical model to minimize the equilibrium equations for each planing surface of the single-stage hull in which the limits of guessed values (i.e., the trim and wet length) are considered as inputs.
Validation and Results
The DT drag methodology assumes that, in a horizontal position and at a trim angle at rest equal to zero, the direction of thrust is applied at point P, i.e. the intersection between the projection of the engine's thrust direction on a keel plane and keelline at the bow, as shown in Figure 8. Table 2 shows the values of non-dimensional drag, dynamic trim angle, and non-dimensional wetted area.
Conclusions
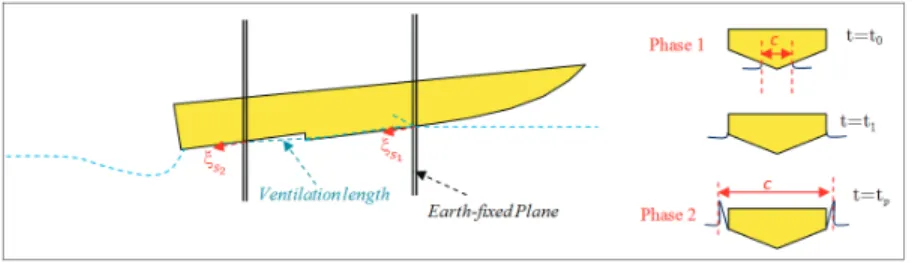
Ai Submerged area of the side body (N m−1) ci Half jet of spray in transverse plane (m) c.i Time derivative of c (m s−2). Ctri Transom reduction at the section of the sede body (N m−1) fHDi Hydrodynamic force of each section of the sede body (N m−1) fBi Hydrostatic force of each section of the sede body (N m−1) l Distance from wedge apex in the direction of wedge wall (m).
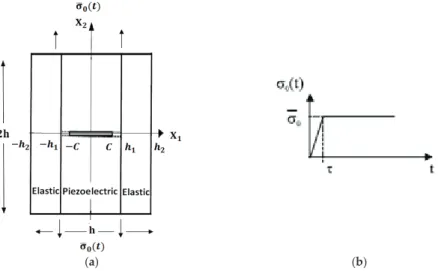
Investigating the Pre-Damaged PZT Sensors under Impact Traction
- Materials and Methods 1. Aim and Scope
- Results
- Discussion
- Conclusions
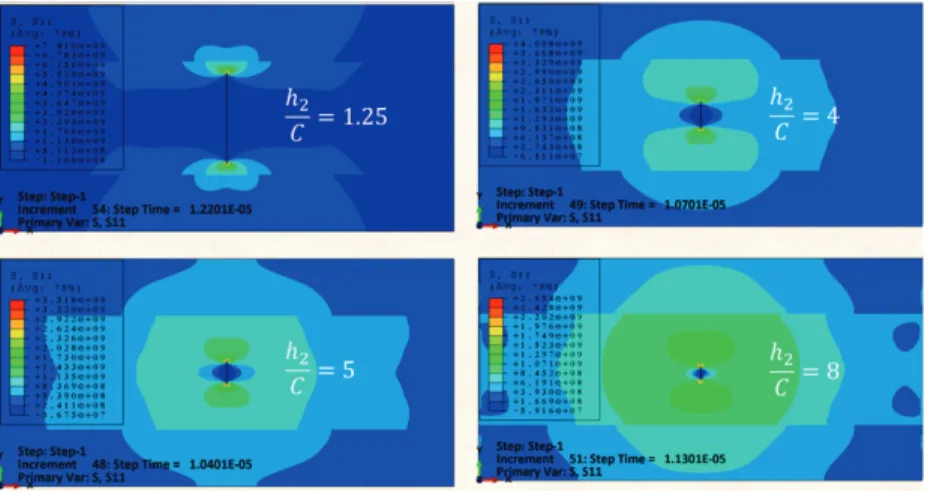
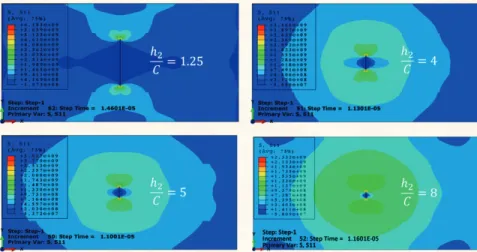
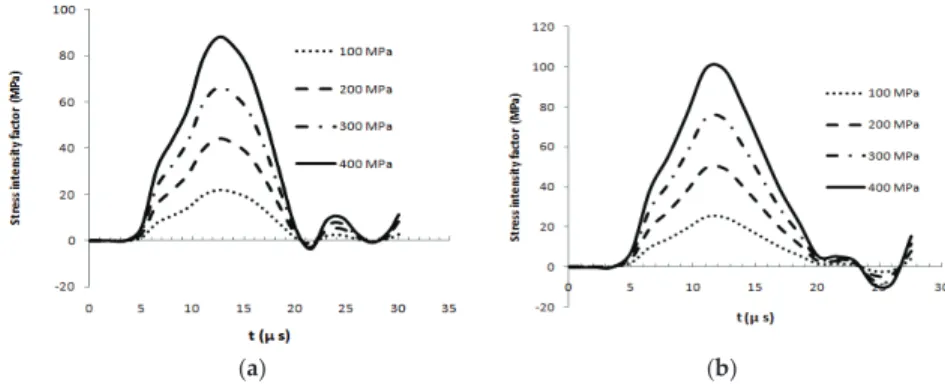
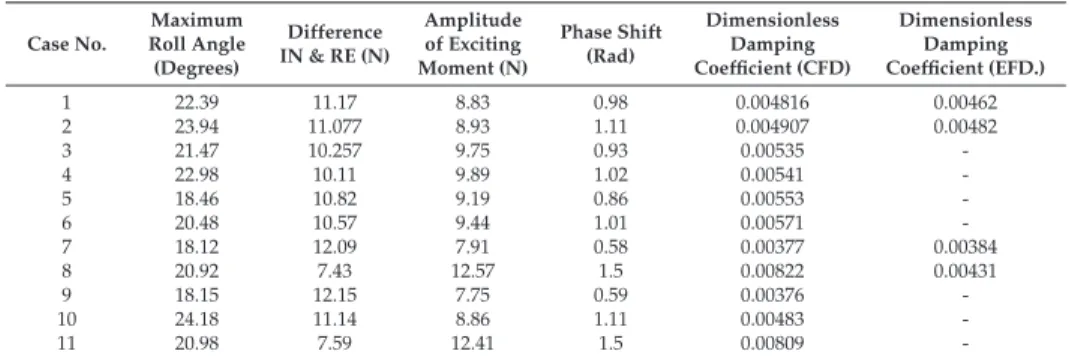
The effect of two variations, viz. crack length and impact energy level, on the DSIF under impact loads in PZT composite plates is shown in Table 3. The fracture response of a PZT composite sensor with a central crack under tensile impact was considered.
![Figure 1. Schematic of the (a) piezoelectric (BaTiO 3 ) plate [26] and (b) steel plate [27].](https://thumb-ap.123doks.com/thumbv2/123dok/10250854.0/51.723.118.609.611.872/figure-schematic-piezoelectric-batio-plate-b-steel-plate.webp)
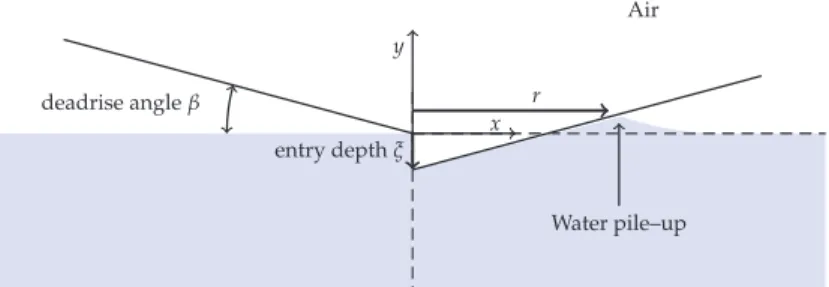
On Air-Cavity Formation during Water Entry of Flexible Wedges
- Cavitation Onset in Rigid Bodies’ Water Entry as Predicted by Analytical Formulations The dynamics of the water entry of rigid bodies can be accurately predicted by utilizing Wagner’s
- Preliminary Experimental Evidences
- Experimental Setup
- Experimental Results
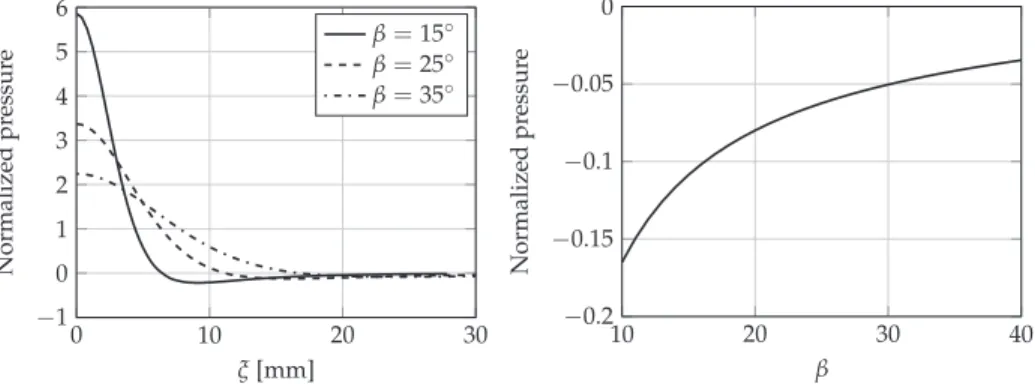
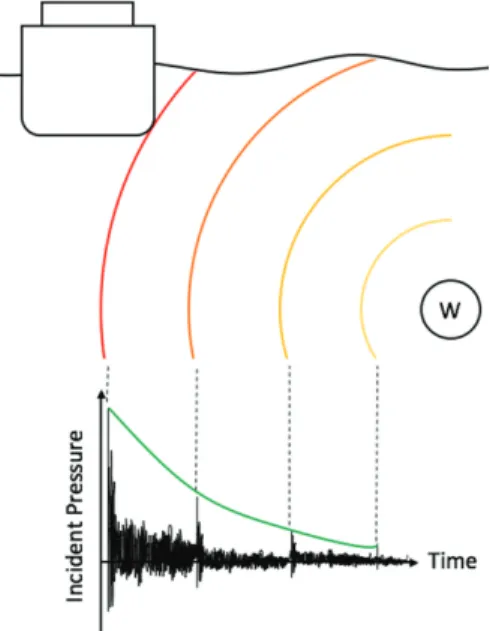
The keel is always wet, as it is the first part of the wedge to touch the water. Figure 5 shows the development of a cavity formation near the apex at the keel of the wedge. Impact acceleration was measured with a Microstrain (Williston, VT) V-Link wireless accelerometer (±100 g) located at the tip of the wedge.
Experimental evaluation of the air trapped during water intrusion in flexible structures.Acta Imeko.
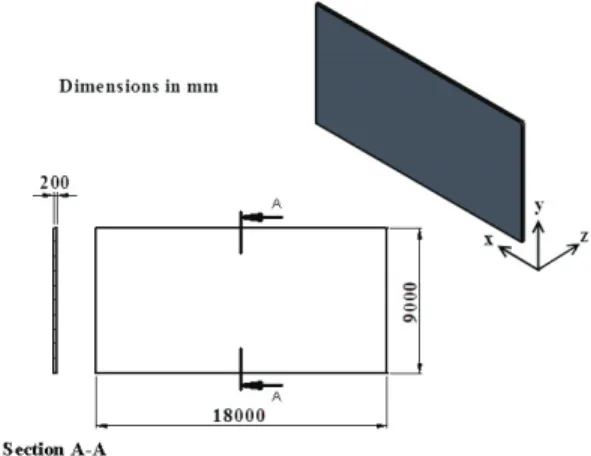
Geometric Evaluation of Stiffened Steel Plates Subjected to Transverse Loading for Naval and
Computational Modeling
Regarding the unstiffened plate model, the verification process took place through a comparison of its results with those obtained from numerical studies of [5,6] and with the analytical solution of [22]. From Figure 2, it can be observed that the central deviation values from the developed model closely converge with those obtained from references [5,6,22] as the number of finite elements. The material of the plate and stiffeners was steel with 206.84 GPa and 0.3 respectively.
As can be seen in Figure 4, as a result of the network convergence study, the values obtained by the developed computer model come very close to those found in [7].
Constructal Design Method
In order to achieve the objective of finding a stiffened plate exhibiting a slight central deflection, the evaluated degrees of freedom were Nls, Nts, andhs/ts; while the imposed constraints were that all stiffened plates have the same material volume, length and width as the reference plate. Furthermore, since the present work assumed only one value of ∅ (which was defined as 0.4), this became an additional geometrical limitation of the analysis. In other words, 40% of the volume of the reference plate was changed into stiffeners of different configurations and geometries, due to the variation of the degrees of freedom Nls,Nts, andhs/ts.
Figure 6 depicts the methodological structure used in the definition of the geometric configurations of the stiffened plates that composed the analyzed search space.
Results and Discussion
From an analysis of the data presented in Figure 7 and Table 1, it can be observed that an increase in the / ratios caused a decrease in the central deviation for the stiffened slabs. It was also observed that forh/ts values greater than 20, there was no significant reduction in the central deflection of the stiffened plates analyzed. Moreover, from the results of this work, it was possible to obtain, through nonlinear regressions, equations that accurately describe the deflection of the studied stiffened plates.
In addition, a simple and effective equation was proposed to determine the central deflections of the braced plates studied in this work.

Survey on Experimental and Numerical Approaches to Model Underwater Explosions
Analytical Models
19], is directly related to the position of the explosive in relation to the fuselage. When the underwater wave passes through a certain point in space, it is then subjected to a transient pressure P(t) and displaced at a velocity v(t) in the direction of the flow. The first advantage can be further improved by increasing the equivalent thickness of the composite.
As for the effects of charge height and diameter, momentum increases as height or diameter increases, independent of plate thickness.
Numerical Simulations
On the determination of the mesh size for numerical simulations of shock wave propagation in near-field underwater explosion.Appl. Continuous simulation of the whole process of underwater explosion based on Eulerian finite element approach. Semi-analytical and experimental investigation of the whip response of a cylinder subjected to underwater blast loading. Ships Offshore Struct. 2018, 1–9.
Numerical modeling of the effect of using multi-explosives on the explosive forming of steel cones.J.

An Approach for Predicting the Specific Fuel Consumption of Dual-Fuel Two-Stroke
Marine Engines
Methodology
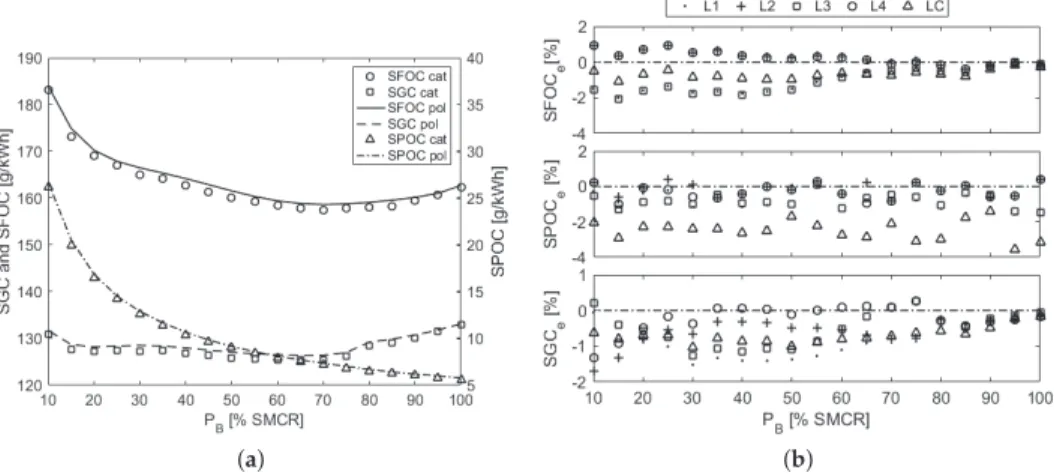
However, specific fuel consumption at part load also depends on the driven propeller type: fixed pitch propeller (FPP) or controllable pitch propeller (CPP). The polynomial surfaces obtained for specific fuel consumption at SMCR normalized with respect to NMCR and their percentage errors of regression are illustrated in Figure 1. The normalized specific fuel consumption with respect to SMCR (SFOCS, SGCS, SPOCS) was achieved by dividing their values at part load by themselves by SMCR.
The specific fuel consumptions behave distinctly from each other and, therefore, they were approximated by polynomials of different degrees.
Model
Figure 4 illustrates the qualitative and quantitative performance of the developed approach used on the engine 9G80ME-C9.5-GI driving a fixed pitch propeller. Qualitative and quantitative performance of the developed approach for the engine 9G80ME-C9.5-GI driving a fixed pitch propeller. a) Qualitative comparison for the SMCR in the center of the layout diagram (LC). Qualitative and quantitative performances of the developed approach used on the engine 5S50ME-C9.6-GI driving a controllable propeller are illustrated in Figure 5.
Qualitative and quantitative performance of the developed approach for the engine 5S50ME-C9.6-GI driving a controllable propeller. a) Qualitative comparison for the SMCR in the center of the layout diagram (LC).
Numerical Study of Turbulent Air and Water Flows in a Nozzle Based on the Coanda Effect
Results and Discussion 1. Computational Model Verification
Taking the flow as inviscid, the differential pressure is proportional to the specific mass of the fluid. This change can be associated with the change in fluid viscosity, which for actual configurations affects the Reynolds number of the fluid flow at each inlet. In addition, the ratio between the mass flow rate in two inlet channels and the dimension of the central septum insert can be used to control the angle of deviation of the mixing current and its intensity (momentum).
The results showed that the influence of the parameters m*enPin the flow appeared to be relevant and influenced the deflection angles, magnitudes and velocities.

Preliminary Study on the Contribution of External Forces to Ship Behavior
Material and Methods
- TELEMAC-3D
- TOMAWAC
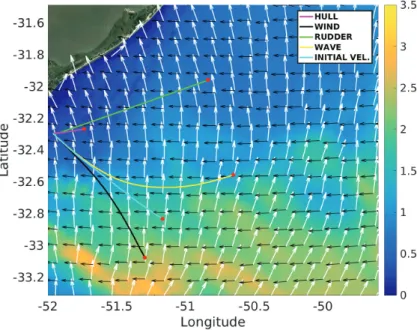
TELEMAC-3D is part of the TELEMAC-MASCARET open system, and is responsible for the hydrodynamics of this study. The MMG model is one of the various numerical methods used to solve simulations involving ship maneuvering and is used in this study. They define the physical characteristics of the ship used in the simulation and the environmental conditions surrounding the ship (water temperature, salinity, water density, significant wave height, wave speed and acceleration).
Wind data from NCEP/NCAR Reanalisys7 with spatial resolution of 1.875◦ and temporal resolution of 6 h were also used to force the surface conditions of the wave model.
Calibration and Validation
The Willmot Concordance Index (IC) [21] represents the model's ability to reproduce the observations, resulting in 0.70, the agreement of the model data provides good confidence. RMSE, MAE, Bias,modmean,obsmean,modstd,obsstdar are in the same units of the parameters, SI is in percent. Despite the differences presented (Table 2), other wave metrics (R2, Bias, SI and SS) were also applied to the analysis to better validate the accuracy of the model.
A slight overestimation of the model data above the buoy is observed as SS values are higher than 1.

Results and Discussions
In the case of the rudder, the ship oscillated around −0.2°, with a peak (−0.22°) around the first hour of the simulation. In the case of the hull, the ship did not oscillate after the first hour, remaining at 0.16°. In the case of no external forces, the ship did not exceed 0.1°, which is an almost linear change.
In the swinging motion, the hull case was the case that the ship had the greatest value, reached.
Environmental Management Systems and Balanced Scorecard: An Integrated Analysis of the
Marine Transport
Materials and Methods
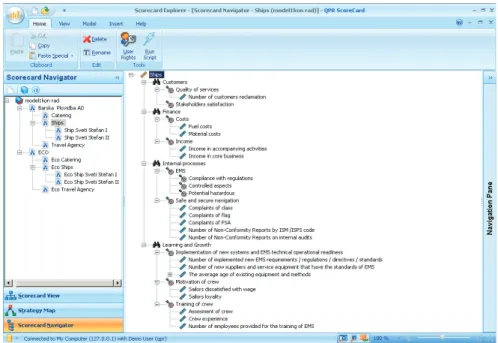
The graphical representation of the BSC in Figure 1, based on Reference [17], shows a translation path that goes beyond the concepts of mission, vision and strategy into a system of activities classified into 4 key perspectives [18]. The importance of the BSC is particularly evident in the Bottom-Up path, where activities aimed at achieving target values are defined with the aim of monitoring the degree of achievement of the objectives. How to integrate the environmental management system metrics of a particular organization into the Balanced Scorecard system and which approach is more effective.
In the paper "AD Barska plovidba", a for-profit organization based in Montenegro - an active maritime transport organization - was studied as an example of the implementation of an EMS approach based on a conventional BSC system.
Development
However, there are several examples of SBSC applications in the literature, but they always consider EMS in profitable situations. Therefore, management must first set strategic priorities for sustainable development and then use SBSC to implement the strategic priorities [42]. In this way, the use of management innovations would enable both employees and management to actively and effectively search for ways of operating in the field of environmental protection [45].
In Reference [46], an assessment of the effect of different environmental management strategies based on the port of Alexandria, all environmental aspects of the port were presented for relevance in the first place.
Results
To avoid creating a parallel management system with divergent objectives, it is necessary to include a key metric (objectives and measures) of the ECO BSC in the conventional BSC system. By adding one or more objectives of the ECO-BSC to the perspective of the conventional BSC;. Model 3, which corresponds to the inclusion of the EMS metric in the existing BSC: this model is similar to conventional BSC of Model 1, but without the ECO BSC;.
Model 4, which corresponds to the inclusion of EMS metrics in the newly created ECO perspective: this model is similar to the conventional BSC of Model 2, but without the ECO BSC.
Discussion 1. Model Assessment
Table 1 summarizes the areas of expertise for the external experts and the roles of the internal managers involved in the assessment. Incorporating the importance of goals into the perspectives obtained by applying AHP. An additional contribution of the paper can also be found in the way of creating the ECO BSC model.
This method is based on the special criteria of the ECO BSC system that covers the area of the EMS and has ECO perspective in the conventional BSC system that can connect these two systems.


![Table 1. Comparison of the results (present results and previous works [22,24–26]) for the investigated case studies.](https://thumb-ap.123doks.com/thumbv2/123dok/10250854.0/52.723.108.613.150.444/table-comparison-results-present-results-previous-investigated-studies.webp)