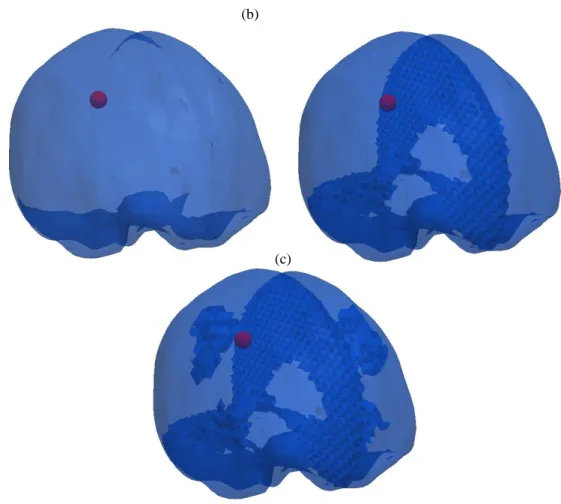
The circular part of the mesh, which is also shown in detail, represents the ICH. Detail (c) is the result of meshwork with dural septa, Sylvian fissure and incorporated central sulcus.
Specific Aims
Clinical Significance
- Disease Burden
- Diagnosis
- Treatment
A full discussion of adjuvant therapies for intracranial tumors is beyond the scope of this work. The other treatment of intracranial tumors assessed within the scope of this thesis is surgical resection.
Relevant Brain Anatomy
Improving the reliability of IGNS by updating the preoperative imaging to reflect the intraoperative configuration of the brain could improve patient outcomes. Experimental evidence suggests that intracranial pressure can vary spatially within the brain, possibly resulting from brain anatomy.
Computational Modeling
- Soft Tissue Modeling and Structure
- Tumor Growth Modeling and Structure
The elastic description of the brain dictates that the stress state depends only on tension [5]. Finally, hyperelastic descriptions of the brain dictate that the material can undergo large stresses and recover elastically [73].
Clinical Impact
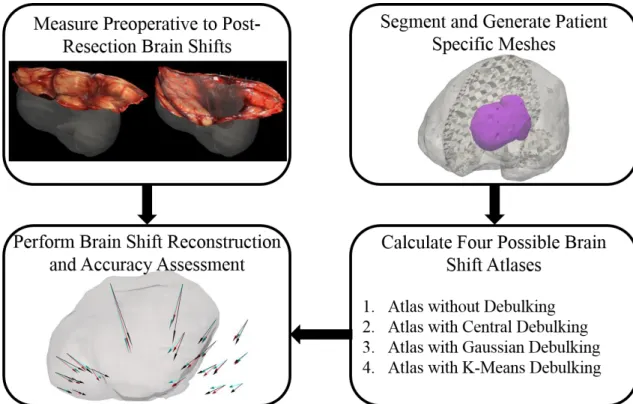
Accounting for realistic anatomical constraints and effects from space-occupying lesions (primary and metastatic tumors) can improve the fidelity of biomechanical models of the brain. This chapter describes the methods used to investigate the hypothesis that improving anatomical models of the brain by adding effects from space-occupying lesions will improve the predictive fidelity of biomechanical models of the brain for use in neurosurgical and interventional applications.
Experimental Procedures
- Retrospective in Vivo Porcine Experiment of Enhanced Brain Modeling
- Retrospective Tumor Modeling Experiment - Recurrence vs Necrosis
- Retrospective Brain Shift Correction Experiment
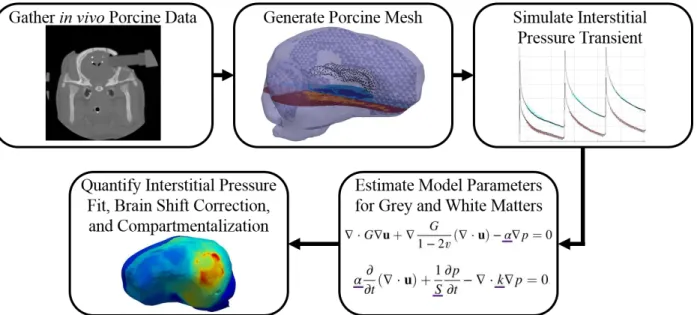
Using these estimates of the model parameters and the governing equations ((III.17.a), (III.17.b) and (III.17.c)), the von Mises stress field was calculated (Figure III.2) ). The simulated brain shifts were generated with forward runs of the finite element models in Sections III.2.2 and III.2.4.
Finite Element Modeling
- Finite Element Method Introduction
- Poroelastic Model of Brain Tissue
- Mechanically Coupled Tumor Growth Model
- Model of Tumor Cavity Collapse from Resection
Using the Galerkin method for weighted residuals, equations (III.1.a) and (III.1.b) are multiplied by 𝜙𝑖 (a spatially continuous weighting function) [96]. Using the Galerkin Method of Weighted Residuals, equations (III.59) are multiplied by 𝜙𝑖 (a spatially continuous weighting function) [96].
Optimization Methods
- Optimization Introduction
- Trust Region and Levenberg – Marquardt
- Constrained Least-Squared Minimization
Detailed specifications of the confidence region and the Levenberg-Marquardt optimization method and the constrained least-squares minimization are provided in Sections (III.3.2) and (III.3.3), respectively. The trust region method is a combination of the Newton method and the steepest descent method [100].
Method Conclusions
The problem that Aim 3 solves is more complex than the example presented, but since it is a constrained optimization, the same principles apply.
Summary and Contributions
To our knowledge, the quality reconstructions obtained in the full anatomical state description have not been performed in other studies of in vivo modeling of the brain.
In Vivo Modeling of Interstitial Pressure in a Porcine Model: Approximation of Poroelastic
- Introduction
- Materials and Methods
- Results
- Discussion
- Conclusions
The black points in the mesh visualize the junctions of the boundary between the brain parenchyma and the ventricles. The resolution of FACD involves the influence of the dural septa, ventricles, and sulci and gyri. Regarding equation (IV.3): the experimental data consists of 200 data points (100 per transducer) sampled evenly over time.
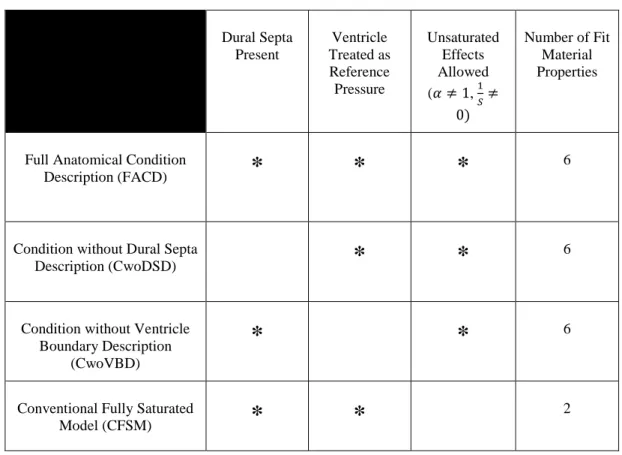
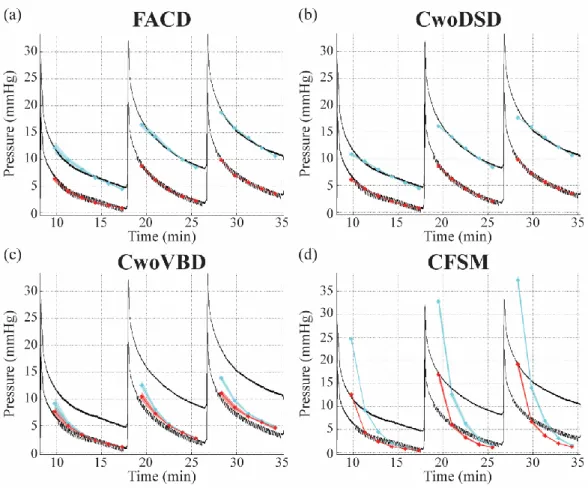
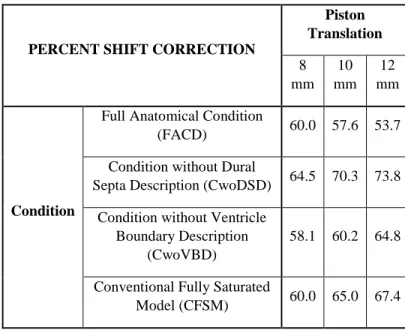
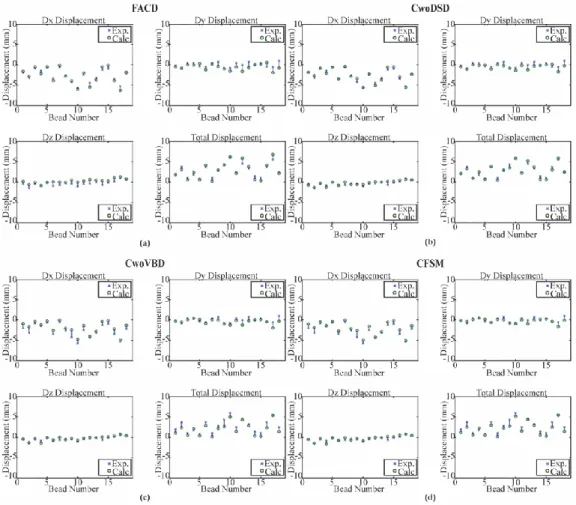
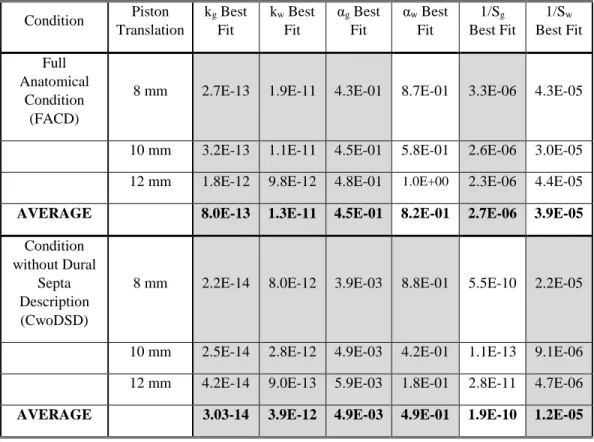
The pressure fits are the model-estimated pressure obtained by solving the inverse problem for (a) the complete anatomical condition (FACD), (b) the dural septa not included (CwoDSD), (c) the ventricular boundary condition not included (CwoVBD ), and (d) the brain tissue treated as fully saturated (CFSM). To compare displacements, we calculated the percent displacement correction using equation (IV.4) at the end of the piston translations per run model condition (Table IV.3). As a result, Table IV.4 shows the properties that best suit FACD and CwoDSD.
The percent drift correction in CwoDSD is consistently better than the other conditions (Table IV.3 and Figure IV.6). Treating the brain as a fully saturated tissue (Figure IV.4d) is the current convention in the literature when biphasic models are used. The percentage shift correction results are also comparable to FACD (Table IV.3 and Figure IV.6).
Summary and Contributions
Biophysical Model-Based Parameters to Classify Tumor Recurrence from Radiation-Induced
- Introduction
- Materials and Methods
- Results
- Discussion
- Conclusions
- Supplemental Material: Sensitivity to Manual Segmentation
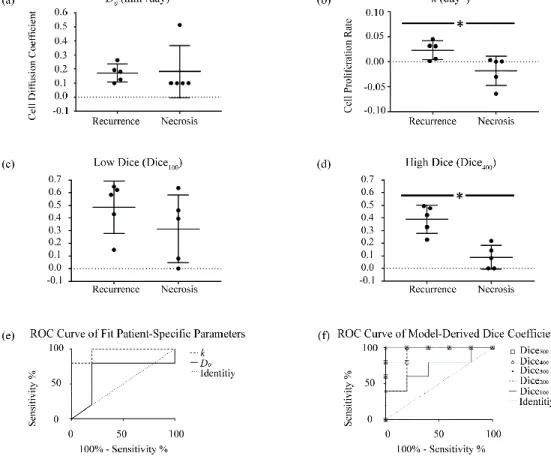
Here, a new framework is introduced that uses medical imaging data combined with biophysical models of tumor growth dynamics to noninvasively distinguish between tumor recurrence and radiation-induced necrosis in a binary classification of enhancing lesion etiology. We hypothesize that the biophysics of the etiologies will result in differences in patient-specific model parameters and model-derived measures that enable noninvasive classification. Using the segmentations, the tumor cell count in both T1-weighted images is estimated using the Gaussian description and is designated as 'observed tumor cellularity' (Figure V.2c-d, Figure V.3c-d).
Patient-specific model parameters and model-derived measurements are calculated using our biomechanically coupled tumor growth model, fitted to serial patient-specific imaging data. The distribution of patient-specific model parameters is shown in Figure V.4a and Figure V.4b, reflecting a clear distinction in proliferation rate. We plotted a receiver operating characteristic (ROC) curve for model parameters in Figure V.4e and model-derived measurements in Figure V.4f.
We present a framework to estimate patient-specific model parameters and model-derived measures based on non-invasive MRI data from patients with brain metastases treated with SRS. Visual confirmation in Figure V.2g and Figure V.3g, as well as the cube indices differentiating the etiologies, indicate that our use of image data is reasonable. The results of this study indicate that our image data-driven biophysical model-based analysis framework for estimating patient-specific model parameters and model-derived measures has the potential to non-invasively distinguish between radiation-induced necrosis and tumor recurrence.
Summary and Contributions
Accounting for Intraoperative Brain Shift Ascribable to Cavity Collapse during Intracranial
- Introduction
- Materials and Methods
- Results
- Discussion
- Conclusions
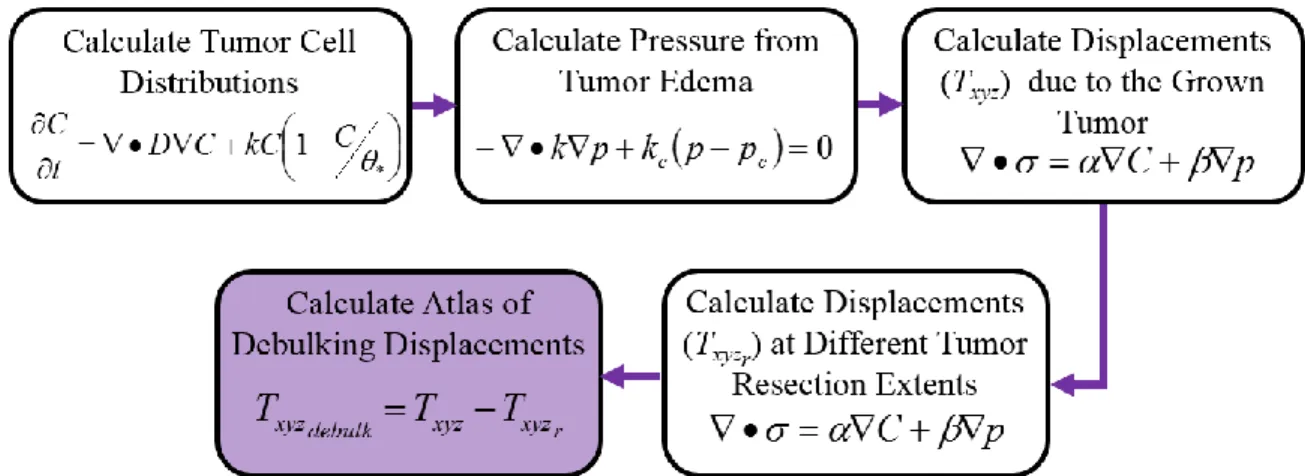
The longest axis in the tumor that moves closest to the mathematical centroid of the tumor is calculated. The results of the central debulking atlas are in Figure VI.6 and Tables VI.1 to VI.3. Qualitatively, from Figure VI.6, we can see that the central debulking atlas was used in four of the six patients.
In these four patients (Patients 1, 2, 3 and 5), involvement of the central atlas debulking Figure VI. The results of the Gaussian decomposition atlas are in Figure VI.6 and Tables VI.1 to VI.3. We can see that the Gaussian decomposition atlas contributed to the resolution of brain displacement in five of the six patients (Figure VI.6) and both simulated cases (Table VI.1).
The results of the k-means relief atlas are in Figure VI.6 and Tables VI.1 to VI.3. However, the AIC value was higher in the k-means relief atlas reconstruction compared to the central scatter method reconstruction (Table VI.1). The Gaussian debulking atlas improved percent displacement correction in five of six patients.

Evacuation of Other Intracranial Lesions
- Summary and Future Work
- Abstract
- Introduction
- Methods
- Results
- Discussion
- Conclusions
In the central evacuation representation, the cannula pressure is treated as Dirichlet BC with magnitude equal to the applied pressure. The new boundary of the evacuated cavity, represented by the blue circle in Figure VII.2.a is where the applied pressure is now redistributed during the second iteration. This process can be repeated ad infinitum, as required to properly represent the cannula path during ICH evacuation.
Then, using a series of volumetric sinks, the {𝐵}vector (Equation VII.6) is filled with three states representing the same three deployments of the cannula. In addition, they capture the bulk deformation of the surrounding tissue to the area of evacuation (Figure VII.5, Panels c, f, and i). The factorization of matrix [A] (Equation VII.6) is the most computationally intensive step in the calculation of the solution of the models [96].
Figure VII.6 shows a cut through the brain, near the location where the cannula was placed. In Figure VII.6.a it is clear that most of the movement occurs closest to the location where the pressure is applied. There are substantial differences in the representation of the cannula between the central evacuation representation and both superposition evacuation representations.
Modeling of Fissures
- Background
- Treatment of Fissures
- Soil Column Investigations
- Brain Pressure Infusion Simulations
- Clinical Applications
- Future Studies to Investigation Fissure Representation
On the right side of the column, the pressure and displacement were fixed at 0. Due to the partial splitting of the mesh, some pressure was still moved from the left side of the rectangle to the right side. Looking at the deformed solution, it was seen that the left side of the rectangle folds into the right side of the rectangle (Figure VII.9).
However, the boundary condition at the split resulted in very limited displacement, confining most of the deformation to the left side of the rectangular grid. The boundary conditions applied to all three were a slip condition on the outer surface of all three grids (Figure VII.12), representing the outer dura of the brain. There was also a change in the distribution of the pressure solution (Figure VII.14.b) due to the presence of the dural barrier.
Detail (a) is the results of the mesh, which treats the brain as a completely homogeneous material. The addition of the dural septa in the mesh changed the pressure gradients, relative to the simulation with no features, but there were still gradients through the tear boundary (Figure VII.15.b). Based on the results, the description of the crack boundary condition can be further refined.
Thesis Conclusions
Summary and Contributions
Analytical Solution - Model of Pressure Based on the Tumor’s Edema
Geometry
Test Problem 1 – No Edema Everywhere
Test Problem 2 – Edema Everywhere
The boundary condition on the right side of the rectangle (Figure A.1) is a fixed pressure of 𝑝5 (𝑥 = 𝛥𝑥, 𝑝 = 𝑝5).
Analytical Solution – Displacements with the Tumor Present
Geometry
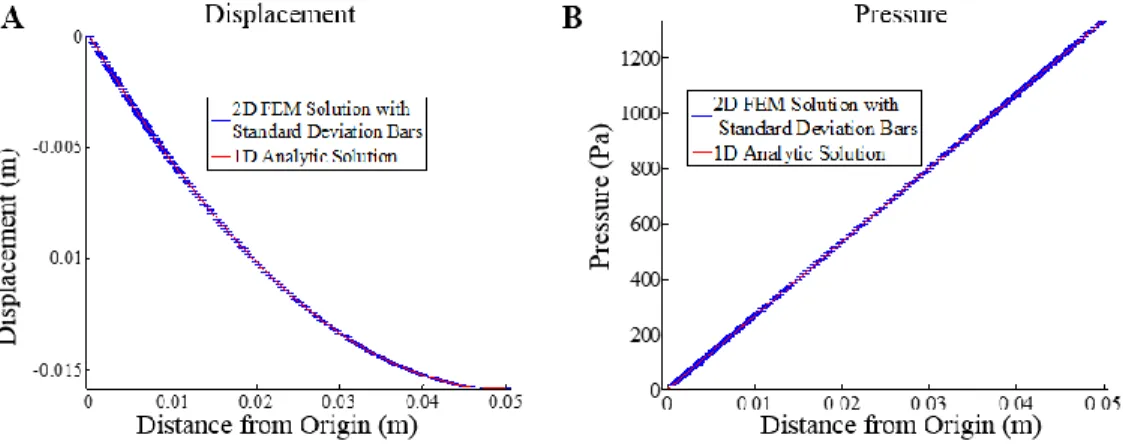
The 3D solution generated by the finite element model was compared with the analogous 1D solution in spherical coordinates.
Analytic Solution of the Pressure Gradient
The geometry of the 1D problem is a concentric circle (Figure A.2) where the displacement was constrained to be in the radial direction.
Analytic Solution of Displacement
Chen et al., “Intraoperative Brain Shift Compensation: Accounting for Dural Septa,” IEEE Trans Biomed Eng, vol. Minniti et al., "Stereotactic radiosurgery for brain metastases: analysis of outcome and risk of brain radionecrosis," Radiation Oncology, vol. Clatz et al., "Robust Nonrigid Registration to Capture Brain Shift from Intraoperative MRI," IEEE Trans Med Imaging, vol.
Ferrant et al., “Serial Registration of Intraoperative Mr Images of the Brain,” Med Image Anal, vol. Hu et al., “Intraoperative brain shift prediction using a 3D inhomogeneous patient-specific finite element model,” J Neurosurg, vol. Shah et al., “Radiation Necrosis in the Brain: Imaging Features and Differentiation from Tumor Recurrence,” Radiographics, vol.
Yankeelov et al., "Clinically Relevant Modeling of Tumor Growth and Treatment Response," Sci Transl Med, vol. Lin et al., "Response Assessment Criteria for Brain Metastases: Proposal from the Rano Group," Lancet Oncol, vol. Anderson et al., "Hurtig blodtrykssænkning hos patienter med akut intracerebral blødning," N Engl J Med, vol.