LEARNING OBJECTIVESS After reading this chapter, you will be able to answer the following questions:
1. What are the different types of decisions and how does the decision-making process work?
2. How do information systems support the activities of managers and management decision making?
3. How do business intelligence and business analytics support decision making?
4. How do different decision-making constituencies in an organization use business intelligence?
5. What is the role of information systems in helping people working in a group make decisions more efficiently?
CHAPTER OUTLINE
12.1 DECISION MAKING AND INFORMATION SYSTEMS
Business Value of Improved Decision Making Types of Decisions
The Decision-Making Process
Managers and Decision Making in the Real World High-Velocity Automated Decision Making
12.2 BUSINESS INTELLIGENCE IN THE ENTERPRISE
What Is Business Intelligence?
The Business Intelligence Environment
Business Intelligence and Analytics Capabilities Management Strategies for Developing BI and BA
Capabilities
12.3 BUSINESS INTELLIGENCE CONSTITUENCIES Decision Support for Operational and Middle
Management
Decision Support for Senior Management: The Balanced Scorecard and Enterprise Performance Management Methods
Group Decision-Support Systems (GDSS)
12.4 HANDS-ON MIS PROJECTS Management Decision Problems
Improving Decision Making: Using Pivot Tables to Analyze Sales Data
Improving Decision Making: Using a Web-Based DSS for Retirement Planning
LEARNING TRACK MODULE Building and Using Pivot Tables
Chapter 12
Enhancing Decision Making
Interactive Sessions:
Data-Driven Schools Piloting Valero with Real
Time Management
453 hat’s the best way to get a discount on your morning coffee at Starbucks? Well,
if you live in Manhattan, you could get up an hour early and take the subway downtown to Brooklyn. A single expresso is 10 cents cheaper than in your neighborhood, as are a caffee latte and slice of lemon pound cake. But a muffin runs 10 cents more uptown in Marble Hill, and a tall Pike’s Place Roast costs $1.70 no mat- ter where you live.
Starbucks is one of many retailers using sophisticated software to analyze, store by store and item by item, how demand responds to changes in price. What customers are willing to pay for certain items depends very much on the neighborhood or even the region of the country where they live. Shoppers in certain locations are willing to pay more.
The Duane Reade drugstore chain, recently purchased by Walgreens, is also adept at adjusting prices. Software analyzing sales patterns found that parents of newborn babies are not as price-sensitive as those with toddlers, so the company was able to raise prices on diapers for newborn infants without losing sales. The chain’s information systems also showed how to adjust pricing based on location. Shoppers at the Duane Reade store near 86th Street and Lexington Avenue pay 20 cents more for a box of Kleenex and 50 cents more for a bottle of Pepto-Bismol than customers in Harlem.
Business analytics software such as that used by Duane Reade typically analyzes patterns in sales data to create a “pricing profile.” A store near a big commuting hub might discount convenience items to present a low-cost image while one in a family neighborhood with many young children might discount baby items to get more people through the door.
Analyzing large troves of digital sales and customer information from both online and physical stores also helps retailers decide what to sell as well. Fashion Web site HauteLook confirmed that Southerners buy more white, green, and pink than people from other regions, while ShopItToMe learned that the average woman spends less on fashion in Dallas than in Washington D.C. and that women are thinner on both coasts than in the U.S.
heartland and wear more petite clothing and shoe sizes meant for smaller women.
How much of a difference does this knowledge make? Lots. 1-800-Flowers, which sells flow- ers and gift baskets online, has used analytics software from SAS Inc. to tweak its online storefront and marketing activities. The software helped the company quickly record and analyze buyer profiles to help improve targeting of its product, determine what “specials” to
W
offer, and plan sales and mar- keting strategies based on an understanding of real cus- tomer needs. The company is able to quickly change prices and offerings on its Web site—often every hour. In the first half of 2010, 1-800- Flowers used more finely tar- geted Web pages and e-mail promotions to improve the conversion rate of Web site browsers to buyers by 20 per- cent.
Sources:Anne Kadet, “Price-Point Politics,” The Wall Street Journal, July 24, 2010; Steve Lohr,
“A Data Explosion Remakes Retailing,” and Christina Binkley, “Fashion Nation: What Retailers Know about Us,” The Wall Street Journal, July 28, 2010.
T
he experiences of Starbucks, Duane Reade, and 1-800-Flowers are power- ful illustrations of how information systems improve decision making.Managers at these retail chains were unable to make good decisions about what prices to charge to improve profitability and what items to sell in stores to maximize sales at different locations and different time periods. They had access to customer purchase data, but they were unable to analyze millions of pieces of data on their own. Bad decisions about how much to charge and how to stock stores lowered sales revenue and prevented these companies from responding quickly to customer needs.
The chapter-opening diagram calls attention to important points raised by this case and this chapter. Starbucks, Duane Reade, and 1-800-Flowers started using business intelligence software, which is able to find patterns and trends in massive quantities of data. Information from these business intelligence systems helps managers at these companies make better decisions about pricing, shelf stocking, and product offerings. They are able to see where they can charge a higher price or where they must lower prices to maximize sales revenue, as well as what items to stock and when to change their merchandise mix. Better decision making using business intelligence has made all of these companies more profitable.
12.1 D ECISION M AKING AND I NFORMATION S YSTEMS
ecision making in businesses used to be limited to management.
Today, lower-level employees are responsible for some of these decisions, as information systems make information available to lower levels of the business. But what do we mean by better decision making? How does decision making take place in businesses and other organizations? Let’s take a closer look.
BUSINESS VALUE OF IMPROVED DECISION MAKING
What does it mean to the business to make better decisions? What is the monetary value of improved decision making? Table 12-1 attempts to measure the monetary value of improved decision making for a small U.S. manufactur- ing firm with $280 million in annual revenue and 140 employees. The firm has identified a number of key decisions where new system investments might improve the quality of decision making. The table provides selected estimates of annual value (in the form of cost savings or increased revenue) from improved decision making in selected areas of the business.
We can see from Table 12-1 that decisions are made at all levels of the firm and that some of these decisions are common, routine, and numerous.
Although the value of improving any single decision may be small, improving hundreds of thousands of “small” decisions adds up to a large annual value for the business.
TYPES OF DECISIONS
Chapters 1 and 2 showed that there are different levels in an organization. Each of these levels has different information requirements for decision support and responsibility for different types of decisions (see Figure 12-1). Decisions are classified as structured, semistructured, and unstructured.
D
TABLE 12-1BUSINESS VALUE OF ENHANCED DECISION MAKING
ESTIMATED VALUE TO
NUMBER OF FIRM OF A SINGLE
EXAMPLE DECISION DECISION MAKER ANNUAL DECISIONS IMPROVED DECISION ANNUAL VAUE
Allocate support to most Accounts manager 12 $ 100,000 $1,200,000
valuable customers
Predict call center Call center management 4 150,000 600,000
daily demand
Decide parts inventory Inventory manager 365 5,000 1,825,000
levels daily
Identify competitive bids Senior management 1 2,000,000 2,000,000
from major suppliers
Schedule production Manufacturing manager 150 10,000 1,500,000
to fill orders
Allocate labor to Production floor manager 100 4,000 400,000
complete a job
Unstructured decisions are those in which the decision maker must provide judgment, evaluation, and insight to solve the problem. Each of these decisions is novel, important, and nonroutine, and there is no well-understood or agreed-on procedure for making them.
Structured decisions, by contrast, are repetitive and routine, and they involve a definite procedure for handling them so that they do not have to be treated each time as if they were new. Many decisions have elements of both types of decisions and are semistructured, where only part of the problem has a clear-cut answer provided by an accepted procedure. In general, structured decisions are more prevalent at lower organizational levels, whereas unstruc- tured problems are more common at higher levels of the firm.
Senior executives face many unstructured decision situations, such as establishing the firm’s five- or ten-year goals or deciding new markets to enter.
Answering the question “Should we enter a new market?” would require access to news, government reports, and industry views as well as high-level summaries of firm performance. However, the answer would also require senior managers to use their own best judgment and poll other managers for their opinions.
Middle management faces more structured decision scenarios but their decisions may include unstructured components. A typical middle-level management decision might be “Why is the reported order fulfillment report showing a decline over the past six months at a distribution center in Minneapolis?” This middle manager will obtain a report from the firm’s enterprise system or distribution management system on order activity and operational efficiency at the Minneapolis distribution center. This is the structured part of the decision. But before arriving at an answer, this middle manager will have to interview employees and gather more unstructured infor- mation from external sources about local economic conditions or sales trends.
FIGURE 12-1 INFORMATION REQUIREMENTS OF KEY DECISION-MAKING GROUPS IN A FIRM
Senior managers, middle managers, operational managers, and employees have different types of decisions and information requirements.
Operational management and rank-and-file employees tend to make more structured decisions. For example, a supervisor on an assembly line has to decide whether an hourly paid worker is entitled to overtime pay. If the employee worked more than eight hours on a particular day, the supervisor would routinely grant overtime pay for any time beyond eight hours that was clocked on that day.
A sales account representative often has to make decisions about extending credit to customers by consulting the firm’s customer database that contains credit information. If the customer met the firm’s prespecified criteria for granting credit, the account representative would grant that customer credit to make a purchase. In both instances, the decisions are highly structured and are routinely made thousands of times each day in most large firms. The answer has been preprogrammed into the firm’s payroll and accounts receivable systems.
THE DECISION-MAKING PROCESS
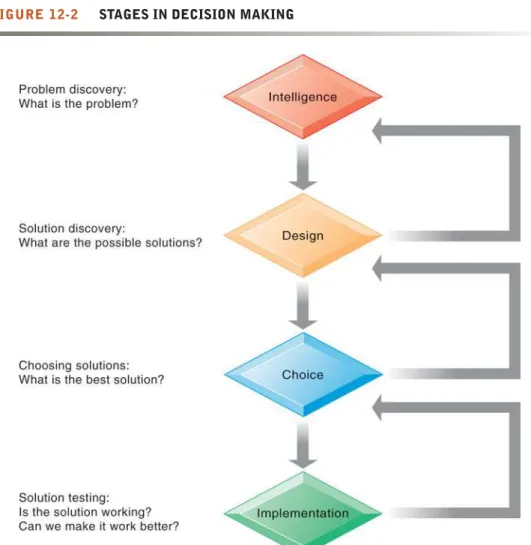
Making a decision is a multistep process. Simon (1960) described four different stages in decision making: intelligence, design, choice, and implementation (see Figure 12-2).
FIGURE 12-2 STAGES IN DECISION MAKING
The decision-making process is broken down into four stages.
Intelligence consists of discovering, identifying, and understanding the problems occurring in the organization—why a problem exists, where, and what effects it is having on the firm.
Design involves identifying and exploring various solutions to the problem.
Choiceconsists of choosing among solution alternatives.
Implementationinvolves making the chosen alternative work and continu- ing to monitor how well the solution is working.
What happens if the solution you have chosen doesn’t work? Figure 12-2 shows that you can return to an earlier stage in the decision-making process and repeat it if necessary. For instance, in the face of declining sales, a sales management team may decide to pay the sales force a higher commission for making more sales to spur on the sales effort. If this does not produce sales increases, managers would need to investigate whether the problem stems from poor product design, inadequate customer support, or a host of other causes that call for a different solution.
MANAGERS AND DECISION MAKING IN THE REAL WORLD
The premise of this book and this chapter is that systems to support decision making produce better decision making by managers and employees, above average returns on investment for the firm, and ultimately higher profitability.
However, information systems cannot improve all the different kinds of decisions taking place in an organization. Let’s examine the role of managers and decision making in organizations to see why this is so.
M a n a g e r i a l R o l e s
Managers play key roles in organizations. Their responsibilities range from making decisions, to writing reports, to attending meetings, to arranging birthday parties. We are able to better understand managerial functions and roles by examining classical and contemporary models of managerial behavior.
The classical model of management, which describes what managers do, was largely unquestioned for the more than 70 years since the 1920s. Henri Fayol and other early writers first described the five classical functions of managers as planning, organizing, coordinating, deciding, and controlling. This description of management activities dominated management thought for a long time, and it is still popular today.
The classical model describes formal managerial functions but does not address what exactly managers do when they plan, decide things, and control the work of others. For this, we must turn to the work of contemporary behav- ioral scientists who have studied managers in daily action. Behavioral models state that the actual behavior of managers appears to be less systematic, more informal, less reflective, more reactive, and less well organized than the classi- cal model would have us believe.
Observers find that managerial behavior actually has five attributes that differ greatly from the classical description. First, managers perform a great deal of work at an unrelenting pace—studies have found that managers engage in more than 600 different activities each day, with no break in their pace.
Second, managerial activities are fragmented; most activities last for less than nine minutes, and only 10 percent of the activities exceed one hour in duration. Third, managers prefer current, specific, and ad hoc information (printed information often will be too old). Fourth, they prefer oral forms of
communication to written forms because oral media provide greater flexibil- ity, require less effort, and bring a faster response. Fifth, managers give high priority to maintaining a diverse and complex web of contacts that acts as an informal information system and helps them execute their personal agendas and short- and long-term goals.
Analyzing managers’ day-to-day behavior, Mintzberg found that it could be classified into 10 managerial roles. Managerial roles are expectations of the activities that managers should perform in an organization. Mintzberg found that these managerial roles fell into three categories: interpersonal, informa- tional, and decisional.
Interpersonal Roles.Managers act as figureheads for the organization when they represent their companies to the outside world and perform symbolic duties, such as giving out employee awards, in their interpersonal role.
Managers act as leaders, attempting to motivate, counsel, and support subordi- nates. Managers also act as liaisons between various organizational levels;
within each of these levels, they serve as liaisons among the members of the management team. Managers provide time and favors, which they expect to be returned.
Informational Roles. In their informational role, managers act as the nerve centers of their organizations, receiving the most concrete, up-to-date informa- tion and redistributing it to those who need to be aware of it. Managers are therefore information disseminators and spokespersons for their organizations.
Decisional Roles. Managers make decisions. In their decisional role, they act as entrepreneurs by initiating new kinds of activities; they handle distur- bances arising in the organization; they allocate resources to staff members who need them; and they negotiate conflicts and mediate between conflicting groups.
Table 12-2, based on Mintzberg’s role classifications, is one look at where systems can and cannot help managers. The table shows that information sys- tems are now capable of supporting most, but not all, areas of management life.
TABLE 12-2MANAGERIAL ROLES AND SUPPORTING INFORMATION SYSTEMS
ROLE BEHAVIOR SUPPORT SYSTEMS
Interpersonal Roles
Figurehead Telepresence systems
Leader Interpersonal Telepresence, social networks, Twitter
Liaison Smartphones, social networks
Informational Roles
Nerve center Management information systems, ESS
Disseminator Information E-mail, social networks
Spokesperson processing Webinars, telepresence
Decisional Roles
Entrepreneur Decision None exist
Disturbance handler making None exist
Resource allocator Business intelligence, DSS systems
Negotiator None exist
Sources: Kenneth C. Laudon and Jane P. Laudon; and Mintzberg, 1971.
R e a l - W o r l d D e c i s i o n M a k i n g
We now see that information systems are not helpful for all managerial roles.
And in those managerial roles where information systems might improve decisions, investments in information technology do not always produce positive results. There are three main reasons: information quality, manage- ment filters, and organizational culture (see Chapter 3).
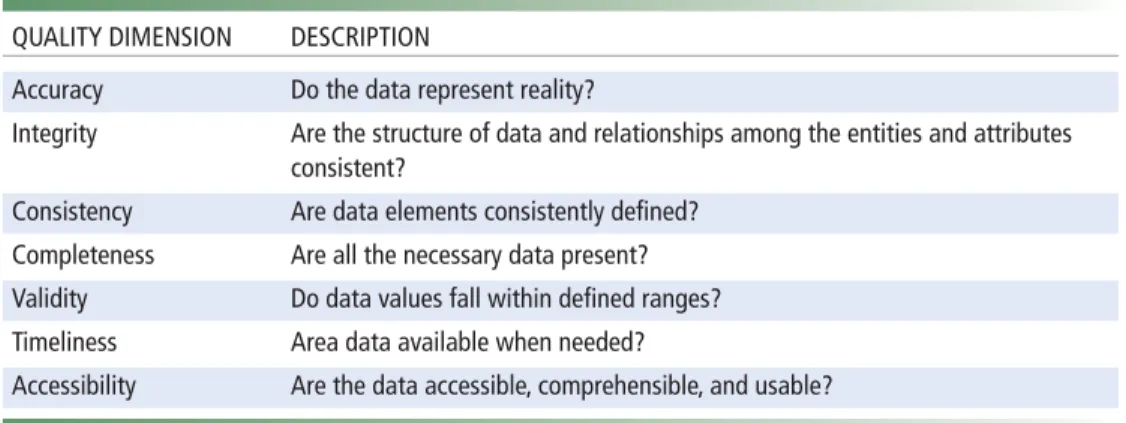
Information Quality. High-quality decisions require high-quality informa- tion. Table 12-3 describes information quality dimensions that affect the quality of decisions.
If the output of information systems does not meet these quality criteria, decision-making will suffer. Chapter 6 has shown that corporate databases and files have varying levels of inaccuracy and incompleteness, which in turn will degrade the quality of decision making.
Management Filters. Even with timely, accurate information, some man- agers make bad decisions. Managers (like all human beings) absorb information through a series of filters to make sense of the world around them. Managers have selective attention, focus on certain kinds of problems and solutions, and have a variety of biases that reject information that does not conform to their prior conceptions.
For instance, Wall Street firms such as Bear Stearns and Lehman Brothers imploded in 2008 because they underestimated the risk of their investments in complex mortgage securities, many of which were based on subprime loans that were more likely to default. The computer models they and other financial institutions used to manage risk were based on overly optimistic assumptions and overly simplistic data about what might go wrong. Management wanted to make sure that their firms’ capital was not all tied up as a cushion against defaults from risky investments, preventing them from investing it to generate profits. So the designers of these risk management systems were encouraged to measure risks in a way that minimzed their importance. Some trading desks also oversimplified the information maintained about the mortgage securities to make them appear as simple bonds with higher ratings than were warranted by their underlying components (Hansell, 2008).
Organizational Inertia and Politics.Organizations are bureaucracies with limited capabilities and competencies for acting decisively. When environ- ments change and businesses need to adopt new business models to survive,
TABLE 12-3 INFORMATION QUALITY DIMENSIONS
QUALITY DIMENSION DESCRIPTION
Accuracy Do the data represent reality?
Integrity Are the structure of data and relationships among the entities and attributes consistent?
Consistency Are data elements consistently defined?
Completeness Are all the necessary data present?
Validity Do data values fall within defined ranges?
Timeliness Area data available when needed?
Accessibility Are the data accessible, comprehensible, and usable?
strong forces within organizations resist making decisions calling for major change. Decisions taken by a firm often represent a balancing of the firm’s various interest groups rather than the best solution to the problem.
Studies of business restructuring find that firms tend to ignore poor perfor- mance until threatened by outside takeovers, and they systematically blame poor performance on external forces beyond their control such as economic conditions (the economy), foreign competition, and rising prices, rather than blaming senior or middle management for poor business judgment (John, Lang, Netter, et al., 1992).
HIGH-VELOCITY AUTOMATED DECISION MAKING
Today, many decisions made by organizations are not made by managers, or any humans. For instance, when you enter a query into Google’s search engine, Google has to decide which URLs to display in about half a second on average (500 milliseconds). Google indexes over 50 billion Web pages, although it does not search the entire index for every query it receives. The same is true of other search engines. The New York Stock Exchange is spending over $450 million in 2010–2011 to build a trading platform that can executes incoming orders in less that 50 milliseconds. High frequency traders at electronic stock exchanges exe- cute their trades in under 30 milliseconds.
The class of decisions that are highly structured and automated is growing rapidly. What makes this kind of automated high-speed decision making possible are computer algorithms that precisely define the steps to be followed to produce a decision, very large databases, very high-speed processors, and software optimized to the task. In these situations, humans (including managers) are eliminated from the decision chain because they are too slow.
This also means organizations in these areas are making decisions faster than what managers can monitor or control. Inability to control automated decisions was a major factor in the “Flash Crash” experienced by U.S. stock markets on May 6, 2010, when the Dow Jones Industrial Average fell over 600 points in a matter of minutes before rebounding later that day. The stock market was overwhelmed by a huge wave of sell orders triggered primarily by high-speed computerized trading programs within a few seconds, causing shares of some companies like Proctor & Gamble to sell for pennies.
How does the Simon framework of intelligence-design-choice-implementa- tion work in high-velocity decision environments? Essentially, the intelligence, design, choice, and implementation parts of the decision-making process are captured by the software’s algorithms. The humans who wrote the software have already identified the problem, designed a method for finding a solution, defined a range of acceptable solutions, and implemented the solution. Obviously, with humans out of the loop, great care needs to be taken to ensure the proper oper- ation of these systems lest they do significant harm to organizations and humans. And even then additional safeguards are wise to observe the behavior of these systems, regulate their performance, and if necessary, turn them off.
12.2 B USINESS I NTELLIGENCE IN THE E NTERPRISE
Chapter 2 introduced you to the different types of systems used for supporting management decision making. At the foundation of all of these decision support systems are business intelligence and business analytics infrastructure
that supplies the data and the analytic tools for supporting decision making.
In this section, we want to answer the following questions:
• What are business intelligence (BI) and business analytics (BA)
• Who makes business intelligence and business analytics hardware and software?
• Who are the users of business intelligence?
• What kinds of analytical tools come with a BI/BA suite?
• How do managers use these tools?
• What are some examples of firms who have used these tools?
• What management strategies are used for developing BI/BA capabilities?
WHAT IS BUSINESS INTELLIGENCE?
When we think of humans as intelligent beings we often refer to their ability to take in data from their environment, understand the meaning and significance of the information, and then act appropriately. Can the same be said of business firms? The answer appears to be a qualified “yes.” All organizations, including business firms, do indeed take in information from their environ- ments, attempt to understand the meaning of the information, and then attempt to act on the information. Just like human beings, some business firms do this well, and others poorly.
“Business intelligence” is a term used by hardware and software vendors and information technology consultants to describe the infrastructure for warehousing, integrating, reporting, and analyzing data that comes from the business environment. The foundation infrastructure collects, stores, cleans, and makes relevant information available to managers. Think databases, data warehouses, and data marts described in Chapter 6. “Business analytics” is also a vendor-defined term that focuses more on tools and techniques for analyzing and understanding data. Think online analytical processing (OLAP), statistics, models, and data mining, which we also introduced in Chapter 6.
So, stripped to its essentials, business intelligence and analytics are about integrating all the information streams produced by a firm into a single, coher- ent enterprise-wide set of data, and then, using modeling, statistical analysis tools (like normal distributions, correlation and regression analysis, Chi square analysis, forecasting, and cluster analysis), and data mining tools (pattern discovery and machine learning), to make sense out of all these data so managers can make better decisions and better plans, or at least know quickly when their firms are failing to meet planned targets.
One company that uses business intelligence is Hallmark Cards. The company uses SAS Analytics software to improve its understanding of buying patterns that could lead to increased sales at more than 3,000 Hallmark Gold Crown stores in the United Sates. Hallmark wanted to strengthen its relation- ship with frequent buyers. Using data mining and predictive modeling, the company determined how to market to various consumer segments during holidays and special occasions as well as adjust promotions on the fly.
Hallmark is able to determine which customer segments are most influenced by direct mail, which should be approached through e-mail, and what specific messages to send each group. Business intelligence has helped boost Hallmark sales to its loyalty program members by 5 to 10 percent.
B u s i n e s s I n t e l l i g e n c e Ve n d o r s
It is important to remember that business intelligence and analytics are products defined by technology vendors and consulting firms. They consist of hardware and software suites sold primarily by large system vendors to very large Fortune 500 firms. The largest five providers of these products are SAP, Oracle, IBM, SAS Institute, and Microsoft (see Table 12-4). Microsoft’s products are aimed at small to medium size firms, and they are based on desktop tools familiar to employees (such as Excel spreadsheet software), Microsoft Sharepoint collaboration tools, and Microsoft SQL Server database software. The size of the American BI and BA marketplace in 2010 is estimated to be $10.5 billion and growing at over 20%
annually (Gartner, 2010). This makes business intelligence and business analytics one of the fastest-growing and largest segments in the U.S. software market.
THE BUSINESS INTELLIGENCE ENVIRONMENT
Figure 12-3 gives an overview of a business intelligence environment, high- lighting the kinds of hardware, software, and management capabilities that the major vendors offer and that firms develop over time. There are six elements in this business intelligence environment:
• Data from the business environment:Businesses must deal with both structured and unstructured data from many different sources, including mobile devices and the Internet. The data need to be integrated and orga- nized so that they can be analyzed and used by human decision makers.
• Business intelligence infrastructure:The underlying foundation of busi- ness intelligence is a powerful database system that captures all the relevant data to operate the business. The data may be stored in transactional data- bases or combined and integrated into an enterprise-data warehouse or series of interrelated data marts.
• Business analytics toolset:A set of software tools are used to analyze data and produce reports, respond to questions posed by managers, and track the progress of the business using key indicators of performance.
• Managerial users and methods:Business intelligence hardware and soft- ware are only as intelligent as the human beings who use them. Managers impose order on the analysis of data using a variety of managerial methods that define strategic business goals and specify how progress will be mea- sured. These include business performance management and balanced score- card approaches focusing on key performance indicators and industry strate- gic analyses focusing on changes in the general business environment, with special attention to competitors. Without strong senior management over-
TABLE 12-4 MARKET LEADERS AND SHARE FOR THE TOP BUSINESS INTELLIGENCE VENDORS
VENDOR MARKET SHARE BUSINESS INTELLIGENCE SOFTWARE
SAP 25% SAP BusinessObjects EPM Solutions
SAS Institute 15% SAS Activity Based Management; financial, human capital, profitability, and strategy management
Oracle 14% Enterprise Performance Management System
IBM 11% IBM Cognos
Microsoft 7% SQL Server with PowerPivot
sight, business analytics can produce a great deal of information, reports, and online screens that focus on the wrong matters and divert attention from the real issues. You need to remember that, so far, only humans can ask intelli- gent questions.
• Delivery platform—MIS, DSS, ESS.The results from business intelligence and analytics are delivered to managers and employees in a variety of ways, depending on what they need to know to perform their jobs. MIS, DSS, and ESS, which we introduced in Chapter 2, deliver information and knowledge to different people and levels in the firm—operational employees, middle managers, and senior executives. In the past, these systems could not share data and operated as independent systems. Today, one suite of hardware and software tools in the form of a business intelligence and analytics package is able to integrate all this information and bring it to managers’ desktop or mobile platforms.
• User interface:Business people are no longer tied to their desks and desk- tops. They often learn quicker from a visual representation of data than from a dry report with columns and rows of information. Today’s business analytics software suites emphasize visual techniques such as dashboards and score- cards. They also are able to deliver reports on Blackberrys, iPhones, and other mobile handhelds as well as on the firm’s Web portal. BA software is adding capabilities to post information on Twitter, Facebook, or internal social media to support decision making in an online group setting rather than in a face-to- face meeting.
BUSINESS INTELLIGENCE AND ANALYTICS CAPABILITIES
Business intelligence and analytics promise to deliver correct, nearly real-time information to decision makers, and the analytic tools help them quickly FIGURE 12-3 BUSINESS INTELLIGENCE AND ANALYTICS FOR DECISION SUPPORT
Business intelligence and analytics requires a strong database foundation, a set of analytic tools, and an involved management team that can ask intelligent questions and analyze data.
understand the information and take action. There are 5 analytic functionalities that BI systems deliver to achieve these ends:
• Production reports:These are predefined reports based on industry-spe- cific requirements (see Table 12-5).
• Parameterized reports.Users enter several parameters as in a pivot table to filter data and isolate impacts of parameters. For instance, you might want to enter region and time of day to understand how sales of a product vary by region and time. If you were Starbucks, you might find that customers in the East buy most of their coffee in the morning, whereas in the Northwest customers buy coffee throughout the day. This finding might lead to different marketing and ad campaigns in each region. (See the discussion of pivot tables in Section 12.3).
• Dashboards/scorecards:These are visual tools for presenting performance data defined by users
• Ad hoc query/search/report creation:These allow users to create their own reports based on queries and searches
• Drill down: This is the ability to move from a high-level summary to a more detailed view
• Forecasts, scenarios, models: These include the ability to perform linear forecasting, what-if scenario analysis, and analyze data using standard statis- tical tools.
W h o U s e s B u s i n e s s I n t e l l i g e n c e a n d B u s i n e s s A n a l y t i c s ?
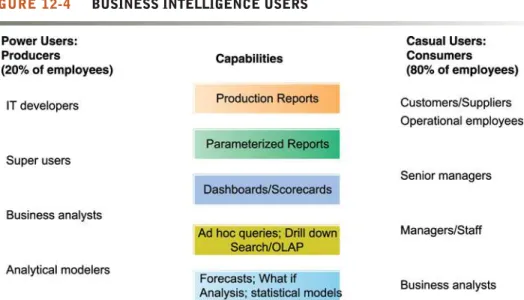
In previous chapters, we have described the different information constituen- cies in business firms—from senior managers to middle managers, analysts, and operational employees. This also holds true for BI and BA systems (see Figure 12-4). Over 80 percent of the audience for BI consists of casual users who rely largely on production reports. Senior executives tend use BI to monitor firm activities using visual interfaces like dashboards and scorecards.
Middle managers and analysts are much more likely to be immersed in the data and software, entering queries and slicing and dicing the data along different
FIGURE 12-4 BUSINESS INTELLIGENCE USERS
Casual users are consumers of BI output, while intense power users are the producers of reports, new analyses, models, and forecasts.
dimensions. Operational employees will, along with customers and suppliers, be looking mostly at prepackaged reports.
E x a m p l e s o f B u s i n e s s I n t e l l i g e n c e A p p l i c a t i o n s
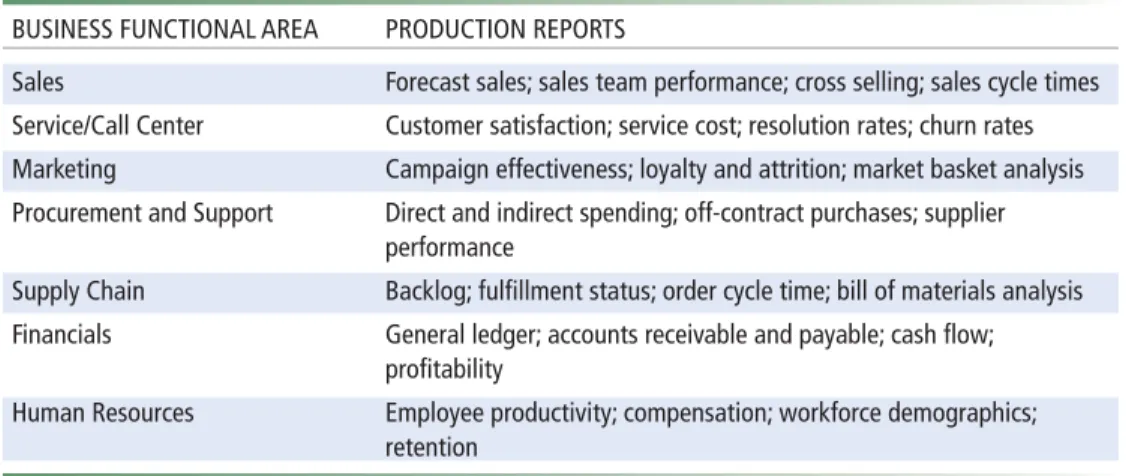
The most widely used output of a BI suite of tools are pre-packaged production reports. Table 12-5 illustrates some common pre-defined reports from Oracle’s BI suite of tools.
P r e d i c t i v e A n a l y t i c s
Predictive analytics, which we introduced in Chapter 6, are being built into mainstream applications for everyday decision making by all types of employ- ees, especially in finance and marketing. For example, Capital One conducts more than 30,000 experiments each year using different interest rates, incen- tives, direct mail packaging, and other variables to identify the best potential customers for targeting its credit card offers. These people are most likely to sign up for credit cards and to pay back Capital One for the balances they ring up in their credit card accounts. Predictive analytics have also worked espe- cially well in the credit card industry to identify customers who are at risk for leaving.
Dealer Services, which offers inventory financing for used-car dealers, is trying to use predictive analytics to screen potential customers. Thousands of used-car dealers, who were formerly franchisees for General Motors and Chrysler, are seeking financing from companies such as Dealer Services so that they can go into business on their own. Using WebFOCUS software from Information Builders, the company is building a model that will predict the best loan prospects and eliminate up to 10 of the 15 hours required to review a financing application. The model reviews data including dealer size and type, number of locations, payment patterns, histories of bounced checks, and inven- tory practices and is revalidated and updated as conditions change.
FedEx is using SAS Institute’s Enterprise Miner and predictive analytic tools to develop models that predict how customers will respond to price changes and new services, which customers are most at risk of switching to competitors, and how much revenue will be generated by new storefront or drop-box loca- tions. The accuracy rate of the predictive analysis system ranges from 65 to 90 percent. FedEx is now starting to use predictive analytics in call centers to help
TABLE 12-5 EXAMPLES OF BUSINESS INTELLIGENCE PRE-DEFINED PRODUCTION REPORTS
BUSINESS FUNCTIONAL AREA PRODUCTION REPORTS
Sales Forecast sales; sales team performance; cross selling; sales cycle times Service/Call Center Customer satisfaction; service cost; resolution rates; churn rates Marketing Campaign effectiveness; loyalty and attrition; market basket analysis Procurement and Support Direct and indirect spending; off-contract purchases; supplier
performance
Supply Chain Backlog; fulfillment status; order cycle time; bill of materials analysis Financials General ledger; accounts receivable and payable; cash flow;
profitability
Human Resources Employee productivity; compensation; workforce demographics;
retention
customer service representatives identify customers with the highest levels of dissatisfaction and take the necessary steps to make them happy.
D a t a V i s u a l i z a t i o n a n d G e o g r a p h i c I n f o r m a t i o n S y s t e m s
By presenting data in visual form, data visualization tools help users see patterns and relationships in large amounts of data that would be difficult to discern if the data were presented as traditional lists of text. For example, managers and employees of Day & Zimmermann, an industrial, defense, and workforce solutions provider, have detailed, real-time visibility into the company’s inventory of contractors and workers through a set of dashboards populated with real-time data from a SAP ERP Human Capital Management system. The dashboards make it much easier to understand the organization’s staffing levels than static paper reports. The real-time data indicate exactly what type of worker is available in what location and when a project is due to be completed. If a project is ahead of schedule, information from the dash- boards helps decision makers rapidly determine when and where to reassign its workers.
Geographic information systems (GIS) help decision makers visualize problems requiring knowledge about the geographic distribution of people or other resources. Their software ties location data to points, lines, and areas on a map. Some GIS have modeling capabilities for changing the data and automati- cally revising business scenarios. GIS might be used to help state and local governments calculate response times to natural disasters and other emergen- cies or to help banks identify the best location for installing new branches or ATM terminals.
For example, Columbia, South Carolina-based First Citizens Bank uses GIS software from MapInfo to determine which markets to focus on for retaining customers and which to focus on for acquiring new customers. MapInfo also lets the bank drill down into details at the individual branch level and individualize
Somerset County, New Jersey, developed a GIS based on ESRI software to provide Web access to geospatial data about flood conditions. The system pro- vides information that helps emergency responders and county residents prepare for floods and enables emer- gency managers to make decisions more quickly.
goals for each branch. Each branch is able to see whether the greatest revenue opportunities are from mining their database of existing customers or from find- ing new customers. With clearer branch segmentation and more focused service goals, the bank has moved from making cold sales calls to calls that are more service- and courtesy-oriented.
B u s i n e s s I n t e l l i g e n c e i n t h e P u b l i c S e c t o r
Business intelligence systems are also used in the public sector. The Interactive Session on Organizations describes a school district’s move to quantify and ana- lyze student performance data to make better decisions about how to allocate resources to enhance student and teacher performance.
MANAGEMENT STRATEGIES FOR DEVELOPING BI AND BA CAPABILITIES
There are two different strategies for adopting BI and BA capabilities for the organization: one-stop integrated solutions versus multiple best-of-breed vendor solutions. The hardware firms (IBM, HP, and now Oracle, which owns Sun Microsystems) want to sell your firm integrated hardware/software solutions that tend to run only on their hardware (the totally integrated solution). It’s called “one stop shopping.” The software firms (SAP, SAS, and Microsoft) encourage firms to adopt the “best of breed” software and that runs on any machine they want. In this strategy, you adopt the best database and data warehouse solution, and select the best business intelligence and analytics package from whatever vendor you believe is best.
The first solution carries the risk that a single vendor provides your firm’s total hardware and software solution, making your firm dependent on its pric- ing power. It also offers the advantage of dealing with a single vendor who can deliver on a global scale. The second solution offers greater flexibility and inde- pendence, but with the risk of potential difficulties integrating the software to the hardware platform, as well as to other software. Vendors always claim their software is “compatible” with other software, but the reality is that it can be very difficult to integrate software from different vendors. Microsoft in particular emphasizes building on its desktop interface and operating system (Windows), which are familiar to many users, and developing server applications that run on Microsoft local area networks. But data from hardware and software pro- duced by different vendors will have to flow seamlessly into Microsoft worksta- tions to make this strategy work. This may not be adequate for Fortune 500 firms needing a global networking solution.
Regardless of which strategy your firm adopts, all BI and BA systems lock the firm into a set of vendors and switching is very costly. Once you train thou- sands of employees across the world on using a particular set of tools, it is extremely difficult to switch. When you adopt these systems, you are in essence taking in a new partner.
The marketplace is very competitive and given to hyperbole. One BI ven- dor claims “[Our tools] bring together a portfolio of services, software, hard- ware and partner technologies to create business intelligence solutions. By connecting intelligence across your company, you gain a competitive advan- tage for creating new business opportunities.” As a manager, you will have to critically evaluate such claims, understand exactly how these systems could improve your business, and determine whether the expenditures are worth the benefits.
I N T E R A C T I V E S E S S I O N : O R G A N I Z A T I O N S
As more and more reports suggest that American schoolchildren are falling behind those from other countries, improving our schools has become an increasingly urgent mission for the nation. Actually achieving that improvement is a difficult task. One approach gaining sway is more intensive use of information systems to measure educational performance at the individual and school district level and identify problem areas requiring additional resources and intervention.
The 139,000-student Montgomery County public school system in Rockville, Maryland, is at the forefront of the push for data-driven DSS in schools.
Forty employees at the school district’s Office of Shared Accountability generate reports on how many students take algebra in middle school or read below grade level. The district’s Edline and M-Stat systems alert principals to individuals with patterns of failing so they can receive extra resources, such as
after-school tutoring, study sessions, and special meetings with parents.
Earlier this decade, Montgomery County school superintendent Jerry Weast predicted that the increasing stratification between students in what he called the “green zone” (white and wealthy students) and students in the “red zone” (poor and minority students) would weigh down the school district as a whole. Having exhausted other options, administra- tors initiated a plan to create a data collection system for test scores, grades, and other data useful for identifying students with problems and speeding up interventions to improve their learning and
educational performance.
Principals access and analyze student perfor- mance data to help make instructional decisions over the course of the year, as opposed to only when annual standardized test data arrives. This way, teachers can meet the needs of students who require additional instruction or other types of intervention before they fall behind. Test scores, grades, and other data are entered into the system in real time, and can be accessed in real time. In the past, school data were disorganized, and trends in individual student performance as well as overall student body performance were difficult to diagnose.
Kindergarten teachers are now able to monitor their students’ success in reading words, noting which words each student struggles with on a
DATA-DRIVEN SCHOOLS
handheld device like a Palm Pilot. The device calculates the accuracy with which the student reads each passage and, over time, provides information about what sorts of problems the student consis- tently encounters. Also, when students begin to deviate from their normal academic patterns, like getting a rash of poor grades, the system sends alerts to parents and school administrators. In many cases, this quicker response is enough to help the student reverse course before failing.
Many parents in Montgomery County have expressed concern that the new systems are an excessive and unnecessary expenditure. In the short term, President Obama’s stimulus plan provides increased funding to schools over the next two years.
Projects like these are likely to become more popular as it becomes clearer that a data-driven approach yields quantifiable results. But will they become the standard in American schools? The long-term sustainability of these systems is still unclear.
In Montgomery County, one of the primary goals of the implementation of data-driven systems was to close the achievement gap between white and minority students in the lower grades. Teachers and administrators would use different types of
information organized by the DSS to identify gifted students earlier and challenge them with a more appropriate course load of more advanced placement (AP) classes. Data collected on each child would offer teachers insight into what methods worked best for each individual.
The results are very impressive. In Montgomery, 90 percent of kindergartners were able to read at the level required by standardized testing, with minimal differ- ences among racial and socioeconomic groups. These numbers are up from 52 percent of African-Americans, 42 percent of Latinos, and 44 percent of low-income students just seven years ago. Also, the system has effectively identified students with abilities at an earlier age. The number of African-American students who passed at least one AP test at Montgomery has risen from 199 earlier this decade to 1,152 this year;
the number of Latino students went from 218 to 1,336.
Some critics claim that the emphasis on closing the achievement gap between different student
populations is shortchanging gifted students and those with disabilities. “Green zone” parents question whether their children are receiving enough attention
C A S E S T U D Y Q U E S T I O N S
1. Identify and describe the problem discussed in the case.
2.How do business intelligence systems provide a solution to this problem? What are the inputs and outputs of these systems?
3.What management, organization, and technology issues must be addressed by this solution?
4.How successful is this solution? Explain your answer.
5.Should all school districts use such a data-driven approach to education? Why or why not?
and resources with so much emphasis being placed on the improving the red zone. Green zone districts in Montgomery County receive $13,000 per student, compared with $15,000 in the red zone. Red zone classes have only 15 students in kindergarten and 17 in the first and second grates, compared with 25 and 26 in the green zone. School administrators counter that the system not only provides appropriate help for underperforming students, but also that it provides the additional challenges that are vital to a gifted child’s development.
Other evidence suggests that the gains in reducing the achievement gap earlier in childhood erode as children get older. Among eighth graders in Montgomery County, approximately 90 percent of white and Asian eighth graders tested proficient or advanced in math on state tests, compared with only half of African-Americans and Hispanics. African- American and Hispanic SAT scores were over 300 points below those of whites and Asians. Still, the data-driven implementation has been responsible for some large improvements over past statistics. Some of the red zone schools have seen the most dramatic improvement in test scores and graduation rates.
In many ways, the data-driven systems build from the wealth of standardized testing information created by the No Child Left Behind Act passed during the Bush presidency. Some parents and educators complain about the amount and frequency of standardized testing, suggesting that children should be spending more time on projects and creative tasks. But viable alternative strategies to foster improvement in struggling school districts are difficult to develop.
It’s not just students that are subject to this data-driven approach. Montgomery County teachers have been enrolled in a similar program that identi-
Explore the Web site of the Montgomery County, Maryland School District and then answer the follow- ing questions:
1. Select one of the district’s elementary, middle, or high schools and describe the data available on that particular school. What kinds of decisions do these data support? How do these data help school officials improve educational performance?
2.Select one of the district’s schools and then the School Survey Results. How do these surveys help decision makers improve educational quality?
fies struggling teachers and supplies data to help them improve. In many cases, contracts and tenure make it difficult to dismiss less-effective teachers.
To try and solve this problem, teachers unions and administrators have teamed up to develop a peer review program that pairs underperforming teach- ers with a mentor who provides guidance and sup- port.
After two years, teachers who fail to achieve results appear before a larger panel of teachers and principals that makes a decision regarding their potential termination or extension of another year of peer review. But teachers are rarely terminated in the program—instead, they’re given tangible
evidence of things they’re doing well and things they can improve based on data that’s been collected on their day-to-day performance, student achievement rates, and many other metrics.
Not all teachers have embraced the data-driven approach. The Montgomery Education Association, the county’s main teachers’ union, estimates that keeping a “running record” of student results on reading assessments and other testing adds about three to four hours to teachers’ weekly workloads.
According to Raymond Myrtle, principal of Highland Elementary in Silver Spring, “this is a lot of hard work. A lot of teachers don’t want to do it. For those who don’t like it we suggested they do something else.” To date, 11 of 33 teachers at Highland have left the district or are teaching at other Montgomery schools.
Sources: www.montgomeryschoolsmd.org, accessed October 15, 2010; www.datadrivenclassroom.com, accessed October 15, 2010;
John Hechinger, “Data-Driven Schools See Rising Scores,” The Wall Street Journal, June 12, 2009; and Daniel de Vise, “Throwing a Lifeline to Struggling Teachers,” Washington Post, June 29, 2009.
M I S I N A C T I O N
12.3 B USINESS I NTELLIGENCE C ONSTITUENCIES
There are many different constituencies that make up a modern business firm.
Earlier in this text and in this chapter we identified three levels of manage- ment: lower supervisory (operational) management, middle management, and senior management (vice president and above, including executive or “C level”
management, e.g. chief executive officer, chief financial officers, and chief operational officer.) Each of these management groups has different responsi- bilities and different needs for information and business intelligence, with deci- sions becoming less structured among higher levels of management (review Figure 12-1).
DECISION SUPPORT FOR OPERATIONAL AND MIDDLE MANAGEMENT
Operational and middle management are generally charged with monitoring the performance of key aspects of the business, ranging from the down-time of machines on a factory floor, to the daily or even hourly sales at franchise food stores, to the daily traffic at a company’s Web site. Most of the decisions they make are fairly structured. Management information systems (MIS) are typi- cally used by middle managers to support this type of decision making, and their primary output is a set of routine production reports based on data extracted and summarized from the firm’s underlying transaction processing systems (TPS). Increasingly, middle managers receive these reports online on the company portal, and are able to interactively query the data to find out why events are happening. To save even more analysis time, managers turn to excep- tion reports, which highlight only exceptional conditions, such as when the sales quotas for a specific territory fall below an anticipated level or employees have exceeded their spending limits in a dental care plan. Table 12-6 provides some examples of MIS applications.
S u p p o r t f o r S e m i s t r u c t u r e d D e c i s i o n s
Some managers are “super users” and keen business analysts who want to create their own reports, and use more sophisticated analytics and models to find patterns in data, to model alternative business scenarios, or to test specific
TABLE 12-6 EXAMPLES OF MIS APPLICATIONS
COMPANY MIS APPLICATION
California Pizza Kitchen Inventory Express application “remembers” each restaurant’s ordering patterns and compares the amount of ingredients used per menu item to predefined portion measurements established by management. The system identifies restaurants with out-of-line portions and notifies their managers so that corrective actions will be taken.
PharMark Extranet MIS identifies patients with drug-use patterns that place them at risk for adverse outcomes.
Black & Veatch Intranet MIS tracks construction costs for various projects across the United States.
Taco Bell Total Automation of Company Operations (TACO) system provides information on food, labor, and period-to-date costs for each restaurant.
hypotheses. Decision support systems (DSS) are the BI delivery platform for this category of users, with the ability to support semi-structured decision mak- ing.
DSS rely more heavily on modeling than MIS, using mathematical or ana- lytical models to perform what-if or other kinds of analysis. “What-if” analy- sis, working forward from known or assumed conditions, allows the user to vary certain values to test results to predict outcomes if changes occur in those values. What happens if we raise product prices by 5 percent or increase the advertising budget by $1 million? Sensitivity analysis models ask what-if questions repeatedly to predict a range of outcomes when one or more variables are changed multiple times (see Figure 12-5). Backward sen- sitivity analysis helps decision makers with goal seeking: If I want to sell 1 million product units next year, how much must I reduce the price of the product?
Chapter 6 described multidimensional data analysis and OLAP as one of the key business intelligence technologies. Spreadsheets have a similar feature for multidimensional analysis called a pivot table, which manager “super users”
and analysts employ to identify and understand patterns in business informa- tion that may be useful for semistructured decision making.
Figure 12-6 illustrates a Microsoft Excel pivot table that examines a large list of order transactions for a company selling online management training videos and books. It shows the relationship between two dimensions: the sales region and the source of contact (Web banner ad or e-mail) for each customer order. It answers the question: does the source of the customer make a difference in addition to region? The pivot table in this figure shows that most customers come from the West and that banner advertising produces most of the customers in all the regions.
One of the Hands-on MIS projects for this chapter asks you to use a pivot table to find answers to a number of other questions using the same list of trans- actions for the online training company as we used in this discussion. The complete Excel file for these transactions is available in MyMISLab. We have also added a Learning Track on creating pivot tables using Excel 2010.
In the past, much of this modeling was done with spreadsheets and small stand-alone databases. Today these capabilities are incorporated into large
FIGURE 12-5 SENSITIVITY ANALYSIS
This table displays the results of a sensitivity analysis of the effect of changing the sales price of a necktie and the cost per unit on the product’s break-even point. It answers the question, “What happens to the break-even point if the sales price and the cost to make each unit increase or decrease?”
enterprise BI systems where they are able to analyze data from large corporate databases. BI analytics include tools for intensive modeling, some of which we described earlier. Such capabilities help Progressive Insurance identify the best customers for its products. Using widely available insurance industry data, Progressive defines small groups of customers, or “cells,” such as motorcycle riders aged 30 or above with college educations, credit scores over a certain level, and no accidents. For each “cell,” Progressive performs a regression analysis to identify factors most closely correlated with the insurance losses that are typical for this group. It then sets prices for each cell, and uses simula- tion software to test whether this pricing arrangement will enable the company to make a profit. These analytic techniques, make it possible for Progressive to profitably insure customers in traditionally high-risk categories that other insurers would have rejected.
DECISION SUPPORT FOR SENIOR MANAGEMENT:
BALANCED SCORECARD AND ENTERPRISE PERFORMANCE MANAGEMENT METHODS
The purpose of executive support systems (ESS), introduced in Chapter 2, is to help C-level executive managers focus on the really important performance information that affect the overall profitability and success of the firm. There are two parts to developing ESS. First, you will need a methodology for understand- ing exactly what is “the really important performance information” for a specific FIGURE 12-6 A PIVOT TABLE THAT EXAMINES CUSTOMER REGIONAL
DISTRIBUTION AND ADVERTISING SOURCE
In this pivot table, we are able to examine where an online training company’s customers come from in terms of region and advertising source.
firm that executives need, and second, you will need to develop systems capable of delivering this information to the right people in a timely fashion.
Currently, the leading methodology for understanding the really important information needed by a firm’s executives is called the balanced scorecard method (Kaplan and Norton, 2004; Kaplan and Norton, 1992). The balanced score card is a framework for operationalizing a firm’s strategic plan by focusing on measurable outcomes on four dimensions of firm performance: financial, business process, customer, and learning and growth (Figure 12-7).
Performance on each dimension is measured using key performance indica- tors (KPIs), which are the measures proposed by senior management for understanding how well the firm is performing along any given dimension. For instance, one key indicator of how well an online retail firm is meeting its cus- tomer performance objectives is the average length of time required to deliver a package to a consumer. If your firm is a bank, one KPI of business process performance is the length of time required to perform a basic function like creating a new customer account.
The balanced scorecard framework is thought to be “balanced” because it causes managers to focus on more than just financial performance. In this view, financial performance is past history—the result of past actions—and managers should focus on the things they are able to influence today, such as business process efficiency, customer satisfaction, and employee training. Once a score- card is developed by consultants and senior executives, the next step is automating a flow of information to executives and other managers for each of the key performance indicators. There are literally hundreds of consulting and
FIGURE 12-7 THE BALANCED SCORECARD FRAMEWORK
In the balanced scorecard framework, the firm’s strategic objectives are operationalized along four dimensions: financial, business process, customer, and learning and growth. Each dimension is mea- sured using several KPIs.
software firms that offer these capabilities, which are described below. Once these systems are implemented, they are often referred to as ESS.
Another closely related popular management methodology is business performance management (BPM). Originally defined by an industry group in 2004 (led by the same companies that sell enterprise and database systems like Oracle, SAP, and IBM), BPM attempts to systematically translate a firm’s strate- gies (e.g., differentiation, low-cost producer, market share growth, and scope of operation) into operational targets. Once the strategies and targets are identified, a set of KPIs are developed that measure progress towards the targets. The firm’s performance is then measured with information drawn from the firm’s enter- prise database systems. BPM uses the same ideas as balanced scorecard but with a stronger strategy flavor (BPM Working Group, 2004).
Corporate data for contemporary ESS are supplied by the firm’s existing enterprise applications (enterprise resource planning, supply chain manage- ment, and customer relationship management). ESS also provide access to news services, financial market databases, economic information, and whatever other external data senior executives require. ESS also have signifi- cant drill-downcapabilities if managers need more detailed views of data.
Well-designed ESS enhance management effectiveness by helping senior executives monitor organizational performance, track activities of competitors, recognize changing market conditions, and identify problems and opportuni- ties. Immediate access to data increases executives’ ability to monitor activities of lower units reporting to them. That very monitoring ability enables decision making to be decentralized and to take place at lower operating levels, increas- ing management’s span of control.
Contemporary business intelligence and analytics technology has enabled a whole new style and culture of management called “information driven management” or “management by facts.” Here, information is captured at the factory floor (or sales floor) level, and immediately entered into enter- prise systems and databases, and then to corporate headquarters executive dashboards for analysis—not in a matter of months, days, weeks, but in hours and seconds. It’s real time management. You can see real-time management at work in hundreds of corporations in 2010, and many more are building this new decision support environment. Valero provides a good example in the Interactive Session on Management.
GROUP DECISION-SUPPORT SYSTEMS (GDSS)
The DSS we have just described focus primarily on individual decision making.
However, so much work is accomplished in groups within firms that a special category of systems called group decision-support systems (GDSS)has been developed to support group and organizational decision making.
A GDSS is an interactive computer-based system for facilitating the solution of unstructured problems by a set of decision makers working together as a group in the same location or in different locations. Collaboration systems and Web-based tools for videoconferencing and electronic meetings described earlier in this text support some group decision processes, but their focus is primarily on communication. GDSS, however, provide tools and technologies geared explicitly toward group decision making.
GDSS-guided meetings take place in conference rooms with special hardware and software tools to facilitate group decision making. The hardware includes computer and networking equipment, overhead projectors, and display screens. Special electronic meeting software collects, documents, ranks, edits,
I N T E R A C T I V E S E S S I O N : M A N A G E M E N T
If you haven’t heard of Valero, don’t worry. It’s largely unknown to the public although investors rec- ognize it as one of the largest oil refiners in the United States. Valero Energy is a top-fifty Fortune 500 company headquartered in San Antonio, Texas, with annual revenues of $70 billion. Valero owns 16 refineries in the United States, Canada, and Aruba that produce gasoline, distillates, jet fuel, asphalt, petrochemicals, and other refined products. The com- pany also owns 10 ethanol plants located in the Midwest with a combined ethanol production capac- ity of about 1.1 billion gallons per year.
In 2008, Valero’s chief operating officer (COO) called for the development of a Refining Dashboard that would display real-time data related to plant and equipment reliability, inventory management, safety, and energy consumption. Using a series of monitors on the walls of the headquarters operations center room, with a huge central monitor screen showing a live display of the company’s Refining Dashboard, the COO and other plant managers can review the performance of the firm’s 16 major refineries in the United States and Canada.
The COO and his team review the performance of each refinery in terms of how each plant is perform- ing compared to the production plan of the firm. For any deviation from plan, up or down, the plant man- ager is expected to provide the group an explanation, and a description of corrective actions. The head- quarters group can drill down from executive level to refinery level and individual system-operator level displays of performance.
Valero’s Refining Dashboard is available on the Web to plant managers in remote locations. The data are refreshed every five minutes. The dashboard taps directly into the firm’s SAP Manufacturing
Integration and Intelligence application where each plant’s history of production and current production data is stored. Valero’s management estimates that the dashboards are saving $230 million per year at the 16 refineries where they are in use.
Valero’s Refining Dashboard has been so success- ful that the firm is developing separate dashboards that show detailed statistics on power consumption for each unit of the firm, and each plant. Using the shared data, managers will be able to share best prac- tices with one another, and make changes in
equipment to reduce energy consumption while
PILOTING VALERO WITH REAL-TIME MANAGEMENT
maintaining production targets. The dashboard system has the unintended consequence of helping managers learn more about how their company actually operates, and how to improve it.
But how much do Valero’s executive dashboards really make a difference? One of the dangers of real time management is not measuring the right things.
Dashboards that display information unrelated to the firm’s strategic goals might be largely irrelevant, although pretty to look at. Valero’s goals and
measures of performance were inspired by Solomon benchmark performance studies used in the oil and gas industry. How helpful were they?
Valero’s stock price fell from a high of $80 in June 2008, to about $20 in November 2010. As it turns out, Valero’s profits are not strongly related to small changes in its refining efficiency. Instead, its prof- itability is largely determined by the spread between the price of refined products and the price of crude oil, referred to as the “refined product margin.” The global economic slowdown beginning in 2008 and extending through 2010 weakened demand for refined petroleum products, which put pressure on refined product margins throughout 2009 and 2010.
This reduced demand, combined with increased inventory levels, caused a significant decline in diesel and jet fuel profit margins.
The price of crude and aggregate petroleum demand are largely beyond the control of Valero management. The cost of refining crude varies within a very narrow range over time, and there are no technological breakthroughs expected in refining technology. Although Valero’s dashboard focuses on one of the things management can c