This is particularly important in the euro area, where public subsidies to support the creation of new companies are among the most widely used instruments of industrial policy. Entrepreneurship and Dynamics in the Knowledge Economy Edited by Charlie Karlsson, Börje Johansson and Roger R.
Preface
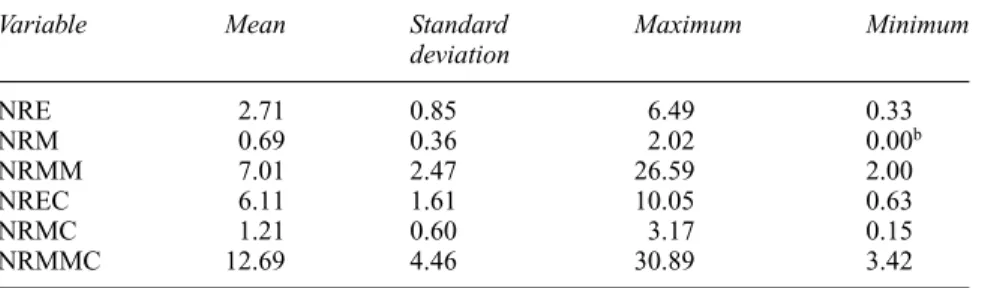
Aggregate outcomes of industrial dynamics
More generally, various studies argue that new business formation can be beneficial for economic growth (at least in developed countries, see Van Stel, Carree and Thurik, 2005), employment generation and unemployment reduction (see Hart and Oulton, 2001; Thurik , 2003 ). Macroeconomic empirical evidence, however, also casts great doubt on the progressive possibilities for new business formation and business establishment.
1 Introduction
- From macroeconomic outcomes to microfoundations of new firm formation
- Heterogeneous entrants are leading to very divergent post-entry performance
- Conclusions and policy implications
- Introduction
Indeed, Schumpeter (1934), Knight (1921) and Oxenfeldt (1943) drew attention to the subjective traits of the actual founder of a new firm. Finally, the presence of significantly different geographic environments increases the variability in the determinants and post-entry impact of new firm formation.
2 The birth of new enterprises
- Previous studies: models and econometric tests
- Data and sample characteristics
- Pull and push factors: determinants and motivations
- Principal findings and conclusions
- Introduction
- New-firm startups in a model of income choice
More often, the entry of new firms is simply assumed to be a direct consequence of the presence of surplus. Although related to the previous argument, this view emphasizes the importance of the environmental factors that can facilitate the emergence of new firms.

3 Determinants of new-firm startups in Italy
- Measurement issues
- A testable specification
- Results
- Conclusions
- Introduction
The layoff rate is expected to have a positive effect on new businesses. The significance of the regressor S Determinants of Startups in Italy was found to be 37.
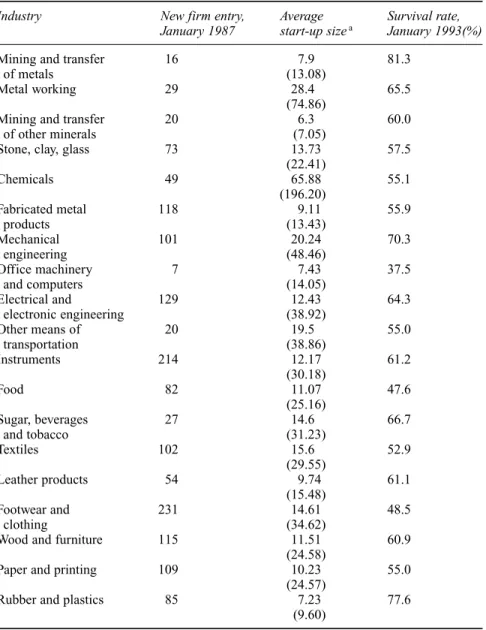
4 Start-up size and industrial dynamics
- The post-entry performance of new firms
- The survival of new firms in Italian manufacturing
- An empirical test of Gibrat’s Law
- Concluding remarks
- Introduction
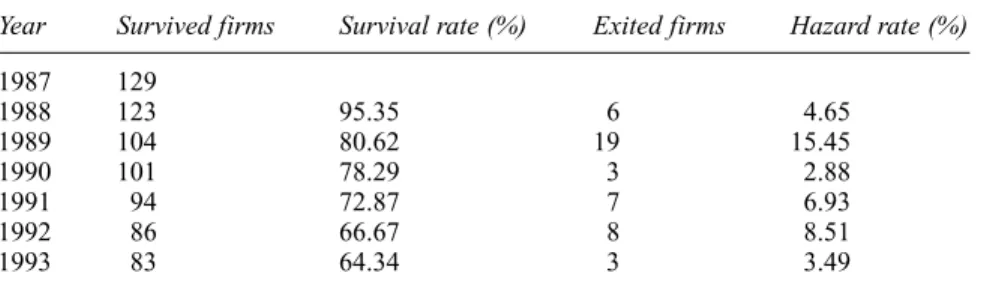
- Data
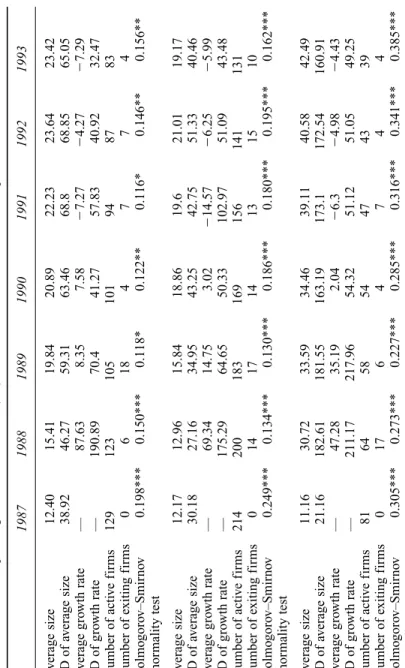
The industry's innovative environment is also hypothesized to influence firms' post-entry performance. This cleansing process led to a reduction in the total number of firms included in the database from 1889 to 1570. The paper's four key findings are: (1) survival patterns differ significantly across specific industries; (2) the hazard function has a bell shape with a peak in the second year of activity; (3) within each sector, the size of start-ups is not statistically related to the probability of new business duration, and (4) Gibrat's law does not apply to start-ups in most sectors.
According to Gibrat's Law of Proportional Effect, "the probability of a given proportional change in size over a given period is the same for all firms in a given industry - regardless of their size at the beginning of the period".
5 The relationship between size and growth
Empirical model and results
Following Chesher (1979, p. 404), if both sides of equation (5.1) are exponentiated, it becomes clear that if 1 is equal to unity, the growth rate and initial size are independently distributed and Gibrat's law holds. As in most previous empirical studies, tests for heteroskedasticity were conducted using the OLS estimates of Equation 5.1 and White's (1980) correction introduced as appropriate in both the OLS estimates and the sample selection model (SSM). The first two columns report the estimation results for the entire six-year period, along with the usual statistical diagnostics (including the correlation between selection and the growth equation, ) and a special t-test of the validity of Gibrat's law. (1; question (1)); the last rows report White's test for heteroscedasticity (if a significant consistent covariance matrix was used) and sample sizes with and without outliers.
Looking at the results for micro-enterprises and larger enterprises over the entire period and year-on-year, it can be concluded that previous results have been confirmed within each of the two size classes.

Conclusions
These results across all firms capture both the dynamics within size classes and the differences between size classes. The relationship between firm growth, size and age: estimates for 100 manufacturing industries, Journal of Industrial Economics. The relationship between firm size and firm growth in the US manufacturing sector, Journal of Industrial Economics.
1985) Growth, Acquisition Activity and Firm Size: Evidence from the United Kingdom, Journal of Industrial Economics.
Introduction
6 Does Gibrat’s Law hold among young, small firms?
Previous empirical tests of Gibrat’s Law
Using data on about 7,000 manufacturing companies in Lower Saxony during the period, he found that the validity of Gibrat's law was rejected in most cases, but he did not provide systematic evidence that small companies grow faster than larger ones. The chosen logarithmic specification of Gibrat's law is taken from Chesher (1979) and thus controls for autocorrelation, but not for heteroscedasticity and sample selection. Gibrat's law among young, small firms 75 performance of infant firms in the instrument industry, Lotti, Santarelli, and Vivarelli (2001) conduct separate estimates for micro firms (with fewer than 5 employees) and larger firms, controlling for sampling spillovers (Heckman's two-step procedure), heteroscedasticity and autocorrelation.
Although Gibrat's law is generally not confirmed, once attention is turned to the post-entry evolution of firms, a non-monotonic convergence towards a Gibrat-like growth pattern is identified.

Data and methodology
Usually, this leads to a deviation of the distribution of the error terms from the canonical hypotheses of normality and homoscedasticity. In such a framework, the quantile regression (QR) represents a robust alternative to least squares estimation: it consists of a Least Absolute Deviation estimator (LAD) that fits the median to a linear function of the covariates. The starting point is the definition of sample quantiles, which are then extended to a linear model (Koenker and Bassett, 1978).
1 Is the general inverse relationship between size and growth – found by most of the studies discussed in the previous section, confirmed during the infancy of nascent firms (i.e. within the subpopulation of new entrants).
Results
These results suggest the presence of a discontinuity in the growth patterns of new firms along the early stages of their life cycle. The regularity over time in the patterns of post-entry growth of small and large food industry players indicates that, in this case, more than strategic interdependence within submarkets, independence across submarkets may be involved (see Sutton.
![Table 6.3Quantile regression ([0.50]) estimates: all industries with industry dummies, electrical and electronic engineering, instruments, food 1987–19931987–19881988–19891989–19901990–19911991–19921992–1993 All industries 10.637***0.810***1.000***1.000**](https://thumb-ap.123doks.com/thumbv2/123dok/11448335.0/94.648.76.583.47.874/3quantile-regression-industries-electrical-electronic-engineering-instruments-industries.webp)
Conclusions
Since the results are consistent with the reported QRs, they are not included in the paper, but are available from the authors upon request. The results confirm that in the first period 1 estimated differ significantly from the remaining time intervals. 1982) Industry Selection and Evolution. 1985) Growth, acquisition activity and firm size: evidence from the United States.
1992) Firm size, firm growth and persistent randomness: testing Gibrat's law with establishment data from Lower Saxony. 1980).
![Table 6A.1Quantile regression estimates ([0.10],[0.25],[0.50].[0.75],[0.90]): 1valuesa 1987–19931987–19881988–19891989–1990 [0.10][0.25][0.50][0.75][0.90][0.10][0.25][0.50][0.75][0.90][0.10][0.25][0.50][0.75][0.90][0.10][0.25][0.50][0.75][0.90] All industr](https://thumb-ap.123doks.com/thumbv2/123dok/11448335.0/97.648.131.535.57.922/table-1quantile-regression-estimates-1valuesa-1987-1990-industr.webp)
Introduction
7 Is subsidizing entry an optimal policy?
- Data and methodology
- Survival analysis
- Growth analysis
- Conclusions and policy implications
- Introduction
In the concluding part of this paper we will try to answer this question. Our answer will be based on a representative example of entry and post-entry evolution of start-up firms in the Italian electrical and electronic engineering sector. 5 Cf., for example, those presented in the 1995 special issue (no. 4) of the International Journal of Industrial Organization.
1987), 'The relationship between firm size and firm growth in the US manufacturing sector', Journal of Industrial Economics.
8 The link between the entry decision and post-entry
- The link between entry and post-entry performance
- Data and measurement issues
- Empirical evidence
- Conclusions
- Introduction
On the other hand, there is a growing literature focusing on the post-entry performance of firms. The clearest result in Table 8.3 relates to the positive role of the innovative motivation in promoting a better post-entry performance of newborn firms. The main conclusion is that the post-entry performance of newborn firms is not neutral with respect to the particular motivations that led to the decision to start a new firm.
Rafiquzzaman (1995), 'Selection Versus Evolutionary Adaptation Learning and Post-entry Performance', International Journal of Industrial Organization.
9 The role of innovation in the postentry performance of
- Start-up of small firms and their subsequent early performance: a review of the literature
- Data and measurement issues
- Empirical results
- Conclusions
- Introduction
- The literature
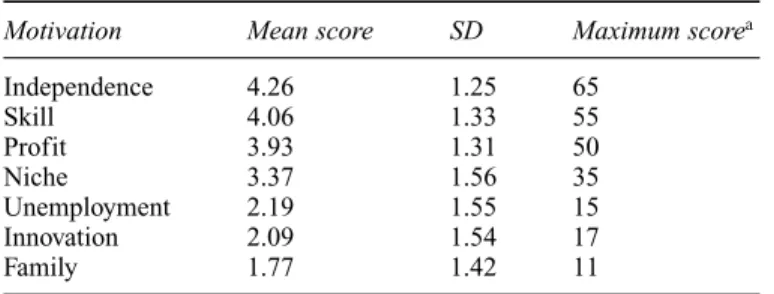
This article hypothesizes that the determinants of starting a new business do not have a neutral influence on post-start performance. In our analysis, post-entry performance is partially predetermined based on the founder's pre-entry characteristics. In fact, innovation motivation is in the middle of the list (marketing innovation 5; process innovation 4; product innovation 2).
Disagreement over the parent company's general management criteria is the fifth factor in the ranking (median 5), and undervaluation of skills is seventh (median 4).
10 Are all the potential entrepreneurs so good?
Data and methodology
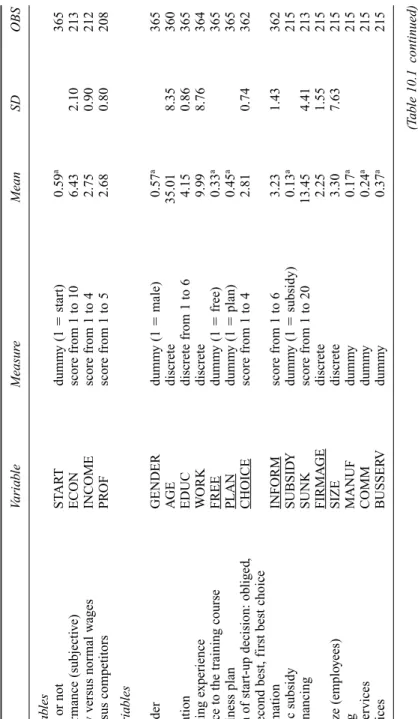
Although a large sample, the FORMAPER database cannot be considered representative of the entire population of potential entrepreneurs. As can be seen, the list of the independent variables includes most of the pull and push determinants discussed in the previous section. In addition to the variables derived from the theories discussed in the previous section, it has been decided to emphasize the role of the information set available to the potential founder (INFORM), since the sample population was characterized by a high degree of heterogeneity ( as in the real world, where founders range from the CEO to low-educated blue-collar workers and the unemployed).
In Table 10.1, the variables that were significant in at least one of the four estimates are underlined.
Results
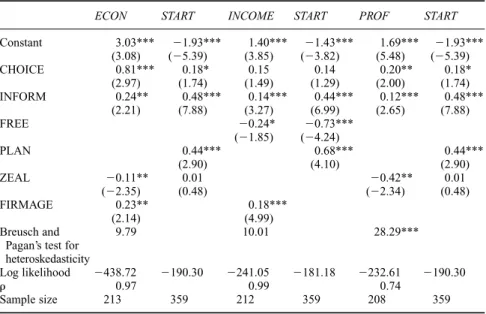
This specification introduces an additional explanatory variable (the inverse Mill's ratio) obtained by the corresponding pro-bit model (START as a selection equation) into the maximum likelihood estimation of the post-entry performance equation. For each of the three models, the first column reports the results for post-entry performance (main equation), and the second column reports the results for the entry decision (selection equation). The good econometric performance of the CHOICE indicator compensates for the non-significant effect of the individual motives in the table 10.1 ranking.
As expected, non-economic motivations – such as the desire to be socially useful – have a detrimental effect on post-entry performance; they probably interfere with the rational assessment of the real market opportunities and tend to exaggerate – in the potential founder's mind – the real potential of his/her business idea.
Conclusions and policy implications
Arrighetti, Alessandro en Marco Vivarelli, 1999, 'The Role of Innovation in the Postetry Performance of New Small Firms: Evidence from Italy', Southern Economic Journal. Hall, Bronwyn, 1987, 'The Relationship Between Firm Size and Firm Growth in the US Manufacturing Sector', Journal of Industrial Economics35, 583–606. Orr, Dale, 1974, 'The Determinants of Entry: A Study of the Canadian Manufacturing Industries', Review of Economics and Statistics56, 58–66.
Audretsch, 1998, “The Link Between Entry Decision and Post-Entry Performance: Evidence from Italy”, Industrial and Corporate Change 7, 485–500.
Index
Italy 44, 69; determinants of new ventures in 17, 30; electrical and electronic engineering 90–97; entry decision and post-entry performance, studied 105–111; fixed formation in 34; Gibrat's law among young, small firms, study at 75–83; industry, data and simple features 21–23; operational study, main findings and conclusions 26–27;.