So these numbers that we can infer from the community are right on the banks of the Cikapundung River. In addition, if we look at the public perception of the utility of the river (Q10), the Pod Cikapundungom Society will probably benefit, since it only accepts the results of a possible shipment of waste from the previous area (Q16). The figure is of course very helpful for the total cost that will be incurred in the management of the Cikapundung River Rp.
CONTENT OF HEAVY METALS IN THE WATER AND WATER HYACINTH (Eichhornia crassipes) IN WATER BODIES RECEIVING
River, Majalaya Districts, Bandung Regency)
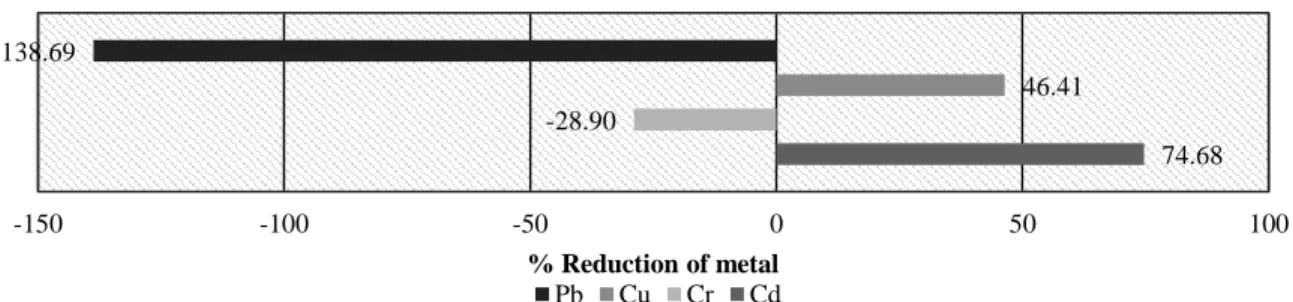
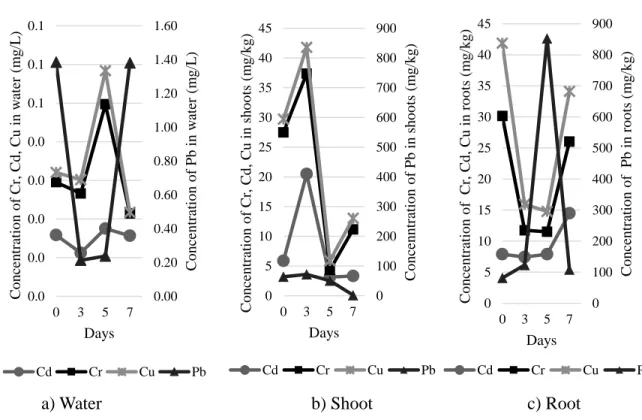
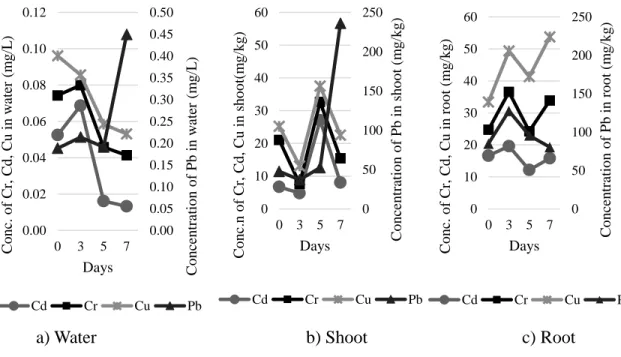
CONTENT OF HEAVY METALS IN WATER AND WATER HYACINTH (Eichhornia crassipes) IN WATER BODIES OF MARY. Concentration of heavy metals in roots (mg . kg) = ICPRresult (ppm) x 25 mL Dry sample weight (g). Concentration of heavy metals in shoots (mg . kg) = ICP Result (ppm) x 25 mL Dry sample weight (g).
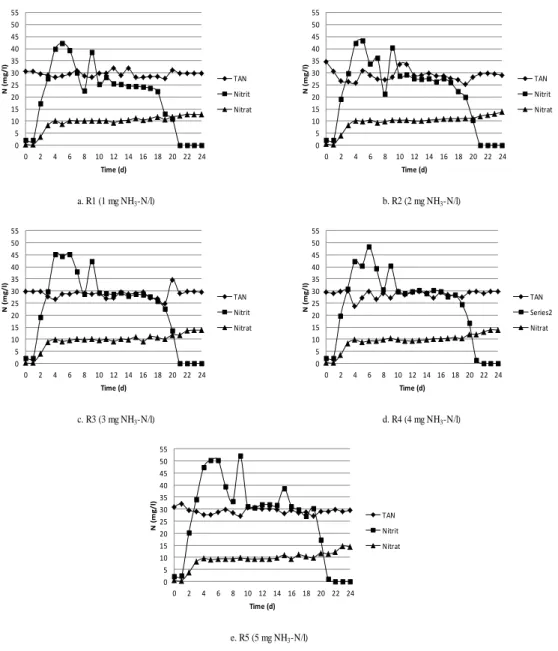
NITRIFICATION KINETICS IN AQUACULTURE WASTEWATER TREATMENT USING BATCH REACTOR
A decrease in the concentration of nitrogen in ammonia may be due to the oxidation of nitrogen in ammonia to nitrite. According to Fumasoli et al (2015), the oxidation of nitrogen in ammonia usually stops when the pH value falls below pH 6. This was due to a decrease in the pH value below pH 6 on the third day, so the oxidation of nitrogen in ammonia to nitrite can stop.
MODIFICATION OF TRIPIKON-S WITH BIOBALL ADDITION IN ARTIFICIAL BLACK WATER TREATMENT FOR SWAMP AND
COASTAL AREAS
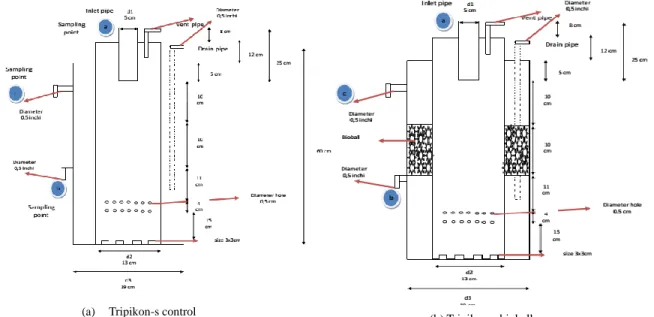
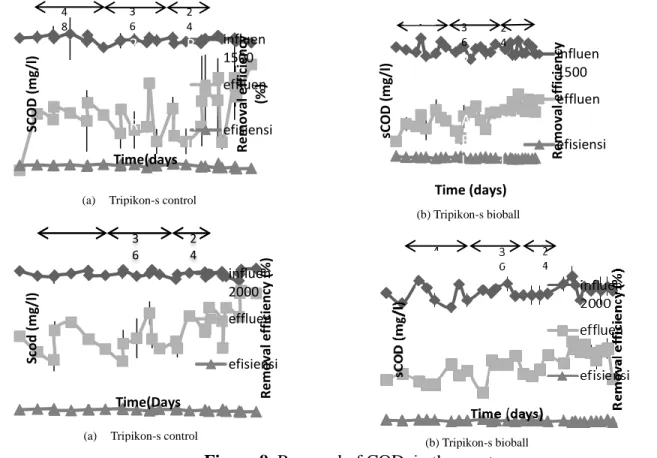
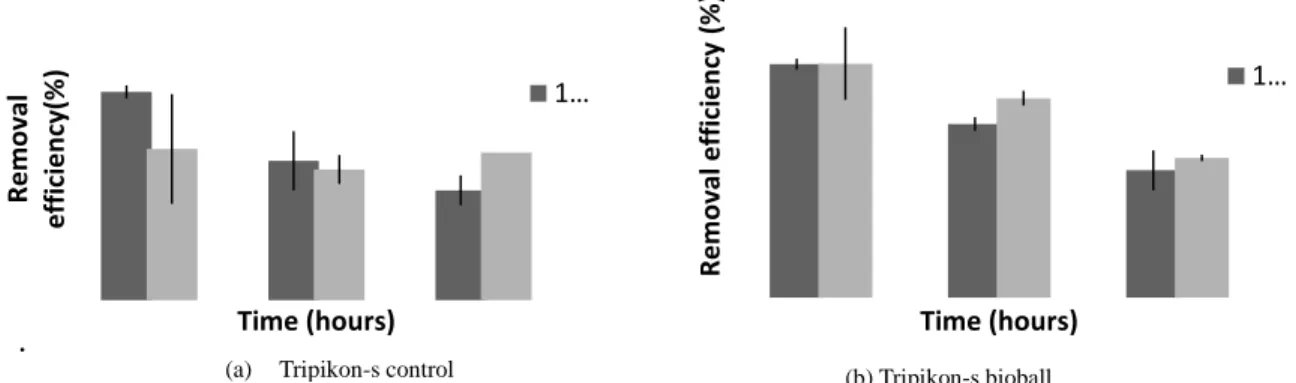
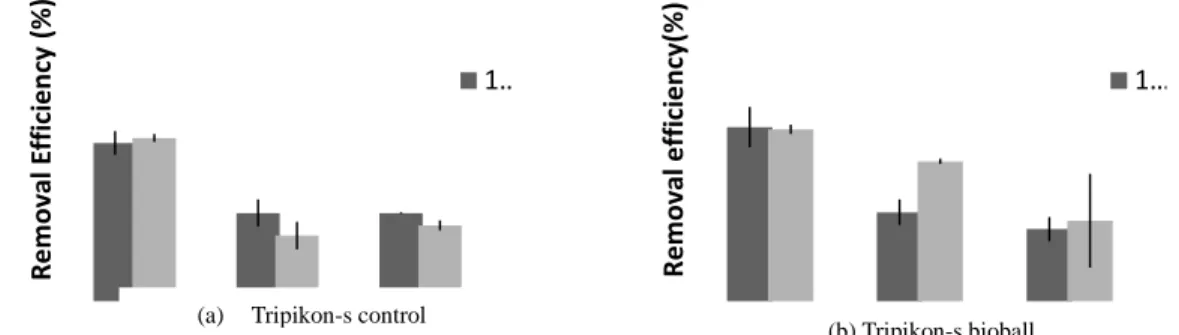
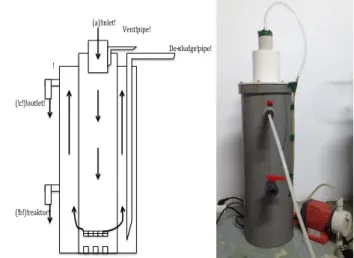
While the reactor with additional Tripikon bioball-S (Tripikon bioball-S) has a volume of 14.6 liters of media and volume fraction of the cavity of 3.6 liters. The increase in removal efficiency occurring in the Tripikon-S bioball reactor indicated that the microorganisms present in the reactor and the media were used to adapt the incoming bioball substrate. In the Tripikon-S control reactor, the total phosphate removal efficiency with organic loading variations of 1500 and 2000 mg/l was 8.3% and 17.93% for the 3rd replication.
For Tripikon-S bioball best removal efficiency given current residence time of 48 hours with a load variation up to 2000 mg/l with a percentage allowance of 75.93%. For Tripikon-S bioball best removal efficiency given current residence time of 48 hours with a load variation up to 2000 mg/l with a percentage surcharge of 26.53%. While the reactor Tripikon-S bioball with the same load obtained μmax and ks was 0.0048 and 19.667.
In the batch reactor system, Tripikon-S-S Control and Tripikon bioball are able to remove COD by 44% and 80% for load variation 1500 and 2000. Regarding the load variation of COD removal efficiency for the reactor, Tripikon-S-S Control and Tripikon bioball is 68% and 70%. In addition, the overall phosphate elimination efficiency in the Tripikon-S-S Control and Tripikon bioball reactor is 25.02% and 35.39%. Based on the results of this study, it was concluded that the Tripikon-S bioball reactor gives better results than the Tripikon-S Control on COD, NTK and total phosphate.
Therefore, Tripikon-S bioball should be considered as an alternative for wastewater treatment in coastal and marshy areas.
INFLUENCED FACTORS OF STRUCTURE FOR WASTEWATER TREATMENT SYSTEM IN CHALLENGING AREA,
CASE STUDY: PALEMBANG CITY, SOUTH SUMATERA PROVINCE, INDONESIA)
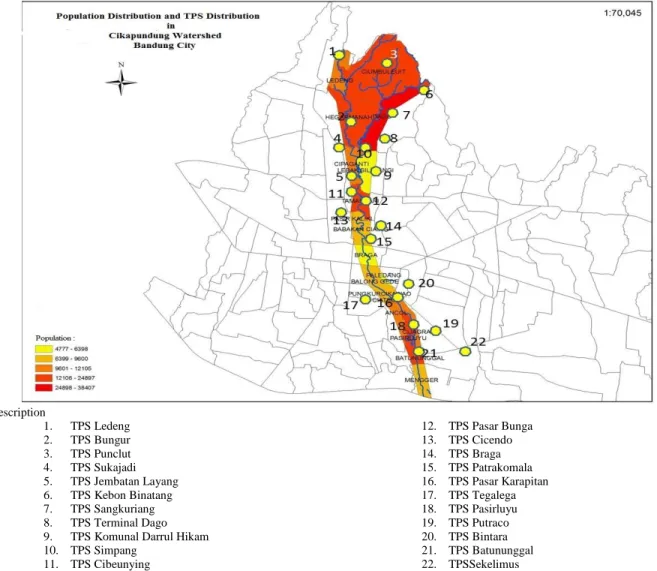
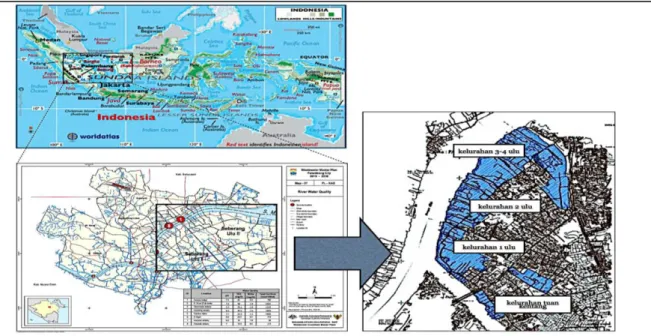
Location of the study area is shown in Figure 1 the location of the study area. The presence of the river Musi causes 25% of the population to live in the area of Palembang tidal marsh and across the river Musi (Djonoputro et al, 2010). Field observations carried out are to look at the condition of the existing infrastructure of existing effluents in the study area.
In the test area, what is done is to determine the location of the sampling using a purposive sampling method. To facilitate a team of land surveyors to explore the situation of the survey sites. In parallel with this, a review of soil samples in the laboratory to see the properties of the soil.
Followed by simulating the model wastewater facility with the character of the soil tested. Conditions of sanitation facilities, especially wastewater treatment facilities, should be studied to know the habits of the community in the study area as a material consideration in the selection of sanitation technologies. Most of the application of the wastewater treatment system by the government or private parties is a facility that is commonly used in the field of land types.
Stagnant periods and dry periods to explain the cause of the problem of fiberglass flotation of wastewater treatment systems.
THE REMOVAL OF ORGANIC SUBSTANCE USING THE MODIFIED TRIPIKON S FOR THE USAGE IN COASTAL AND THE SWAMP
AREAS
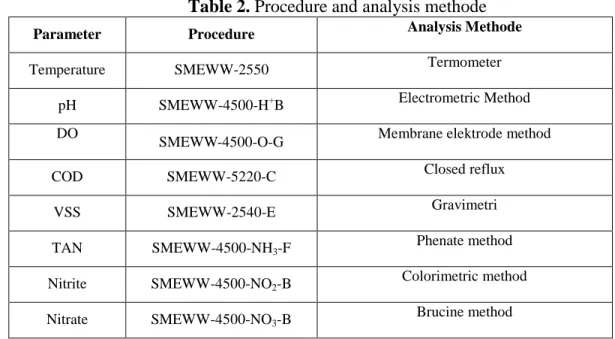
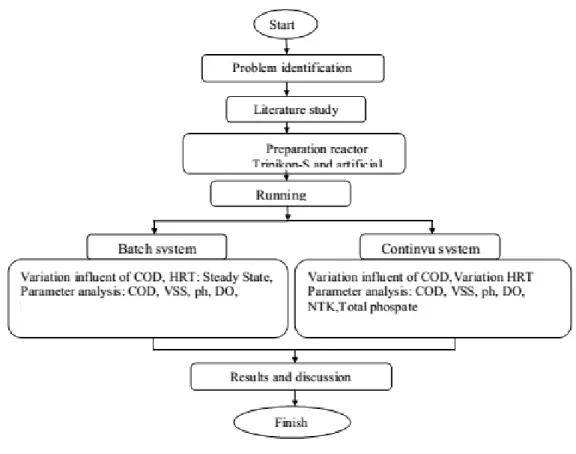
Research begins with batch system, where there is no flow in and out of the reactor in a batch system. Research carried out in the batch until it reaches a steady state is characterized by the absence of significant changes in the tested parameters. Two variations of influent concentration are 1500 and 2000 mg/L. Parameters measured in the continuous phase are pH, temperature, DO, COD, VSS, NTK and Total Phosphate. Based on this range, it can be seen that the temperature range in the reactor or in reactor and reactor control venturi is located in the mesophilic range.
The concentration of oxygen in the environment is a factor that limits the growth rate of microorganisms. With the same variation in the Venturi reactor, the highest COD removal efficiency of 67.39% is also achieved. The influencing concentration of NTK on the variations both in the control reactor and in the venturi reactor is in the range of 126-196 mg/l.
We can see that the highest NTK removal efficiency for reactor control 24.39% was achieved at the influent concentration variation 2000 mg/l COD and HRT 48 hours and with a similar variation in the venturi reactor obtained the highest removal efficiency of NTK 29, 66 %. While the highest removal efficiency of total phosphate (TP) in the control reactor at an influent concentration variation of 1500 mg/l COD and HRT 48 hours with 34.31% removal efficiency and the same variation in the venturi reactor obtained the highest removal efficiency of 35.16% . Based on the research results, obtained that the highest of removal efficiency of organic matter was achieved 63.04% and 67.39% for ventury reactor in the variation of the influent concentration 2000 mg/l COD and HRT 48 hours.
This was seen from the DO concentration in the control reactor, which has no significant difference between the control reactor and the venture reactor.
MATERIAL FLOW ANALYSIS OF VEGETABLES WASTE CAUSED BY HORTICULTURAL ACTIVITY
CASE STUDY: BANDUNG CITY)
This study aims to determine the contribution due to the process of selection (sorting) of plant waste to the amount of waste generated in the holding markets in Bandung. The aim of this study was to obtain details of vegetable production at the upstream level (farm) and the amount of waste generated by the separation process of different stages of the transaction chain and downstream (markets). The hypothesis in this study is that the waste generated by the vegetable sorting process in each transaction chain has a large contribution to the amount of waste generated in the markets in Bandung.
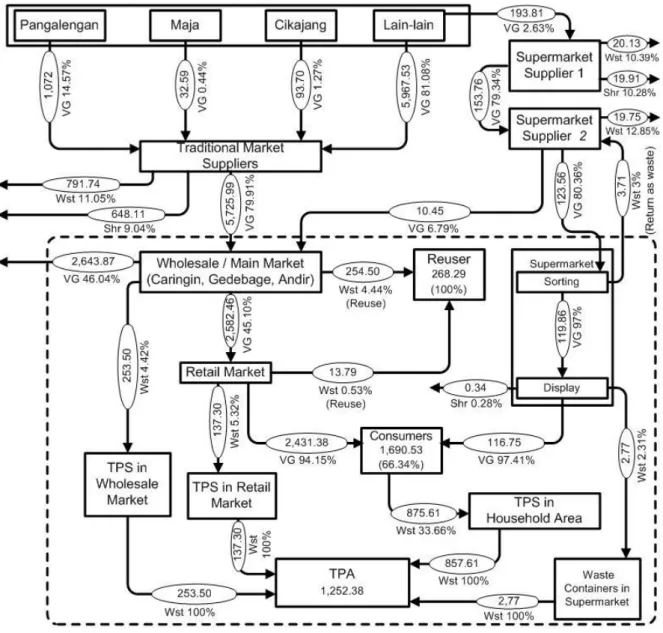
Therefore, to find out how the persentese and the amount of vegetables that go into markets in Bandung then conducted interviews of 100 people in Bandung. It can thus be seen that 76.54% of the waste generated in the three main markets originates from residual sorting of vegetables. Based on this amount, it can be seen that out of 215.97 tons of waste generated in the retail market in Bandung City, 63.57% of which is vegetable waste.
Meanwhile, the shelf life of vegetables in the supermarket/hypermarket can reach 4 days for certain types of vegetables. At the end of the chain of transactions, both traditional and modern markets, all kinds of vegetables will end up with the consumer. Details of the amount of waste generated by the chain vegetable trading system as a whole can be seen in Table 1.
At the bottom of the flow in Figure 1 shows that the total amount of vegetable waste in Bandung city is 1252.38 tons/week.
DEVELOPMENT OF COMPRESSION USING TITANIUM DIOXIDE TO REDUCE NOX GAS IN THE AIR. Excess electrons in the conduction band could presumably react with molecular oxygen to form superoxide ions. While the objectives of this research are to determine the effect of variations in ultraviolet (UV) exposure time on NOx removal.
To reduce the temperature rise, a fan should be equipped as a cooling device (Hunger et. al., 2008). A fan placed in the photoreactor then serves as a coolant and also as an agitator airflow so that the concentration of NOx in the photoreactor is evenly distributed. The resulting NOx concentration in the gas container is still very high, so it must be diluted with ambient air.
T is the concentration of ions in the TiO2-coated pavement after exposure (mg/L) B is the concentration of ions in the TiO2-coated pavement before exposure (mg/L) Vwater is the amount of water used in rinsing ( L) . The mass balance in the photocatalytic reactor can be judged by the mass elimination of NOx and the formation of new compounds in the form of nitrate and nitrite compounds. Formation of nitrite and nitrate by hydroxyl ions can be seen in equation (6) and (7).
The formation of new compounds in the form of N2O is not possible due to the limited available gas detectors.
ANALYTIC HIERARCHY PROCESS FOR THE EVALUATION OF TRANSPORT POLICIES IN BANDUNG CITY
Selection of the local government area to know the thoughts and views of stakeholders in Bandung City. The AHP divides the decision problem into elements, according to their common characteristics, and levels, which correspond to the common characteristics of the elements. Continue this process of weighing and adding until the final priorities for the lower-level alternatives are obtained.
Evidence favoring one activity over another is of the highest possible order of confirmation. Meanwhile, at level 2, a weighted value calculation based on the rankings obtained from each of the policy alternatives. When the weight value is based on the reverse ranking obtained from the shelf.
So that the BRT is expected to meet the desire of the residents of Bandung to improve the quality of transport services. Program policy is a top priority of respondents is the repair and manufacture of pedestrian facilities. On the criteria of the quality of transport services an important priority in the revitalization of public transport.
And the criteria of environmental sustainability to give priority to ecological driving by the majority of respondents as the best solution in the effort to preserve the environmental quality of the transport sector.