between its 53 members and 9 associate members. ESCAP provides the strategic link between global and country-level programmes and issues. It supports Governments of the region in consolidating regional positions and advocates regional approaches to meeting the region’s unique socio-economic challenges in a globalizing world. The ESCAP office is located in Bangkok, Thailand. Please visit our website at www.unescap.org for further information.
The shaded areas of the map indicate ESCAP members and associate members.
ECONOMIC AND SOCIAL COMMISSION FOR ASIA AND THE PACIFIC
I
NTEGRATEDI
NTERNATIONALT
RANSPORT ANDL
OGISTICSS
YSTEM FORN
ORTH-E
ASTA
SIAThis study was undertaken under a memorandum of understanding between UNESCAP and the Korea Transport Institute signed in 2001.
The designations employed and the presentation of the material in this publication do not imply the expression of any opinion whatsoever on the part of the Secretariat of the United Nations concerning the legal status of any country, territory, city or area or of its authorities, or concerning the delimitation of its frontiers or boundaries.
Mention of firm names and commercial products does not imply the endorsement of the United Nations.
The views expressed in this publication are those of the authors and do not necessarily reflect the views of the United Nations.
Values are in United States dollars unless specified otherwise.
This publication has been issued without formal editing.
Acknowledgements
Grateful acknowledgement is made to the Government of the Republic of Korea for the generous funding of this study.
TABLE OF CONTENTS
LIST OF TABLES VI
LIST OF FIGURES IX
LIST OF BOXES X
chapter one
INTRODUCTION 1
chapter two
OVERVIEW OF TRANSPORT AND LOGISTICS IN NORTH-EAST ASIA 3
2.1 ECONOMIC AND TRANSPORTATION TRENDS IN NORTH-EAST ASIA 3
2.2 TRANSPORT AND LOGISTICS IN NORTH-EAST ASIA 6
2.3 TRANSPORT AND LOGISTICS INFRASTRUCTURE IN NORTH-EAST ASIA 9
2.3.1 Existing conditions of transport infrastruture in North-East Asian countries 2.3.2 Asian highway and the priority road network
2.3.3 Trans-Asian Railway development and North-East Asia 2.3.4 Major ports in North-East Asia
2.3.5 Information and communications, and other logistics facilities
chapter three
FORMULATION OF AN INTEGRATED INTERNATIONAL TRANSPORT
AND LOGISTICS SYSTEM FOR NORTH-EAST ASIA 18
3.1. MAIN PRINCIPLES OF FORMULATIONS OF THE INTEGRATED TRANSPORT
AND LOGISTICS NETWORK 18
3.1.1 Main principles of network formulation 3.1.2 Main components of the system
3.2 PROPOSED INTEGRATED INTERNATIONAL TRANSPORT NETWORK IN NORTH-EAST ASIA 20
3.3 SELECTED INTERNATIONAL TRANSPORT CORRIDORS FOR ANALYSIS 21
chapter four
EVALUATION OF PERFORMANCE AND IDENTIFICATION OF
BOTTLENECKS IN SELECTED CORRIDORS 24
4.1 CORRIDOR 1 TANGGU-TIANJIN-BEIJING-ERANHOT-ZAMIN UUD-ULAANBAATAR-ULAN UDE 24 4.1.1 Significance
4.1.2 Current situation and prospects 4.1.3 Transport cost and time analysis
4.2 CORRIDOR 2 BUSAN-SEOUL-PYEONGYANG-SHENYANG-BEIJING-ZENGZHOU 32
4.2.1 Significance
4.2.2 Current situation and prospects 4.2.3 Transport cost and time
4.3 CORRIDOR 3 BUSAN-POHANG-KOSONG-WONSAN-KIMCHAEK-SONBONG-
RAZDOLNOYE-USSURIYSK-KHABAROVSK-BELOGORSK-CHITA-ULAN UDE 44
TABLE OF CONTENTS iii
4.3.2 Current situation and prospects 4.3.3 Transport cost and time
4.4 CORRIDOR 4 RAJIN/SONBONG - JILIN - CHANGCHUN - ULANHOT - SUMBER -ULAANBAATAR 50 4.4.1 Significance
4.4.2 Current situation and prospects 4.4.3 Transport cost and time
4.5 CORRIDOR 5 NAKHODKA/VLADIVOSTOK-USSURISK-POGRANICHNY-
HARBIN-MANZHOULI-CHITA-ULAN UDE 58
4.5.1 Significance
4.5.2 Current situation and prospects 4.5.3 Transport cost and time
4.6 CORRIDOR 6 DALIAN-SHENYANG-CHANGCHUN-HARBIN-HEIHE-
BLAGOVESHCHENSK-BELOGORSK 70
4.6.1 Significance
4.6.2 Current situation and prospects 4.6.3 Transport cost and time
chapter five
INTERNATIONAL LEGAL FRAMEWORK FOR TRANSPORT IN NORTH-EAST ASIA 78
5.1 INTERNATIONAL CONVENTIONS 78
5.1.1 China
5.1.2 Democratic People’s Republic of Korea 5.1.3 Japan
5.1.4 Mongolia
5.1.5 Republic of Korea 5.1.6 Russian Federation
5.2 BILATERAL AND MULTILATERAL TRANSPORT AGREEMENTS 87
5.2.1 China 5.2.2 Japan 5.2.3 Mongolia
5.2.4 Republic of Korea 5.2.5 Russian Federation
chapter six
PROPOSED STRATEGY AND ACTIONS FOR THE DEVELOPMENT OF THE INTEGRATED
INTERNATIONAL TRANSPORT AND LOGISTICS SYSTEM FOR NORTH-EAST ASIA 91
6.1 ISSUES IDENTIFIED 91
6.1.1 Infrastructure planning and development 6.1.2 Logistics and facilitation
6.2 STRATEGY AND PROPOSED ACTIONS 92
6.2.1 Strategy
6.2.2 Proposed actions
6.3 IMPLEMENTATION MECHANISM 93
6.3.1 National level 6.3.2 Subregional level 6.3.3 Regional level
REFERENCES
APPENDICES
I. PORT INFORMATION A. Ports of China
B. Ports of the Democratic People’s Republic of Korea C. Ports of Japan
D. Ports of the Republic of Korea E. Ports of the Russian Federation II. CONTAINER TERMINALS, ICD
A. Container terminals of China
B. Container terminals or cargo terminals of Japan C. Container terminals of the Republic of Korea D. Container terminals of the Russian Federation
III. INFRASTRUCTURE ALONG THE SELECTED CORRIDORS
A. Corridor 1 (Tanggu-Tianjin-Beijing-Eranhot-Zamin Uud-Ulaanbaatar-Ulan Ude) B. Corridor 2 (Beijing-Shenyang-Dandong-Pyongyang-Seoul-Busan)
C. Corridor 3 (Busan-Pohang-Kosong-Wonsan-Kimchaek-Sonbong-Razdolnoye-Ussuriysk-Khabarovsk- Belogorsk-Chita)
D. Corridor 4 (Rajin/Sonbong-Jilin- Changchun-Ulanhot-Sumber-Ulaanbaatar)
E. Corridor 5 (Nakhodka/Vladivostok -Ussurisk-Pogranichny-Harbin-Manzhouli-Chita-Ulan Ude) F. Corridor 6: Dalian-Shenyang-Changchun-Harbin-Heihe-Blagoveshchensk- Belogorsk
IV. MISSING LINKS IN THE KOREAN PENINSULA A. Missing Rail Links in the Korean Peninsula B Missing Railway Links in the Korean Peninsula C. Missing Road Links in the Korean Peninsula D. Kyungeui and Donghae Rail and Road Connections
REFERENCES v
LIST OF TABLES
chapter two
Table 2-1 Major indicators of North-East Asia 4
Table 2-2 Comparison of North-East Asia with selected major regional areas 4
Table 2-3 Economic growth rates in North-East Asia 4
Table 2-4 Trade mix of North-East Asian economies 6
Table 2-5 Rail passenger transport trends 7
Table 2-6 Rail passenger transport trends, normalized by population 7
Table 2-7 Rail freight transport trends 7
Table 2-8 Road passenger transport trends 8
Table 2-9 Road freight transport trends 8
Table 2-10 Container throughput trends in major North-East Asian ports 8
Table 2-11 Container throughput trends in North-East Asia 9
Table 2-12 Air transport trends in North-East Asia 9
Table 2-13 Comparison of transport infrastructure in North-East Asian countries 10 Table 2-14 Transport infrastructure per capita in North-East Asian countries 10 Table 2-15 Transport infrastructure per land area in North-East Asian countries 11
Table 2-16 Information system in the Republic of Korea 17
chapter three
Table 3-1 Dimensions of ISO and non-ISO containers 19
Table 3-2 Selected international transport corridors for analysis 21
Table 3-3 Suggested unimodal/intermodal routes along the six corridors 22
chapter four
Table 4-1 Major trade partners of Mongolia 24
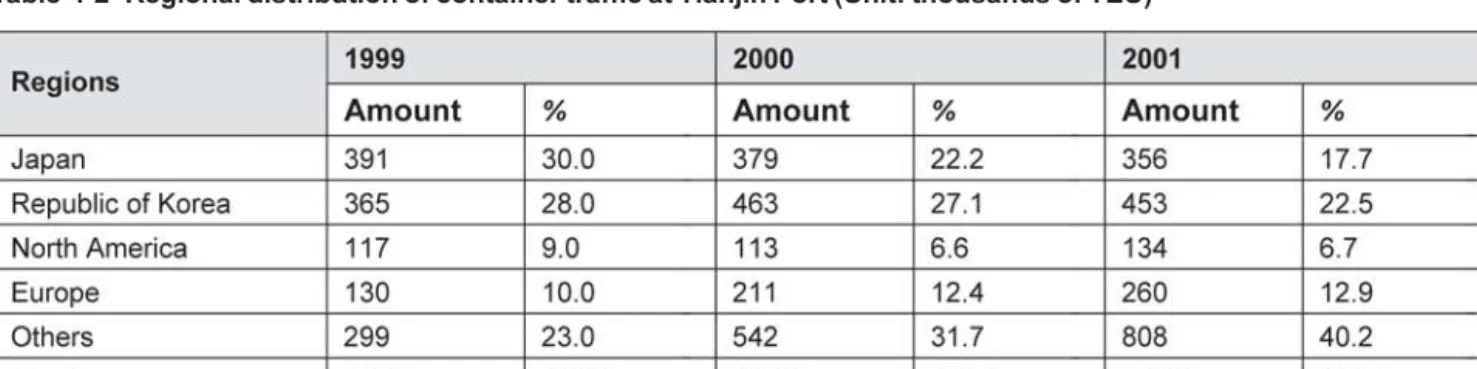
Table 4-2 Regional distribution of container traffic at Tianjin Port 25
Table 4-3 Tianjin Port container terminals 26
Table 4-4 Rail distance between Tanggu to Ulan Ude 27
Table 4-5 Freight traffic volume in Mongolia by mode 27
Table 4-6 Road distance between Tanggu and Ulan Ude 28
Table 4-7 Passenger traffic volume in Mongolia by mode 28
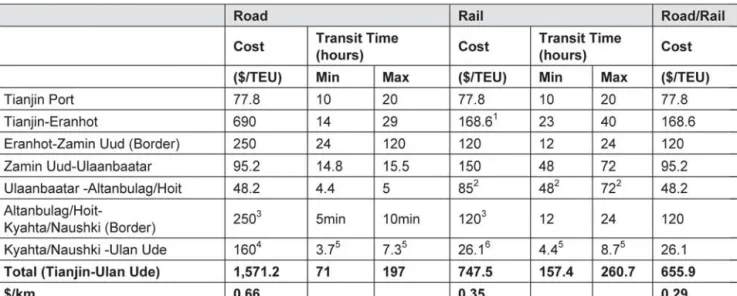
Table 4-8 Transportation cost and time from Tianjin Port to Ulan Ude 29
Table 4-8A Rail route (U-1.1) from Tianjin Port to Ulan Ude 31
Table 4-8B Intermodal route (I-1.2) from Tianjin Port to Ulan Ude 32
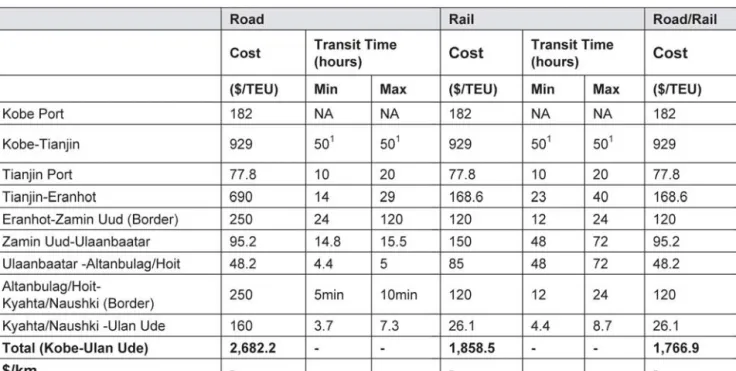
Table 4-8C Transportation cost and time from Kobe Port to Ulan Ude 32 Table 4-9 Major indicators of three metropolitan areas in the BESETO corridor 33 Table 4-10 Estimation of transport cost between Seoul and Shenyang/Beijing by mode 34
Table 4-11 Structure of container freight handled at Busan Port 35
Table 4-12 Regional distribution of container freight handled at Busan Port 35 Table 4-13 Structure of container freight handled at Gwangyang Port 36 Table 4-14 Regional distribution of container freight handled at Gwangyang Port 36
Table 4-15 Rail distance between Busan and Beijing 38
Table 4-16 Road distance between Busan and Beijing 39
Table 4-17 Cost and time for transport from Busan Port to Beijing 40
Table 4-17A Rail route (U-2.1) from Busan Port to Beijing 42
Table 4-17B Intermodal route (I-2.2) from Busan Port to Beijing 42
Table 4-17C Intermodal route (I-2.3) from Busan Port to Beijing 42
Table 4-17D Intermodal route (I-2.4) from Busan Port to Beijing 43
Table 4-17E Cost and time for transport from Tokyo to Beijing 43
Table 4-18 Rail distance between Busan and Ulan Ude 45
Table 4-19 Road distance between Busan and Ulan Ude 46
Table 4-20 Cost and time for transport from Busan Port to Ulan Ude 46
Table 4-20A Rail route (I-3.1) from Busan Port to Ulan Ude 49
Table 4-20B Intermodal route (I-3.2) from Busan Port to Ulan Ude 49
Table 4-20C Cost and time for transport from Yokohama Port to Ulan Ude 49 Table 4-21 Comparison of routes in Corridors 4 and 2: Hunchun-Busan 50 Table 4-22 Comparison of routes in Corridors 4 and 2: Changchun-Niigata 51
Table 4-23 Rail distance between Rajin/Sonbong and Ulaanbaatar 52
Table 4-24 Road distance between Rajin/Sonbong and Ulaanbaatar 53
Table 4-25 Cost and time for transport from Rajin/Sonbong Port to Ulaanbaatar 54 Table 4-25A Road route (U-4.1) from Rajin/Sonbong Port to Ulaanbaatar 56 Table 4-25B Intermodal route (I-4.2) from Rajin/Sonbong Port to Ulaanbaatar 56 Table 4-25C Intermodal route (I-4.3) from Rajin/Sonbong Port to Ulaanbaatar 57 Table 4-25D Intermodal route (I-4.4) from Rajin/Sonbong Port to Ulaanbaatar 57
Table 4-25E Cost and time for transport from Tokyo to Ulaanbaatar 58
Table 4-26 Comparison of routes in Corridors 5 and 6: Harbin/Suifenhe-Niigata 59
Table 4-27 Rail distance between Nakhodka and Ulan Ude 61
Table 4-28 Road distance between Nakhodka and Ulan Ude 62
Table 4-29 Cost and time for transport from Nakhodka/Vladivostok Port to Ulan Ude 62 Table 4-29A Rail route (U-5.1) from Nakhodka/Vladivostok Port to Ulan Ude 66 Table 4-29B Road route (U-5.2) from Nakhodka/Vladivostok Port to Ulan Ude 66 Table 4-29C Intermodal route (I-5.3) from Nakhodka/Vladivostok Port to Ulan Ude 67 Table 4-29D Intermodal route (I-5.4) from Nakhodka/Vladivostok Port to Ulan Ude 67 Table 4-29E Intermodal route (I-5.5) from Nakhodka/Vladivostok Port to Ulan Ude 68 Table 4-29F Intermodal route (I-5.6) from Nakhodka/Vladivostok Port to Ulan Ude 68 Table 4-29G Intermodal route (I-5.7) from Nakhodka/Vladivostok Port to Ulan Ude 69 Table 4-29H Intermodal route (I-5.8) from Nakhodka/Vladivostok Port to Ulan Ude 69
Table 4-29I Cost and time for transport from Tokyo to Ulan Ude 70
Table 4-30 Major indicators of Chinese North-East three provinces, 2002 71
Table 4-31 Rail distance between Dalian and Belogorsk 72
LIST OF TABLES vii
Table 4-33 Cost and time for transport from Dalian to Belogorsk 74
Table 4-33A Rail route (U-6.1) from Dalian Port to Belogorsk 76
Table 4-33B Road route (U-6.2) from Dalian Port to Belogorsk 76
Table 4-33C Intermodal route (I-6.3) from Dalian Port to Belogorsk 76 Table 4-33D Intermodal route (I-6.4) from Dalian Port to Belogorsk 77 Table 4-33E Cost and time for transport from Nagoya Port to Belogorsk 77
chapter 5
Table 5-1 Status of North-East Asian countries’ accession or being party to the international
conventions listed in UNESCAP resolution 48/11 (as of July 2006) 78 Table 5-2 The status of shipping agreement with the Republic of Korea 89
LIST OF FIGURES
chapter two
Figure 2-1 Asian Highway network 11
Figure 2-2 Trans-Asian Railway network 12
chapter three
Figure 3-1 Proposed integrated transport network in North-East Asia 20 chapter four
Figure 4-1 Present conditions of railway, Corridor 1 26
Figure 4-2 Present conditions of road, Corridor 1 28
Figure 4-3 Tianjin-Ulan Ude transit time (road) 29
Figure 4-4 Tianjin-Ulan Ude transit time (rail) 30
Figure 4-5 Cost-distance (Tianjin-Ulan Ude) 30
Figure 4-6 Cost breakdowns (road & rail combined) 31
Figure 4-7 BESETO corridors 33
Figure 4-8 Present conditions of railway, Corridor 2 37
Figure 4-9 Present conditions of road, Corridor 2 38
Figure 4-10 Busan-Beijing transit time (road) 40
Figure 4-11 Busan-Beijing transit time (rail) 41
Figure 4-12 Cost-distance (Busan-Beijing) 41
Figure 4-13 Present conditions of rail, Corridor 3 44
Figure 4-14 Present conditions of road, Corridor 3 45
Figure 4-15 Busan-Ulan Ude transit time (road) 47
Figure 4-16 Busan-Ulan Ude transit time (rail) 47
Figure 4-17 Cost-distance (Busan-Ulan Ude) 48
Figure 4-18 Present conditions of railway, Corridor 4 52
Figure 4-19 Present conditions of road, Corridor 4 53
Figure 4-20 Rajin-Ulaanbaatar transit time (road) 54
Figure 4-21 Rajin-Ulaanbaatar transit time (rail) 55
Figure 4-22 Cost-distance (Rajin-Ulaanbaatar) 55
Figure 4-23 Potential East Trade Corridor utilizing Corridor 4 and Corridor 5 59
Figure 4-24 Present conditions of railway, Corridor 5 60
Figure 4-25 Present conditions of road, Corridor 5 61
Figure 4-26 Nakhodka-Ulan Ude transit time (road) 63
Figure 4-27 Vladivostok-Ulan Ude transit time (road) 63
Figure 4-28 Nakhodka-Ulan Ude transit time (rail) 64
Figure 4-29 Vladivostok-Ulan Ude transit time (rail) 64
Figure 4-30 Cost-distance (Nakhodka-Ulan Ude) 65
Figure 4-31 Cost-distance (Vladivostok-Ulan Ude) 65
Figure 4-32 Dalian-Harbin axis 71
Figure 4-33 Present conditions of railway, Corridor 6 72
Figure 4-34 Present conditions of road, Corridor 6 73
Figure 4-35 Dalian-Belogorsk transit time (road) 74
Figure 4-36 Dalian-Belogorsk transit time (rail) 75
LIST OF FIGURES ix
LIST OF BOXES
chapter three
Box 3.1 Cost/time-distance methodology for analysing transport routes 23 chapter five
Box 5.1 Convention on Road Traffic 80
Box 5.2 Convention on Road Signs and Signals 80
Box 5.3 Customs Convention on the Int’l Transport of Goods Under Cover of TIR Carnets 81 Box 5.4 Customs Convention on the Temporary Importation of Commercial Road Vehicles 82
Box 5.5 Customs Convention on Containers 82
Box 5.6 International Convention on the Harmonization of Frontier Controls of Goods 83 Box 5.7 Convention on the Contract for the International Carriage of Goods by Road 83
ONE: INTRODUCTION
Recent political, economic and social developments in North-East Asia have highlighted the benefit of intensifying regional cooperation. In particular, the emergence of China as an active participant in the world market has substantially changed the size and structure of interregional transactions of commodity and capital in North-East Asia. Furthermore, the Russian Federation is expected to become a more important participant in North-East Asia’s economy.
In the current international environment characterized by globalization and regionalization, transport and logistics system integration is a prerequisite for countries to maintain competitiveness and has become a key factor for sustained employment creation and economic growth. The case of the European Union (EU) provides an excellent example of transport integration that supports economic integration. The EU has been seeking to provide an integrated transport and logistics network throughout Europe by eliminating missing links, alleviating bottlenecks and securing interoperability of the network.
Although some of the countries in North-East Asia are the most economically active in the world, the transport and logistics network is neither sufficient nor well integrated at the international level.
In order to assist countries in the subregion in addressing these issues, the United Nations Economic and Social Commission for Asia and the Pacific (UNESCAP) jointly with the UNDP Tumen Secretariat and in collaboration with participating countries (China, the Democratic People’s Republic of Korea, Japan, Mongolia, the Republic of Korea and the Russian Federation) and with assistance of the Korea Transport Institute (KOTI) have initiated a project entitled Integrated international transport and logistics system for North-East Asia.
The main purpose of this project is to assist the member countries in North-East Asia in promoting an integrated approach to international transport and logistics planning and policy formulation. The project is focused on the following four areas:
1 formulation of an integrated international transport network in North-East Asia
2 review of existing transport and logistics infrastructure and development plans along the major transport routes in the North-East Asia
3 evaluation of performance of the Network and identification of infrastructure and institutional bottlenecks 4 the development of guidelines and action plans in collaboration with the participating countries for the
operationalization and development of the Network.
The project will contribute to the development of a reliable and efficient international transport and logistics system in North-East Asia to improve efficiency, reduce costs and improve the level of services and thereby enhance the competitiveness of products of North-East Asian countries in the world market.
The present study summarizes the major findings of the project and consists of six chapters. Following this introductory chapter, Chapter 2 reviews the existing international transport and logistics facilities in North-East Asia. In Chapter 3, an integrated international transport network is proposed. Chapter 4 evaluates performance and identifies bottlenecks in selected international transport corridors. Chapter 5 discusses the current international transport framework in North-East Asia. Finally, Chapter 6 proposes strategies and actions for the development of the integrated international transport and logistics system for North-East Asia.
TWO: OVERVIEW OF TRANSPORT AND LOGISTICS IN NORTH-EAST ASIA
2.1 ECONOMIC AND TRANSPORTATION TRENDS IN NORTH-EAST ASIA
North-East Asia is an area with potential for future growth and economic cooperation among neighbouring economies. Since the end of the Cold War, economic cooperation between North-East Asian economies has increased very rapidly. The emergence of China and the Russian Federation in the free world market has substantially changed the size and structure of intraregional transactions of commodities and capital in North-East Asia. With Japan on one side as one of the most advanced industrial countries and China on the other side as the largest developing economy, North-East Asia has become an economic region composed of diverse and dynamic economies.
Furthermore, there are many other important factors that can increase economic ties among these countries.
Continuing reduction of government controls and regulations on domestic production and foreign trade has forced the globalization of markets and encouraged the growth of trade and capital flows in North-East Asia. With increasing openness toward the import of goods and capital from each other, the economic interdependence of North-East Asian countries will increase in the future. The complementary production structures and factor endowments of North-East Asian countries, in addition to geographical and cultural proximity, will promote closer economic ties in the region.
Table 2-1 illustrates the current economic positions of North-East Asian countries. As of 2004, North-East Asia covers 5.7 per cent of the total world area, and has 25.8 per cent of the total world population. This high population forms an abundant labor pool and a huge intraregional market. Meantime, the combined output of North-East Asia accounts 18.4 per cent of the world GDP and its share of the world’s freight transport is over 28 per cent. The trade volume in this region consists of 17.3 per cent (19.0 per cent for export and 15.7 per cent for import) of the world, compared to 39 per cent of the European Union (EU) and 21 per cent of the NAFTA respectively (see Table 2-2). Traditionally, international trade has provided North-East Asian countries with the driving forces of their economic growth.
Japan is the largest economy in the region with $4.3 trillion GDP in 2003, and China is the fastest growing economy with an economic growth rate of 10.2 per cent on average per annum throughout the 1990s (Table 2-3). North-East Asia’s share of the world economy will further increase through the economic growth of China and other North-East Asian countries, despite the relative contradiction of the Japanese economy.
The existence of all essential factors for economic growth – i.e. abundant labor force and capital, a huge intraregional market and a high level of technology – has resulted in directing international attention to North-East Asia.
Table 2-1 Major indicators of North-East Asia
Sources: Central Intelligence Agency, USA, The World Fact Book 2004 (As of December 7th, 2004); National Statistics Organization, Republic of Korea, www.nso.go.kr (as of December 7th, 2004); United Nations Statistics Division www.unstats/un.org; World Bank www.worldbank.org; WTO, World Trade Report 2005.
Notes: * 2002 Estimated
** GNP is used
Sources: Central Intelligence Agency, USA, The World Fact Book 2004 (As of December 7th, 2004);
WTO, World Trade Report 2004 (based on 2003 data); IMF, Direction of Trade 2003 (based on 2002 data)
Notes: * Amount of intraregional trade divided by the total amount of trade.
a: as of 2004; b: as of 2003; c: as of 2002.
Table 2-3 Economic growth rates in North-East Asia (unit: %)
Source: Adapted from Chang-Jae Lee, et al., A new strategy for North-East Asian economic cooperation, KIEP, 1999 Table 2-2 Comparison of North-East Asia with selected major regional areas
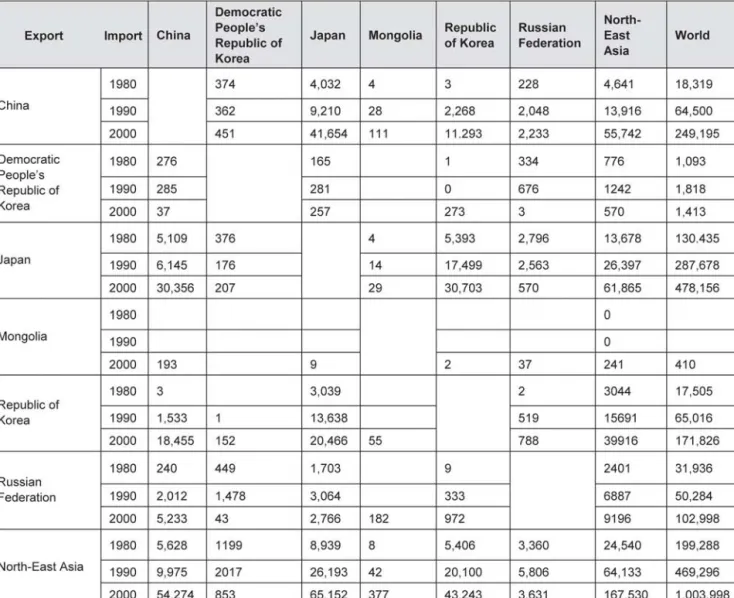
Interdependence of trade between the countries in North-East Asia has been increasing rapidly. The regionalization is expected to deepen with the increasing intraregional movement of goods and capital (see Table 2-4). The main reason for this expectation is the high level of economic complementariness existing among countries in North-East Asia. While China, for example, has abundant labor forces and a huge market, Japan has a high level of capital and technology. From a perspective of production, if these specialized factors can be combined in an efficient way, this will bring these countries greater economic achievement. In addition, from a perspective of consumption, these three countries can form a complementary market. That is, China can purchase high-tech products from Japan and the latter can be major consumers of labor-intensive Chinese products. In this sense, deepening regionalization can give North-East Asian countries mutual benefits.
The total trade of North-East Asian countries with the world increased from $238.6 billion in 1980 to $1,327.6 billion in 2000 at an average annual growth rate of 8.1 per cent. However, its intraregional trade amount increased from $46.6 billion to $442.9 billion during the same period at an average annual growth rate of 12.1 per cent. The intraregional trade amount of the North-East Asian countries in 1980 was only 19.5 per cent of their trade amount with world, but, in 2000, it increased to 33.4 per cent. Between 1980 and 2000 the Republic of Korea showed an increase in its share of intraregional exports, increasing from 23.3 per cent to 34.6 per cent. Japan also showed an increase from 19.1 per cent to 26.2 per cent. The Chinese share had increased from 49.6 per cent in 1980 to 65.1 per cent in 1990 through its foreign open-door policy but decreased to 42.6 per cent in 2000.
To capture the opportunities of liberalization of trade in the traditional and emerging markets there has to be sustained cooperation among the economies in the region. To a greater degree than Europe and North America, North-East Asia is beset with difficulties arising from political, economic and historical origins.
There have been a series of discussions and suggestions on regional development and infrastructure in North-East Asia. The close link between economic development and infrastructure building has been emphasized in some literature on regional development. Specifically, industrial development and its geographical distribution have direct ties with the availability of transport infrastructure. In North-East Asia, however, regional transport systems are not set up. Regional routes are being operated in most cases through the mutual agreement of related countries, which entail subdivided and thus inefficient small markets.
Connection through inland transport systems is very limited except for some railway lines.
Before China and the Russian Federation entered the free market, there was little opportunity for cooperation among the North-East Asian countries on regional development and on transport networks. While policymakers are aware of the benefits of a free market economy and the need for changes in policy, these policy directions have yet to filter down to the provincial and ground level. Regulations at border crossings are still strict and complex. Policy makers still tend to favor domestic industries, and flow channels are limited to designated ports. With the emergence of the regional market, a transportation network for the region as a whole should be formulated and operationalized in order to enhance the cooperation in regional economic development. This would have a substantial impact on market expansion and growth.
CHAPTER TWO: OVERVIEW OF TRANSPORT AND LOGISTICS IN NORTH-EAST ASIA 5
2.2 TRANSPORT AND LOGISTICS IN NORTH-EAST ASIA
Unlike the EU where member countries are more or less homogeneous in terms of the level of economic development and transport-related infrastructure, North-East Asia consists of countries whose socioeconomic characteristics differ vastly. Japan has the world’s second largest economy with a per capita GDP of over
$37,400 while China’s per capita GDP is still less than $1,000.
As a result of these economic differences, as well as historical differences that have resulted in some modes being more prominent and accessible than others in some areas, transport demand also varies by country. Table 2-5 shows the intercity rail passenger transport trends in North-East Asian countries from 2000 through 2003. Demand in million person-kilometres traveled has remained fairly stagnant in recent years for all North-East Asian countries except China. China also has the highest rail demand among North-East Asian countries.
However, China has the world’s largest population and the world’s third largest land area. Although China experienced 25 percent more person-kilometres traveled than Japan, for example, it has more than 10 times the population (Table 2-6).
Table 2-4 Trade mix of North-East Asian economies (unit: million dollars)
Source: http://www.kotis.net/main/tradedb.html
Table 2-7 shows the rail freight transport trends in North-East Asian countries from 2000 through 2003.
Demand in million ton-kilometres traveled has remained relatively constant for Japan and the Republic of Korea. Like passenger rail, China experiences the highest amount of freight ton-kilometres traveled by rail among the North-East Asian countries. The Russian Federation has a similarly high amount of ton-kilometres traveled by rail. The Russian Federation and China, however, have the first and third highest land areas in the world, respectively, and long distances are often required for freight transport.
Table 2-5 Rail passenger transport trends (unit: million person-km)
Sources: National Bureau of Statistics, China, www.stats.gov.cn; Statistics Bureau & Statistics Center, Japan, www.stat.go.jp;
National Statistical Office, Mongolia, Mongolian Statistical Yearbook 2003; Ministry of Construction and Transportation, Republic of Korea, Statistics – An Annual Report, www.moct.go.kr
Table 2-6 Rail passenger transport trends, normalized by population (unit: km/person)
Sources: National Bureau of Statistics, China, www.stats.gov.cn; Statistics Bureau & Statistics Center, Japan, www.stat.go.jp;
National Statistical Office, Mongolia, Mongolian Statistical Yearbook 2003; Ministry of Construction and Transportation, Republic of Korea, Statistics – An Annual Report, www.moct.go.kr
Table 2-7 Rail freight transport trends (unit: million ton-km)
Sources: National Bureau of Statistics, China, www.stats.gov.cn; Statistics Bureau & Statistics Center, Japan, www.stat.go.jp;
National Statistical Office, Mongolia, Mongolian Statistical Yearbook 2003; Ministry of Construction and Transportation, the Republic of Korea, Statistics – An Annual Report, www.moct.go.kr
Transport demand by road also varies widely by country (Table 2-8). Despite having a large land area and over one billion people, China has fewer person-kilometres traveled by road than the Republic of Korea, whereas Japan – with the strongest economy in North-East Asia but a significantly smaller land area and population – has the highest amount of person-kilometres traveled by road. The average Japanese citizen travels significantly more by rail and road than citizens of any other North-East Asian country.
CHAPTER TWO: OVERVIEW OF TRANSPORT AND LOGISTICS IN NORTH-EAST ASIA 7
Japan also experiences a high level of ton-kilometres traveled by road-twice as many as the Russian Federation (Table 2-9). Relative to rail, Japan relies heavily on trucks for freight transportation. In China, however, rail dominates freight transportation by land.
As the economy in this region has grown rapidly, container traffic and air transport demands also have increased very quickly. Container movements in major North-East Asian ports have shown spectacular growth in most cases, except in ports in Japan. Chinese ports in particular have shown more than a tenfold increase during the 1990-2000 periods (Tables 2-10 and 2-11).
Air transport in North-East Asia has increased in most countries. Both passenger and freight traffic have increased due to rises in income, overseas travel liberalization and the increases in intraregional trade.
Although air transport occupies less than 2 per cent in volume, the value of goods transported by air is close to 30 per cent of the total traffic (see Table 2-12). In order to meet the ever-increasing air transport demand, major Asian countries are planning on expanding air transport related facilities.
Table 2-10 Container throughput trends in major North-East Asian ports (unit: 1,000 TEU) Table 2-8 Road passenger transport trends (Unit: million person-km)
Table 2-9 Road freight transport trends (Unit: Million ton-km)
Sources: National Bureau of Statistics, China, www.stats.gov.cn; Statistics Bureau & Statistics Center, Japan, www.stat.go.jp;
National Statistical Office, Mongolia, Mongolian Statistical Yearbook 2003; Ministry of Construction and Transportation, the Republic of Korea, Statistics – An Annual Report, www.moct.go.kr
Notes: Complete data on road person-kilometres traveled were not available for the Russian Federation.
Sources: National Bureau of Statistics, China, www.stats.gov.cn; Statistics Bureau & Statistics Center, Japan, www.stat.go.jp;
National Statistical Office, Mongolia, Mongolian Statistical Yearbook 2003; Ministry of Construction and Transportation, the Republic of Korea, Statistics – An Annual Report, www.moct.go.kr
Source: Containerisation International Yearbook
2.3 TRANSPORT AND LOGISTICS INFRASTRUCTURE IN NORTH-EAST ASIA 2.3.1 Existing conditions of transport infrastruture in North-East Asian countries
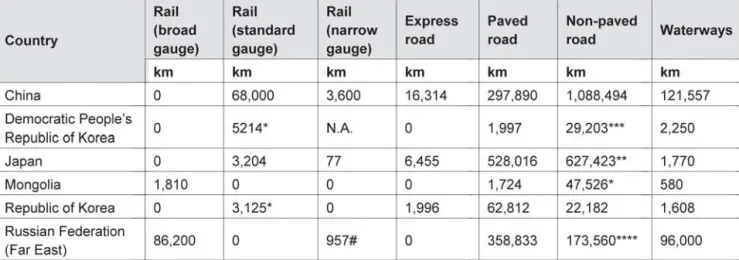
Transport related infrastructure development and transport and logistics demands differ greatly among the nations in North-East Asia. First of all, the level of motorization is quite different among the North-East Asian countries. The road network is continuously increasing in most North-East Asian countries along with the development of railway in some countries (see Table 2-13). The Russian Far East has the largest railway network of any of the North-East Asian countries with more than 87,000 km. China has more than 71,000 km. Mongolia, with 1,810 km of rail lines, has the smallest network.
China has more than 1.4 million miles of roads, making it the North-East Asian country with the largest road network. It also has the greatest number of express roads. Japan, despite being the fourth largest country in North-East Asia and being considerably smaller than the top three, has nearly 1.2 million miles of road network and the largest number of paved roads. The Democratic People’s Republic of Korea has the smallest road network.
China’s large expanses of inland territory are accessed by 121,557 km of navigable waterways. The Russian Far East has 96,000 of waterway. Mongolia, despite being a large, landlocked country has relatively few navigable waterways. Japan, the Republic of Korea, and the Democratic People’s Republic of Korea all have few navigable waterways. However, these countries are relatively small in land area and either completely or almost completely surround by ocean.
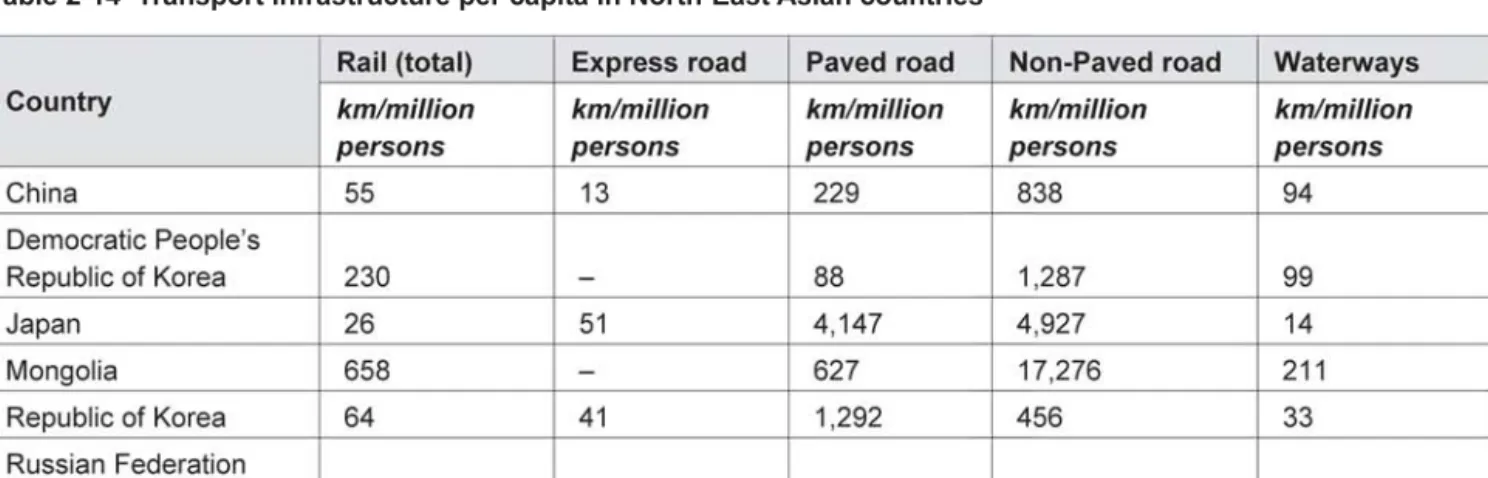
The countries of North-East Asia vary considerably by population and land area. When compared to total population, the Russian Far East still has the most substantial rail network (Table 2-14). The Russian Far East has a relatively small number of people (7.2 million) spread over a considerable land area (6.6 million km2). A large railway network is required to connect such large expanses, though there are fewer people there. Mongolia has the second highest rail kilometres per capita: despite having the smallest
Table 2-11 Container throughput trends in North-East Asia (unit: 1,000 TEU)
Source: Containerization International Yearbook
Table 2-12 Air transport trends in North-East Asia (unit: million person-km, million ton-km)
Sources: National Bureau of Statistics, China, www.stats.gov.cn; Statistics Bureau & Statistics Center, Japan, www.stat.go.jp;
National Statistical Office, Mongolia, Mongolian Statistical Yearbook 2003; Ministry of Construction and Transportation, the Republic of Korea, Statistics – An Annual Report, www.moct.go.kr
CHAPTER TWO: OVERVIEW OF TRANSPORT AND LOGISTICS IN NORTH-EAST ASIA 9
rail network in North-East Asia, it also has the smallest population. China, with the largest population in the world, has only 55 km of rail per million persons.
Table 2-13 Comparison of transport infrastructure in North-East Asian countries
The Russian Far East has the most centerline kilometres of roadway per capita, more than four times higher than Mongolia and eight times higher than Japan. It also has nearly 50,000 km of paved road per million persons. Japan has the most centerline kilometres of express road per capita. Despite having the most absolute number of centerline kilometres of roadway of the North-East Asian countries, China has the lowest centerline kilometres of roadway per capita. When compared to population, the Russian Far East has the highest amount of waterways per capita, followed by Mongolia, in part due to their relatively small populations.
Table 2-14 Transport infrastructure per capita in North-East Asian countries Notes: * Estimated in 2003 **1998 ***1999 ****2000
# Narrow gauge is on Sakhalin Island
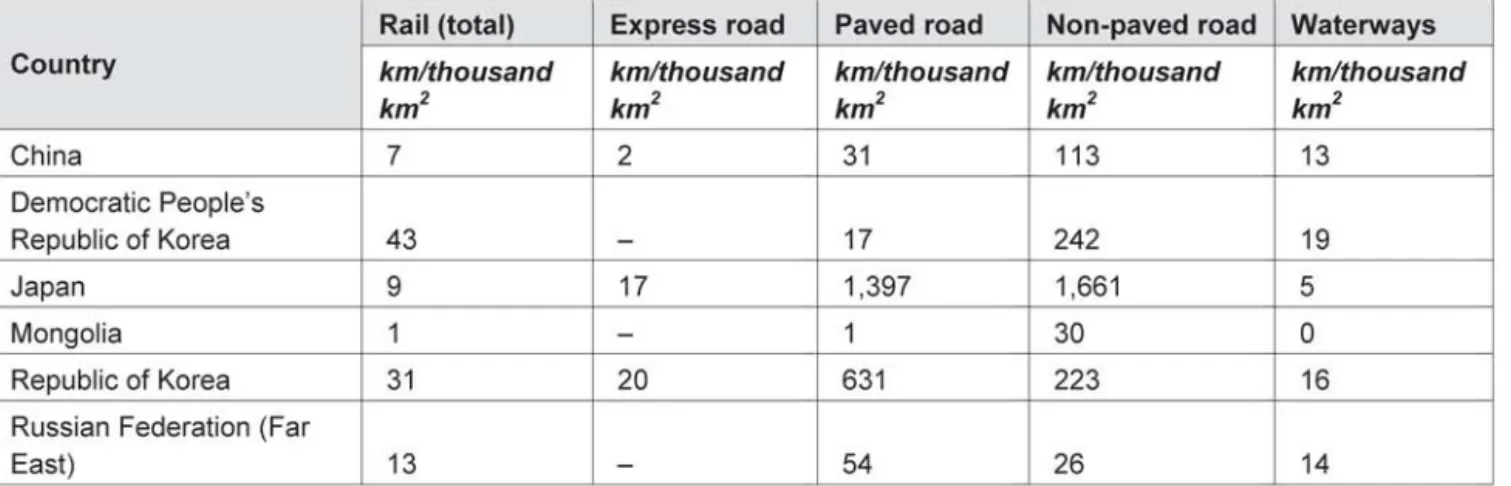
Table 2-15 compares transport infrastructure per land area for each North-East Asian country. Centerline kilometres of infrastructure per land area give an indication of the level of accessibility in a country. The Democratic People’s Republic of Korea and the Republic of Korea, with their relatively small land areas, have the highest centerline kilometres of rail per thousand square kilometres of land area. Japan has over 3,000 km of roadway per thousand km2, making it the most accessible North-East Asian country by car or truck. All the North-East Asian countries except Japan and Mongolia have similar rates of waterway kilometres per land area.
Table 2-15 Transport infrastructure per land area in North-East Asian countries
2.3.2 Asian Highway and the priority road network
In order to meet the increasing demand for reliable and efficient land transport linkages and services in the Asian Pacific region, the Asian Highway project was initiated to promote the development of international road transport. Under the auspices of UNESCAP, the member countries have adopted the Asian Highway Network of 140,000 km in 32 countries with coordinated alignment, unified standards and signage (see Figure 2-1). The Asian Highway network was formalized through the Intergovernmental Agreement on the Asian Highway Network, which entered into force on 4 July 2005. As of September 2006, the agreement has been signed by 28 countries, of which 20 are Parties to the agreement.
CHAPTER TWO: OVERVIEW OF TRANSPORT AND LOGISTICS IN NORTH-EAST ASIA 11
Figure 2-1 Asian Highway network
Recognizing the importance of the Asian Highway and the catalytic role that road transport plays in regional economic growth, the priority road network has been formulated for the North-East Asian region. The purpose of a priority road network is the acceleration of economic and social development in all countries of the subregion and the promotion of greater economic cooperation. Its development would open up opportunities throughout the region. The objective is to develop a road network for the mutual benefit of all countries concerned through national commitments and coordinated development .
2.3.3 Trans-Asian Railway development and North-East Asia
The Trans-Asian Railway originally consisted of a southern corridor going through South-East Asia, Bangladesh, India, the Islamic Republic of Iran, Pakistan and Turkey, but was later expanded under the Asian Land Transport Infrastructure Development (ALTID) project to cover the whole of Asia. It was made possible by a lessening of political tensions between the countries involved, the rapid economic development of China, the possibility of greater economic exchanges with the Democratic People’s Republic of Korea and the prospects of accelerated economic development in Mongolia and the Russian Federation. Accordingly, ESCAP concluded a feasibility study on connecting the railways of China, Mongolia, the Russian Federation and the Korean Peninsula with a view to identifying the Trans-Asian Railway routes in the countries concerned.
The study also considered route requirements and the border crossing facilitation measures required to assist in organizing efficient container land bridges between Asian and Europe that could compete with shipping services. The Trans-Asian Railway network now comprises of 81,000 km of railways in 28 member countries (see Figure 2-2).
Figure 2-2 Trans-Asian Railway network
The Trans-Asian Railway network has also been formalized through the Intergovernmental Agreement on the Trans-Asian Railway Network. The agreement was adopted by the Commission in its resolution 62/4 of 12 April 2006 with a view to its being opened for signature on 10 November 2006, during the Ministerial Conference on Transport, scheduled to be held in Busan, Republic of Korea, from 6 to 11 November 2006.
The links forming the Trans-Asian Railway network (as well as the Asian Highway network) were identified by the participating countries in accordance with agreed criteria. The link had to fulfil one or more of the following:
• capital to capital link (for international transport)
• connection to main industrial and agricultural centers (link to important origin and destination points)
• connection to major sea and river ports (integration of land and sea transport networks)
• connection to major container terminals and depots (integration of rail and road networks).
Selected Trans-Asian Railway route data received from national experts in each North-East Asian country are provided in the appendix.
2.3.4 Major ports in North-East Asia
Given the physical geography of North-East Asia, ocean transportation is essential, if not unavoidable to access markets. From the early stages of cargo transportation, sea trade routes and rudimentary cargo movement always seems to have existed, regardless of political circumstances. In recent years, transport volumes of intraregional trade have increased significantly because of the reinforcement of economic cooperation in the region, with far more emphasis placed on development of coastal shipping than ocean shipping.
In the North-East Asian subregion, it is generally known that port facilities are quite sufficient in Japan and the Russian Federation relative to their trade volumes. In China and the Republic of Korea, however, even massive port construction has been unable to keep pace with the dramatic increase in maritime traffic.
Faced with serious problems due to lack of infrastructure, countries in North-East Asia have implemented new approaches to port development and management, which were traditionally funded and managed by the public sector. These new ways include deregulation, improvement of foreign direct investment and private sector involvement in ports.
In China, where 90 per cent of its trade volume is transported by sea, one can see the bustle of activity from ports dotted along the coastline stretching 18,400 km. At the end of 2002, the number of berths in operation in China totaled 33,600, among which 835 were deep-draft berths.1 As China’s exports and imports of container cargoes increase rapidly, Chinese ports increasingly dominate the rankings of world container port throughput. There were seven Chinese ports included in the top 30 container ports as of 2003 – Shanghai, Shenzhen, Qingdao, Tianjin, Guangzhou, Ningbo and Xiamen.2 The Port of Dalian, which is located at the southern tip of the Liaodong Peninsula, serves as the gateway to the Northeastern provinces of China. The port is linked to an inland container transport network with dedicated train services to the inner cities of Changchun, Harbin, Shenuang and Yanji, with more than 40 departures every week.
1 The Ministry of Communications of the People’s Republic of China, The 2002 Report on China’s Shipping Development, July 2003, p.17.
2 Containerisation International, March 2004, p.85.
CHAPTER TWO: OVERVIEW OF TRANSPORT AND LOGISTICS IN NORTH-EAST ASIA 13
In order to meet the increasing demand for port capacity, China has wide range of long-term port development plans supported by the central government budget and foreign direct investment. Emphasis is on the development of container terminals at the major ports including the Yang Shan deep-draft port project, the first phase of which began construction in 2002.3
In the Democratic People’s Republic of Korea, with its heavy dependence on railway transport, road and maritime transport have played only supporting roles in the transport system. It is generally understood that the quality of port facilities in Democratic People’s Republic of Korea requires improvement.
There are seven international trade ports in the Democratic People’s Republic of Korea, i.e., Nampo, Chongjin, Rajin, Wonsan, Songrim, Haeju and Hungnam.4 Nampo Port on the west coast is located near to Pyongyang and has a total of nine large berths with a combined length of nearly 2 km. Chongjin Port on the east coast has two main harbour areas: one specializing in coal and iron ore exports, while the other mainly handles imports of general and bulk cargo. With floating and multi-purpose cranes, container handling is available at Chongjin Port.5 Rajin Port, located at the centre of the Rajin-Sonbong Free Economic and Trade Zone, has 13 berths totaling 2,520 m with the depth of 8-10.6 m. Rajin Port is capable of accommodating ships of the 5,000 to 30,000 ton class. Containers are handled using ordinary wharf cranes.6 Japan has established a network of around 1,100 ports including 21 specific important ports (trade ports) and 133 important ports that handle 42.2 per cent (based on ton-km) of domestic cargo and 99.8 per cent of international cargo. National port and harbour policy in Japan provides for planned long-term development of the country’s ports in response to changing socioeconomic development and port-related demands. According to the 1996 Council for Ports and Harbours Report, in consideration of their significant affect on the country’s distribution channels and costs, investment in container terminals has been emphasized due to their contribution to lowering distribution costs. In 1998, new government policy on the development and operation of container terminals, the core of international container distribution, was formulated as a means of reducing usage costs and correcting the high cost structure of the local and national economies.
To this end, Japan is moving towards developing gateway ports and subsidiary gateway ports. Deepwater, high standard international container terminals will be established at gateway ports in Tokyo Bay, Ise Bay, Osaka Bay and Northern Kyushu. These terminals will accommodate post-Panamax container vessels, which will further enhance multi-functioning as international distribution ports. Enhancing these ports will enable them to serve as global shipping channel network hubs, frequently providing port of call services and connecting each port of Japan with the rest of the world. The central ports are to be located in Hokkaido, Nihonkai- Chubu, Eastern Tohoku, Northern Kanto, Suruga Bay Coast and Chugoku. Southern Kyushu and Okinawa will be designated subsidiary gateway ports to complement gateway ports. They will serve as bases for a shipping network that connects Japan with Southeast Asia and other regions exhibiting remarkable growth.7
3 The Yang Shan deep-draft port project is designed to have 50 container berths that can accommodate the fifth and sixth generation of container vessels with the designed annual throughput capacity of 2.2 million TEU. The first phase of the project is expected to complete and put into operation by the end of 2005. (The Ministry of Communications of the People’s Republic of China, The 2002 Report on China’s Shipping Development, July 2003, p.18.)
4 Presentation by the Delegation of the Democratic People’s Republic of Korea at the Regional Seminar on Commercial Development of Ports as Logistics Centres, 11-12 July 2002, Bangkok.
5 Lloyd’s List, Port of the World 2005.
6 ERINA, Vision for the Northeast Asia Transportation Corridors, ERINA Booklet, Vol. 1, June 2002.
7 Ministry of Land, Infrastructure and Transport of Japan, Ports and Harbours in Japan 2002.
Japan is also forging ahead with the Super Hub Port project to compete with other major ports in Asia in terms of cost and service by developing large-scale, integrated terminal systems and taking advantage of information technology (IT). In June 2004, three major ports (Tokyo Bay, Osaka Bay and Ise Bay) met the requirements for designation as super hub ports.8
While the Republic of Korea has been implementing a long-term port development plan, delays have prevented the timely expansion of port facilities to meet the rapid surge of export and import trade as well as drastic increases in transshipment demand from and to Chinese ports. As of 2002, for example, the total designed capacity of ports in the Republic of Korea was on average only 79 per cent of total demand.
Worse is the situation in the case of container cargo. The supply of container handling facilities in Busan Port in 2002 remained around 65 per cent of demand and nearly 30 per cent of container cargo was handled at conventional general cargo berths.9
In an effort to realize the nation’s vision to play the role as the main logistics hub for North-East Asia, a vigorous port development plan is being pursued to expand the facilities at major ports. The ports of Busan and Gwangyang are to be developed as mega container hub ports and the port of Incheon as a gateway of the Seoul and Incheon metropolitan area, in particular for the trade with China.
Along the coast of the Russian Federation, there are a total of 22 large ports and 100 small ports. In the far eastern region of the Russian Federation, the three most important ports are Vladivostok, Nahodka, and Vostochny, which are linked with the Trans Siberian Railway (TSR). Within the region, Nahodka and Vostochny have the single largest port system, which handles mostly container cargo for TSR. The Russian ports in the Far Eastern region have the potential to benefit from possible increase in traffic between North- East Asia and Europe through the TSR. The possibility also exists for Russian ports to handle transit cargo to and from the North-Eastern provinces of China.
2.3.5 Information and communications, and other logistics facilities
In China, the companies that operate both container terminals and transport containers have their own information systems (i.e. EDI system). However, subcontractors do not have such sophisticated computerized management systems so they rely on other equipment to connect and communicate with business partners. The equipment provides the location of freight and containers and their status. Some big carriers also have their own GPS and GIS systems to trace their containers and vehicles.
China uses a transport management information system (TMIS). The major ports are able to receive information in advance on arriving containers; and within the next five to ten years they will introduce a multimodal waybill for the transport of containers. In next the five years the railway IT system will connect main ports and customs.
In the Republic of Korea, the transport/logistics information system can be divided into the government sector and the private sector. In the government sector, each ministry of government has developed various kinds of the transport/logistics information systems independently. The Port Management Information System (PORTMIS) was developed by the Ministry of Maritime Affairs and Fisheries in 1991 (then known
8 http://www.mlit.go.jp/kisha/kisha04/11/110723_.html
9 Ministry of Maritime Affairs and Fisheries, Republic of Korea, White Paper 2002-2003 (in Korean).
CHAPTER TWO: OVERVIEW OF TRANSPORT AND LOGISTICS IN NORTH-EAST ASIA 15
as the Korea Maritime and Port Administration) to manage ships entering the ports, as well as cargo transport in the port area, port facilities, and port decision making.
The introduction of PORTMIS provided momentum for promoting the information network among relevant government ministries by reducing logistics costs and providing a paperless process. In 1991, the Ministry of Industry and Energy established the Korea Trade Network Company and developed the KTNet (Korea Trade Network) which is controlled by the Customs Administration. Since 1997, KTNet has overseen imports and exports, customs clearance, finance to trading companies, shipping lines, insurance companies and banks. The KTNet, the first EDI system in the Republic of Korea, developed the KEDIFACT by accepting the EDIFACT developed in Europe as an EDI standard.
Apart from developing the KTNet, Ministry of Maritime Affairs and Fisheries developed the KLNet (Korea Logistics Network) jointly with shipping lines and forwarders because the KTNet did not provide services closely related with cargo flow. In order to reduce the time and cost incurred in the process of exporting and importing cargoes, the KLNet provides EDI service to all logistics related firms such as shipping lines, forwarders, transport firms, ICDs (inland container depots), shippers, the Customs Administration and the National Railroad.
In addition, the Ministry of Construction and Transportation has established an integrated logistics network – the KTLOGIS – supported by manufacturing firms, transport firms and warehousing firms. The KTLOGIS completed its first phase development in 1997, the second phase in 2000. The third phase will be completed in 2015. The main services available from the KTLOGIS are the electronic data interchange (EDI), the database system of import and export information (DBsystem), and commercial vehicle operation (CVO), which are provided to parties such as the manufacturing firms, transport firms and warehousing firms.
Since 1997 the PORTMIS has been interconnected with the KLNet through the sharing of the DBsystem.
In addition to that, the KLNet is linked with the KTNet and with KTLOGIS by mediating the information.
Information communication technology, especially Internet technology, has developed rapidly recently, with the private sector promoting electronic commerce actively by using Internet networking systems. Most shipping lines, such as the Hyundai Merchant Marine, Hanjin Shipping Lines and Choyang Shipping Lines, provide their customers with information about ship schedules, cargo reservations, cargo tracking systems, notices of cargo arrival and issues of bills of landing via the Net. These private companies are competing with the KLNet, KTNet, KTLOGIS in the area of the electric commerce. Hanjin Shipping Line is allied with Cyber Logitech, the information and communication company, in order to facilitate quick decision making, to increase productivity and to provide inland transport services. Korea Express, Samsung SDS and SK are also operating a logistics information service for their customers and are connecting their network with KTNet, KLNet, KTLOGIS.
The main and difficult issues that have occurred in the process of providing logistics information are the complexity of working processes and the variety of the interested parties. The first problem is the inadequate interconnecting capability of the service providers in collecting and managing the integrated information, which cannot be provided by individual logistics information providers. The second one is the deficiency of the connections among the information network system. The third difficulty lies in the huge differences between the service levels of the information system among the logistics companies.
In order to overcome these problems, the Ministry of Maritime Affairs and Fisheries is going to set up a shipping and Port - Internet Data Center (SPIDC) by 2005. The feasibility of the system is being studied
by the Korea Maritime Institute. The construction of the integrated EDI network will include the utilization of XML (Extensible Markup Language), the introduction of an advanced logistics management system, including a cargo tracking system, the development of a standard program to connect the ASP (Application Service Provider) and ERP (Enterprise Resource Planning), and the adoption of the existing logistics information system, which has been used fragmentarily by the each of the private companies (see Table 2-16).
In the Russian Federation, the TRANSTELECOM Co. operates optical fibre telecommunication network of 52,000 km. Based on such telecommunication network the Russian Railways (RZD) created a unique information system, which allows real time checking of rolling stock at any of 6,000 railway stations of the Russian Federation. The telecommunication network of RZD is already connected to similar networks of China, Finland, Kazakhstan, Lithuania, Latvia, Mongolia and Ukraine, and provides grounds for common information space for international transport corridors passing through the territory of the Russian Federation.
Development of similar telecommunication networks for various modes of transport is also in progress: the telecommunication network for inland waterways is being formulated; all the major sea ports already use the telecommunication network served by TRANSTELECOM Co.; major airlines created their corporate networks covering subdivisions scattered all over the country; Road transporters formed their telecommunication network. However all these networks serving various transport modes of the transport system of the country are not yet integrated.
To improve information interchange between RZD and its customers a pilot project was launched to introduce electronic waybill (ETRAN). The system greatly simplified the application for transport procedures (terminals were established at more than 5,000 enterprises). An e-signature system with a special certifying centre is also being introduced by RZD and the next step will be for the whole transport system.
Table 2-16 Information system in the Republic of Korea
CHAPTER TWO: OVERVIEW OF TRANSPORT AND LOGISTICS IN NORTH-EAST ASIA 17
THREE: FORMULATION OF AN INTEGRATED INTERNATIONAL TRANSPORT AND LOGISTICS SYSTEM FOR
NORTH-EAST ASIA
3.1. MAIN PRINCIPLES OF FORMULATIONS OF THE INTEGRATED TRANSPORT AND LOGISTICS NETWORK
3.1.1 Main principles of network formulation
As the network is to provide reliable and efficient intermodal international transport linkages in North-East Asia to facilitate international trade and tourism, its development objective should be to eventually provide a choice of alternative competitive routes to any of major economic centers and ports in North-East Asia from any country of North-East Asia.
The availability of competitive routes will provide each country in North-East Asia with a degree of independence and a real choice in accessing expanding markets. It will also result in lower transport costs and an improved level of transport services.
The main principles of the system formulation are as follows:
a) Maximum possible use of the existing infrastructure.
b) Minimum possible number of routes with particular attention to any possible parallel routes as well as missing links.
c) The system should provide intermodal transport routes to major provincial cities/economic centers, including major railway stations with freight and container yards, inland water terminals, container terminals and airports in the following regions:
– Provinces of Heilongjang, Jilin, Liaoning and Nei Mongol of China – Democratic People’s Republic of Korea
– Japan – Mongolia
– Republic of Korea
– Far East/Primorsky Territory of Russian Federation – Tumen River Development Area (TRDA)
d) The system should also include access routes to the following port clusters:
– Dalian (Ports of Dalian, Dandong) – Tianjin
– Nampo
– Rajin (Ports of Rajin, Sonbong, Cheongjin) – Hakata (Ports of Hakata, Shimonoseki)
18
– Kobe (Ports of Kobe, Osaka) – Niigata (Pots of Niigatam Fushiki) – Tokyo (Ports of Tokyo, Yokohama) – Busan (Ports of Busan, Gwangyang) – Incheon
– Vladivostok (Ports of Vladivostok, Nakhodka, Vostochny) – Zarubino (Ports of Zarubino and Posjet)
e) The system should eventually meet the requirements of international traffic within the North-East Asian subregion, as well as between North-East Asia and other parts of the world.
f) The system should be designed primarily for efficient transport of ISO and non-ISO containers, which are the main containers used for international trade (Table 3-1).
Table 3-1 Dimensions of ISO and non ISO containers
3.1.2 Main components of the system
To ensure its reliability and efficiency, the transport and logistics system should integrate infrastructure and logistics components in the following composition.
Infrastructure components
• the main port clusters in North-East Asia
• intermodal land transport routes comprising priority road and rail routes in North-East Asia, major
CHAPTER THREE: FORMULATION OF AN INTEGRATED INTERNATIONAL TRANSPORT AND LOGISTICS SYSTEM 19