In the third chapter, I show that the estimated impact of free trade agreements on firm-level intra-bloc flows is sensitive to the selected empirical specification and measure of trade reform. In the third chapter, I examine the impact of the ASEAN-China Free Trade Agreement (ACFTA) in goods on firm-level intensive margin trade flows in the short run.
Introduction
Based on the standard model, importing inputs from underdeveloped regions will cause a marked decrease in product quality. Throughout the paper I focus on the cost complementarity mechanism as I am unable to isolate any potential home bias impacts.
The Data
Overview of Established Trends
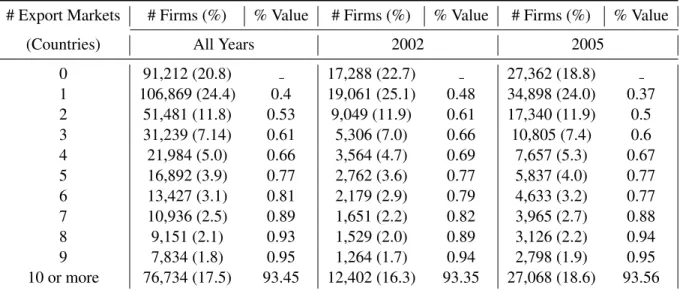
However, the 17% of firms exporting 10 or more products earned 69% of all export revenue in the sample. The number of firms in all three categories grew from 2002 to 2005, but the percentage of export value captured by firms producing 10 or more products actually fell over that period.

Stylized Findings
Export Patterns and Imported Intermediates Sourcing
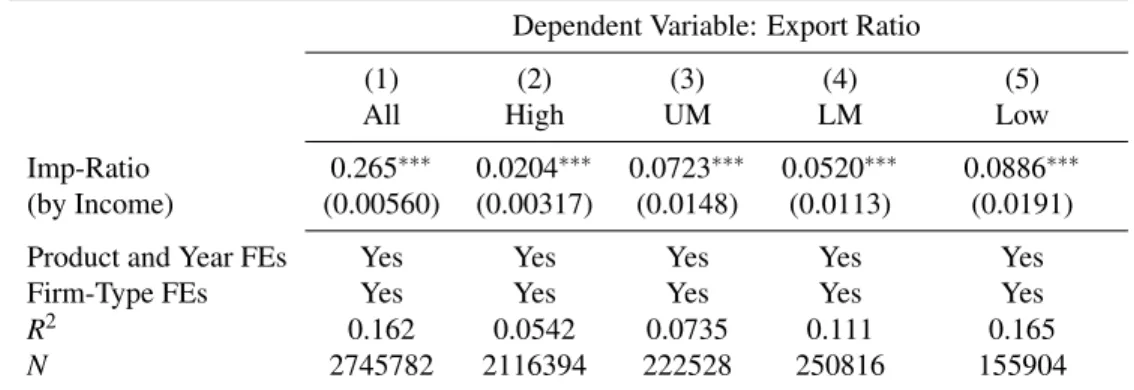
For the entire sample, I find that a percentage point increase in inexpratioffrom destination is associated with a 0.27 increase in inexpratiop from source. Column (2) shows that a percentage point increase in the North/South level is associated with a 0.08 percentage point increase in expratiope.

Theoretical Model
- Setup
- Demand
- Intermediate Sector
- Firm Behavior
- Partial Equilibrium
- Theoretical Insights
- Profits and Productivity Cutoffs
- Discussion
His choice of I determines the marginal cost of production—as shown by equation (1.5)—and the quality of the final good—as shown by equation (1.4). Export Cutoff– A frontier exporter does not import orders from the north and serves market j.
Measurement and Empirical Methodology
Baseline: Estimating Equation for Imported Input Sourcing
This includes the logarithm of wages, logarithm of firm size, logarithm of capital and TFP.
Endogeneity Concerns and Instruments
- Measurement
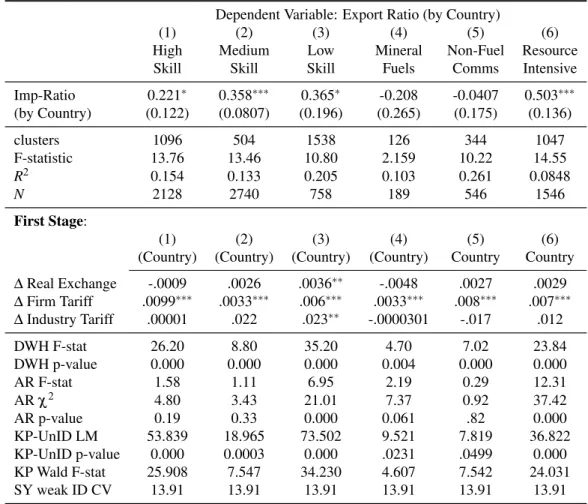
The theoretical model suggests that a reduction in the associated costs of obtaining imported inputs – due to a reduction in import tariffs or an appreciation of the real exchange rate – should induce firms to increase their use of imported intermediates at intensive margins and /or extensive. Therefore, I expect to see a negative relationship between the two measures of the cost of imported inputs and the use of imported intermediaries.
Main Findings
- Baseline Results
- Intermediate Input Sources and Heterogeneous Productivities
- Intermediate Input Sources and Scope for Differentiation
- Imported Intermediates and Firm Ownership
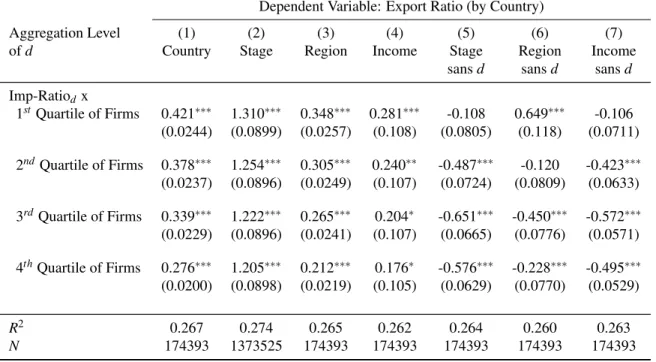
I obtained qualitatively similar results for the estimated coefficients of the share of imports at the North/South level, the regional level, and the income level, where an increase of one percentage point results in an increase of the share of exports of products from a given country by 0.29 percentage points and 0.29 percentage points, respectively (columns 2 , 3 and 4). Notes: This table examines the relationship between the firm-to-product export ratio and the country-level import ratio for products classified by UNCTAD's knowledge and technology composition.

Robustness Checks
Single-Product Exporters
- Single-Product Exporters and Country level IV regressions
- Single-Product Exporters and Scope for Differentiation
As with Table 1.8, I find that the share of net import from the respective country's contribution is negatively related to the output-export ratio. The analysis using the UNCTAD classification system with the data set for single-product firms is presented in Table 1.13.

BEC Classification
This returns the perverse results in Table 1.9 and clearly proves the assertion of the quality scale.55. This table examines the relationship between a firm's product-export ratio and country-level import ratio for products classified by UNCTAD skills and technological composition.
Conclusion
The results when input shares are constructed using the BEC group of inputs (Table 1.14) are almost identical to those presented in the baseline specification (Table 1.8). I take these predictions to the data by looking at the relationship between export shares at the firm-product-country level and import shares.
Appendix
- Constructing the dataset
- Optimal Profit
- Comparative Statics (φ )
- Comparative Statics (γ)
- Comparative Statics (t)
- Comparative Statics (λ )
Notes: This table categorizes the number and percentage of firms in the customs data by the number of products they export. Notes: This table categorizes the number and percentage of firms in customs data by the number of countries to which they export.
Introduction
I argue that these trends imply potentially large impacts of the CCFTA on Chilean labor markets and relative skill demand. Empirical identification of the effect of falling trade costs on improving skills and labor composition is based on the difference from changes in input and output tariffs between Chile and China over time and in ISIC four-digit industries.
Context and Background
Sectoral Changes in Chile
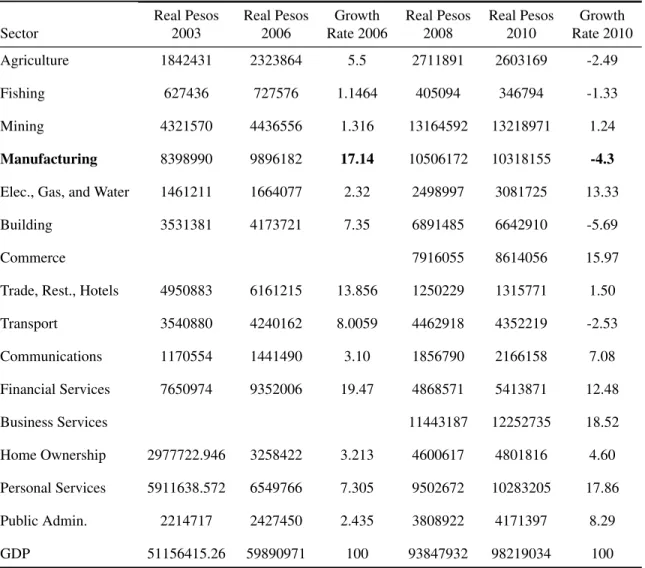
Categorized GDP statistics suggest that the boom in Chilean exports to China was mainly driven by the service and extractive sectors. In particular, how did the CCFTA affect the workforce composition and skill intensity within Chilean manufacturers.
Theory
- Demand
- Technology
- Firm Behavior
- Defining Productivity Cutoffs
- Labor Market
- Trade Liberalization
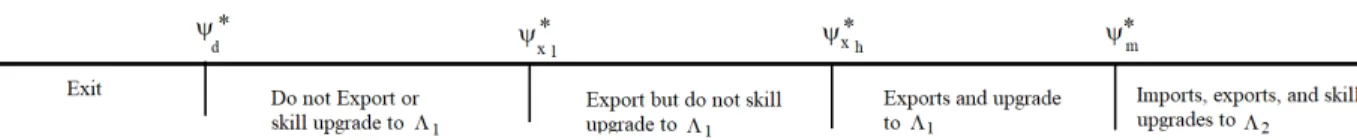
Export, No Upgrading – A marginal exporter does not use skill-based production techniques and is indifferent between selling abroad and just supplying the domestic market. Export, Upgrading – A frontier upgrader adopts skill-based production upgrading through export activities.
Data
Finally, the model predicts that the largest increase in relative skill demand will occur in the middle range of the productivity distribution, as the largest firms adopt upgraded technology prior to liberalization and the smallest firms exit as a result of increased competition from trade liberalization.
Measurement
Tariffs
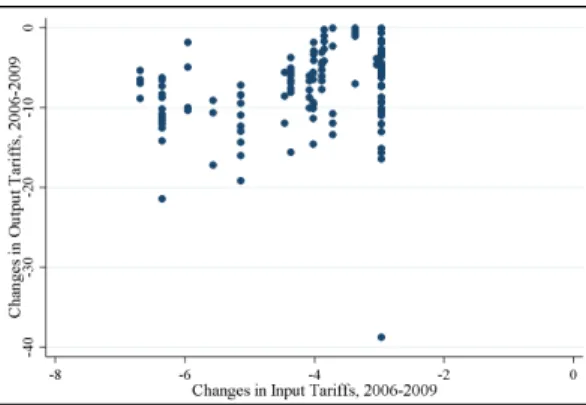
Unfortunately, since the input tariff variable is constructed at the 2-digit ISIC industry level, there is a relatively high correlation (.623) between changes in output tariffs and changes in input tariffs (see Figure 2.2). Despite this correlation, which is slightly higher than the rule of thumb correlation threshold (0.6), this study aims to isolate channels; identifying the separate effects of changes in input and output rates on the demand for skilled labor as suggested by the theoretical model.
Relative Skill Demand
Countries may have systematically offered large tariff reductions in industries that were already uncompetitive or unviable domestically. Furthermore, countries can offer smaller tariff reductions to industries that are inefficient but have political power.
Firm Quartiles
For example, within the category of nonproduction workers, managers, specialized technicians, and administrative staff may experience systematically different outcomes as a result of the CCFTA tariff changes.
Estimation Strategy
Thus, β2 should yield positive coefficients when changes in output rates are related to changes in total employment. Larger firms with a greater presence on the international scene can take advantage of real domestic labor locations toward more productive firms, thereby increasing their demand for workers in response to changes in production rates. 22.
Main Findings
- Effects of Tariffs on Skill Intensity
- Heterogeneous Effects of Tariff Changes on Employment
- Tariff Changes: Production vs Non-Production Workers
- Effects of Tariffs on Worker Groups
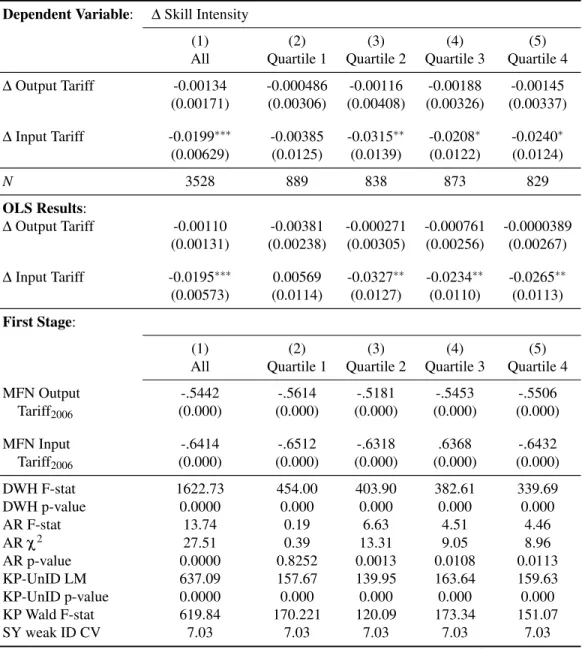
An average reduction in input tariffs leads to an increase in skill intensity of 0.15 percentage points for firms in the second quartile of the distribution. I expect that cuts in production rates will be accompanied by a decline in the size of the labor force.
Robustness and Extensions
Accounting for Import/Export Intensity
The average effect of an average reduction in input tariffs increases skill intensity by 0.17 percentage points in non-importing firms. An average reduction in input tariffs leads to a 0.28 percentage point increase in skill intensity for non-importing firms in the second quartile of the distribution.
The Effect of Tariff Changes on Sales
Again, I find evidence of differential results for import firms in the second quartile that increased skill intensity by 0.18 percentage points in response to an input tariff cut. More specifically, if skill upgrading is based on intensive margin flows in international markets and imported intermediate products are relatively more complementary with unskilled workers, then importing firms should increase skill intensity at a slower rate.
Effects of Tariffs on Skill Premia
However, this decrease was smallest among firms in the fourth quartile and increased monotonically as firm productivity declined. The most likely explanation is that there is no relationship between tariff cuts in the manufacturing sector and the economy-wide wage premium.
Conclusion
The wage and skills premium can be dictated by growth industries such as mining and other extractive sectors. The wage and skills premium may be more closely related to changes in growth industries such as mining and other extractive industries.
Appendix
Notes: This table examines sectoral contributions and their growth rates relative to GDP from 2003 to 2006 and from 2008 to 2010. Notes: This table examines the relationship between tariff cuts and the wage-skills premium.
Introduction
First, I examine the firm's short-term intensive margin adjustments to ACFTA for goods. Some studies argue that countries are motivated to enter into trade agreements based on initial economic structure (Burfisher et al., 2001), inactive or “slow multilateralism” (Krugman Bhagwati, 2008; Missios et al., 2016), idiosyncratic events – such as the dissolution of the USSR (Lester and Mercurio, 2009) and the Asian crisis of 1997 (Harvie et al., 2006) – the search for geopolitical stability (Mansfield and Pevehouse, 2000; Vicard, 2008) and free trade agreements contagion/interdependence (Baldwin , 1993; Baldwin and Jaimovich, 2012; Solis et al., 2009).7 The third insight relates to the use of panel data methods to obtain unbiased parameter estimates.8,9 Plausible estimates of the average effect of preferential rates on a bilateral power can be obtained using mean-differentiated panel data with country-and-time effects (Baier and Bergstand, 2007; Baier et al., 2014; Yang and Martinez-Zarzoso.
ASEAN-China Free Trade Agreement
Background
In November 2002, China and ASEAN signed the Framework Agreement on China-ASEAN Comprehensive Economic Cooperation. China and ASEAN considered these agreements and the period between 2002 to 2009 as transitory before the completion of the ASEAN-China Free Trade Area.19.
Discussion
Finally, the Agreement on Trade in Goods (2004) characterized products as either “Normal Track” or “Sensitive Track”.20 From a political economy perspective, countries can protect certain industries from tariffs that face significantly below the MFN level. become This indicates endogeneity of this regional agreement and the mismeasurement associated with the use of dummy variables to capture trade policy.
The Data
Overview of Established Trends
In general, the relationship between number of firms and number of export destinations is negative; suggesting that there may be substantial heterogeneity in country-level fixed costs of exporting across countries.25 Going beyond the broad non-importer vs. importer analysis, there is considerable variation in relative size of export markets across firms. However, firms exporting 10 or more products earned more than 65% of all export revenues in the sample.
Descriptive Statistics
These growth rates are shown in parentheses next to the participation growth rates in the analysis at the business product country level. However, the growth rates of export participation at the level of the enterprises (135.51%) and the products in the fixed product country (117.93%) were significantly lower than preferential FTA members and non-ASEAN partners.

Empirical Methodology
Baseline: Estimating Equation for FTA and Flow Complementarity
Cost complementarity models make the additional prediction that firms should have a positive correlation between where they import intermediate goods from and where they export goods. Exportsf j pt (ie, the share of revenue from the sale of a product in a particular country divided by the total export revenue from the sale of the product worldwide).
Endogeneity Concerns
Under this assumption, the step-down process in the fixed effects model eliminates these potential sources of endogeneity as it allows me to control for all deterministic, time-invariant effects, such as distance, contiguity, regional preferences and institutional differences.31 The inclusion this year. Second, dummies are suppressed by the country-time fixed effects that make policy analysis impossible.
Pitfalls of Using Dummies to Measure the Impact of Trade Reform
That is, if the dependent variable (Λf jt) is the firm's export revenue earned from country j, Λ0f jt is the value of imports the firm purchases from country j. The only difference is that the Complementarity Vector uses Λ0share to capture the share of a firm's trade flow with a particular country relative to that flow internationally.
Main Findings
Baseline Results
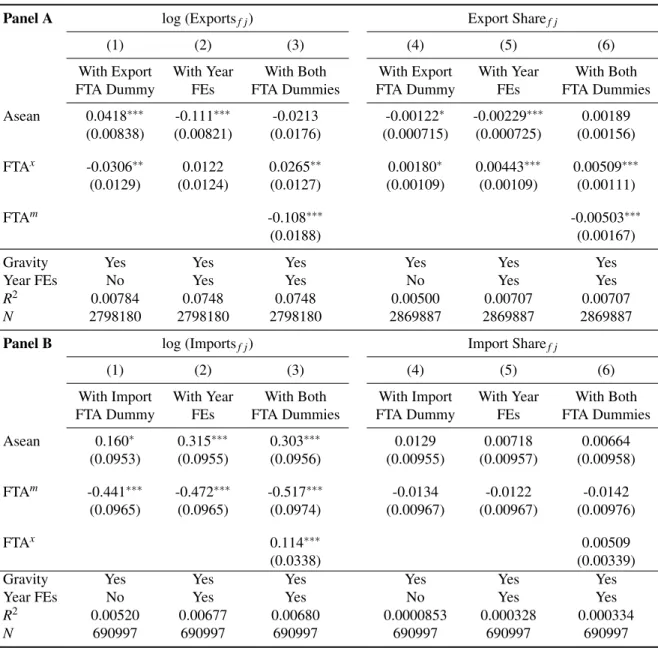
I believe that a 10 percentage point reduction in tariffs is associated with a 0.08% increase in imports from a given country. Panel B presents the results when the product import share from a given country is the dependent variable.
Scope for Product Differentiation
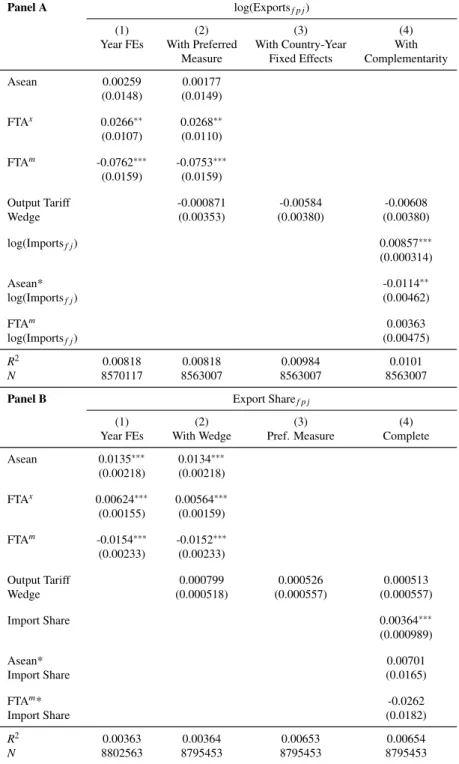
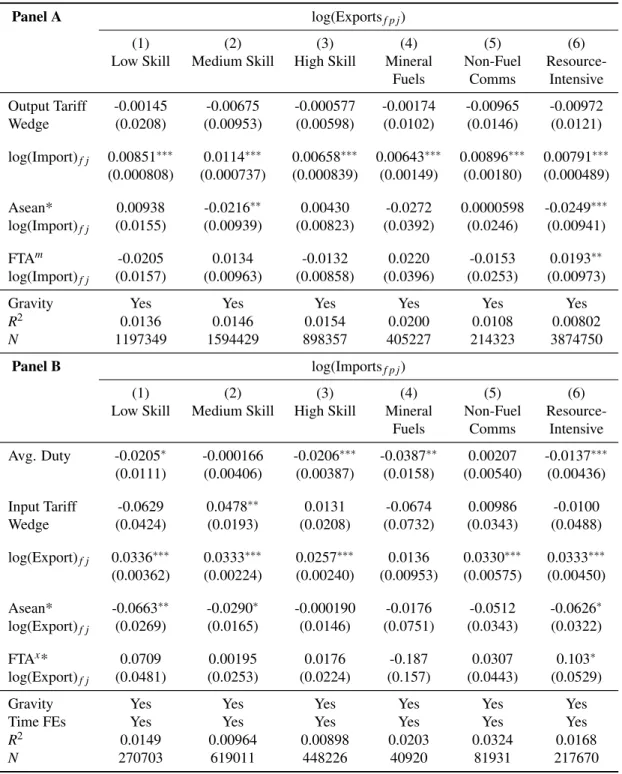
The estimate for the firm's complementary trade flow, exports, is stable in all specifications, except for mineral fuels. The evidence suggests that preferential reductions in production tariffs had no significant impact on the firm's intra-bloc exports.
Firm Ownership
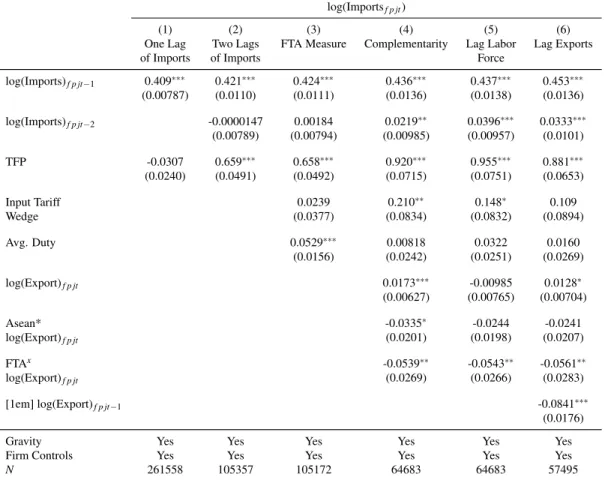
All regressions include gravity controls, country-and-year fixed effects and robust standard errors (presented in parentheses).∗p<0.1,∗∗p<0.05,∗∗∗p<0.01. I think that the complementarity in trade flows is positive and significant across all organizational structures.

Robustness Checks
FTAs, Flow Complementarity, and Time-Varying Firm Characteristics . 147
The main variable of interest, Input Tari f f Wedge, is not significant for any specification, which challenges the strength of the association between preferential import liberalization and firm-level flows. The negative and insignificant coefficient for the trade policy variable is likely a function of the truncated sample.
Accounting for “Phased-in” FTAs and Lagged Terms-of-Trade Effects . 149
If the ACFTA exhibits strict exogeneity, current trade flows should be uncorrelated with future preferential tariff reductions. On the other hand, I find that input tariff reductions had a positive impact on import flows to ASEAN countries that received preferential tariffs from China.
Appendix
Trade Liberalization and the Evolution of Skild Earnings Differentials in Brazil” Journal of International Economics. Productivity and the Decision to Import and Export: Theory and Evidence" Journal of International Economics.
Export Performance of Importers vs Non-Importers: Customs Data
Price Changes of Importers and Non-Importers: Differentiated vs Homogenous
North vs South: OLS Regressions of Export Ratio on Import Ratio
Income Quartiles: OLS Regressions of Export Ratio on Import Ratio
Regional Outcomes: OLS Regressions of Export Ratio on Import Ratio
Country-Level Outcomes: OLS Regressions of Export Ratio on Import Ratio
Quality vs Cost Complementarities: OLS Regressions of Export Ratio on Import
Country: IV Regressions of Export Ratio on Import Ratio
Heterogeneous Effects: Regressions of Export Ratio on Import Ratio
Scope for Differentiation: IV Regressions of Export Ratio on Import Ratio
Ownership Characteristics: Regressions of Export Ratio on Import Ratio
Single Sector Firm-Product Exporters: IV Regressions of Export Ratio on Import
Scope for Differentiation: Single Sector Exporters
BEC Imports: IV Regressions of Export Ratio on Import Ratio
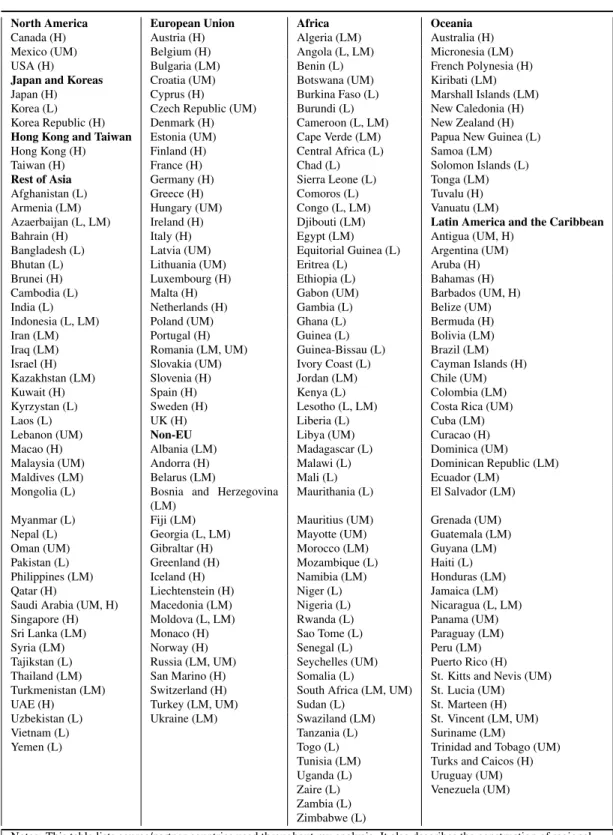
Country List
Number of Products Exported- Customs Data
Number of Export Partners- Customs Data
Heterogeneous Effects– Skill Intensity and Tariffs
Heterogeneous Effects– Employment and Tariffs
Compositional Changes– Production vs Non Production Workers
Tariff Changes and Disaggregated Worker Groups
Latin America: Notable Trade Agreements 2002-2010
Latin America: Within- and Across- Country Export Growth
Chilean GDP: Sectoral Breakdown
Robustness– Skill Intensity and Tariffs
Extension– Tariff Changes and Firm Revenue
Extension– Tariff Changes and the Wage-Skill Premium
Firm Participation in International Markets 2002-2006
Firm-Country Flows and Dummy Variables for Trade Reform
FE Estimates– Firm-Product-Country Flows and ACFTA Rates, 2002-2006
FE Estimates– Firm-Product-Country Flows and ACFTA Rates, 2002-2006
Product Scope– Preferential Rates and Firm-Product-Country Flows, 2002-2006
Ownership– Preferential Rates and Firm-Product-Country Flows, 2002-2006
ACFTA and Imports: Time-Varying Firm Characteristics
Dynamic Panel Methods: Arellano-Bover/ Blundell-Bond Estimates and Imports . 153
Number of Firms vs Number of Export Destinations 2002-2005
Export Sales Premia and Number of Import Source 2002-2005
International Participation and Skill Upgrading Choices
Correlation between Changes in Output Tariffs and Input Tariffs
Output Tariff Changes vs Initial Tariff Level
Chilean Trade Flows from 2003-2010 by Sector and Trade Partner