Archer and Radhika Krishnamurthy Essentials of Neuropsychological Assessment by Nancy Hebben and William Milberg Essentials of Behavioral Assessment by Michael C. In the Essentials of Psychological Assessment series we have attempted to provide the reader with books that will deliver key practical information in the most effective and approachable style. Topics are targeted for easy understanding of the essentials of administration, scoring, interpretation and clinical application.
Brief Intelligence Tests
INTRODUCTION AND OVERVIEW OF THE USES OF BRIEF INTELLIGENCE TESTS
Here we define a brief intelligence test as a rapidly administered test that provides information on global aspects of intelligence but is relatively narrowly scored. The question of why one would prefer a short intelligence test over a more comprehensive measure is certainly an important and compelling one. Many brief intelligence tests do measure intelligence well, despite our warning that they should not be used to diagnose cognitive impairment if they meet our criteria outlined in Quick Reference Guide 1.1.
DON’T FORGET
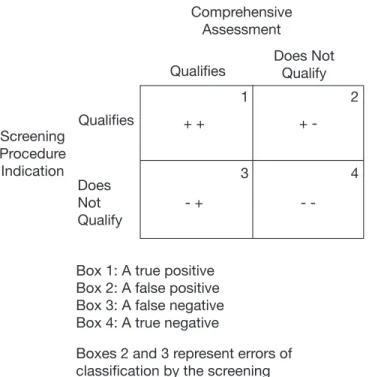
Sensitivity of assessment refers to. a) the examiner's ability to relate to the examinee. Specific city in assessment refers to. a) the examiner's ability to relate to the examinee. Short IQ tests are useful in which of the following: (Check all that apply). a) Estimation of IQ of psychiatric referrals.
KAUFMAN BRIEF INTELLIGENCE TEST–SECOND EDITION (KBIT- 2)
Interpret the IQ Composite
If there is a significant difference between the KBIT-2 verbal and nonverbal standard scores, the Composite IQ should not be interpreted as a meaningful representation of the individual's overall performance. The second step in interpreting the KBIT-2 is to calculate the magnitude of the difference between verbal and nonverbal standard scores. To assist the examiner with this process, a Score Comparison section is included at the bottom of the first page of the registration form.
Are the Verbal SS Versus the Nonverbal SS Signifi cantly Different?
If no significant difference in the verbal and nonverbal standard score is found, assume that the individual's overall verbal and nonverbal skills are developed evenly and that additional steps of KBIT-2 interpretation are not necessary. If a significant difference is found, go to step 3 to determine if the difference between the verbal and nonverbal standard scores is meaningful. For a discrepancy between the verbal and nonverbal standard scores to be meaningful, the difference must be rare or occur in a relatively small percentage of individuals.
Is the Verbal Versus Nonverbal SS Difference Unusually Large?
For these purposes, Table B.8 in the KBIT-2 Manual (Kaufman and Kaufman, 2004b) provides norms for these two subtests using scaled scores (mean of 10, standard deviation of 3). Tables are provided in the KBIT-2 manual to indicate verbal SS and nonverbal SS differences required for meaning. When might it be useful to determine the scaled score for the Verbal Knowledge and/or Puzzles subtests. a) when any of the subtests cannot be administered.
THE REYNOLDS INTELLECTUAL SCREENING TEST (RIST)
The user qualifications for the RIST are not as strict as those for the parent scale – the RIAS – when used exclusively for screening. STANDARDIZATION AND PSYCHOMETRIC PROPERTIES The RIST manual provides many details on the standardization of the test. It also provides extensive information on item development and subsequent psychometric properties of the RIST.
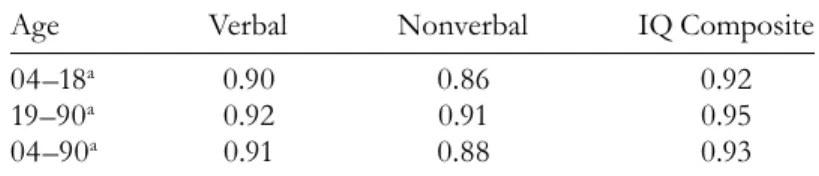
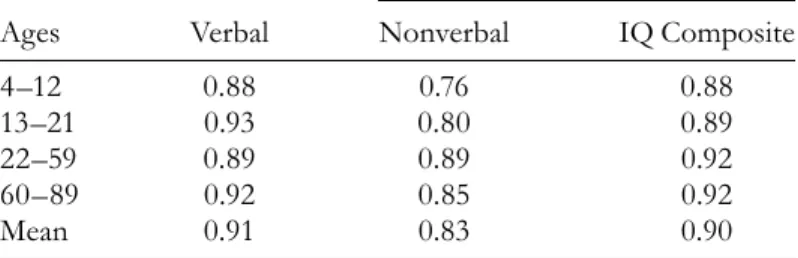
Reliability of RIST Scores Internal consistency reliability estimates for the RIST subtests are quite high. The median internal consistency reliability coefficients for the RIST subtest and composite scores across age are .90 or higher. Furthermore, uncorrected (ru) and corrected (C-ru) stability coefficients of .80 and .84, respectively, were obtained for the RIST composite.
The RIST registration form is a great help to Table 3.5 RIST Composite Index Scores for Miscellaneous. Once the subjects are administered, testing begins with the age-specific item as indicated on the RIST Record Form. Enter the examinee's score for a first response by circling either 0 or 2 in the field provided on the RIST Record Form for each test item.
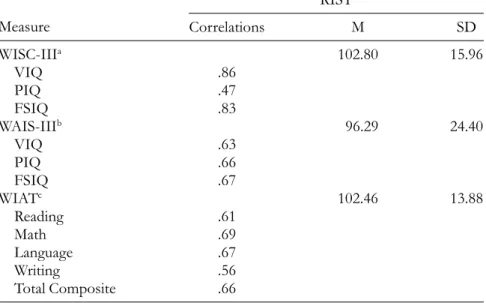
The composite RIST index consistently correlates with academic achievement test scores in the range of approx.
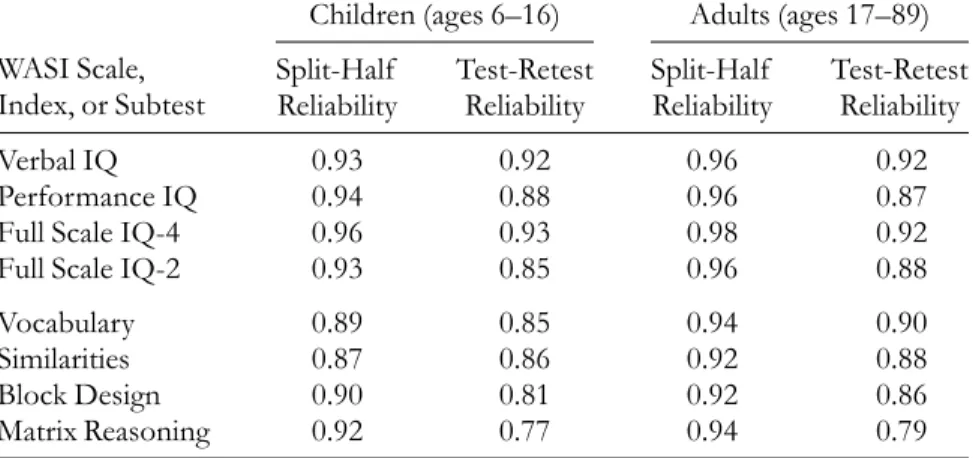
WECHSLER ABBREVIATED SCALE OF INTELLIGENCE (WASI)
Interpret the Full Scale IQ
If there is a significant difference between verbal IQ and performance IQ on the WASI, full-scale IQ should not be interpreted as a meaningful representation of the individual's overall performance. Like all Wechsler measures, the next level of global scores below full-scale IQ includes verbal IQ and performance IQ. The next step in WASI interpretation is to calculate the magnitude of the difference between Verbal IQ and Performance IQ.
The direction of the discrepancy does not matter, but whether the difference is statistically significant is important. The differences between WASI VIQ and PIQ scores required for statistical significance are presented in Table B.3 (p. 198) of the WASI manual.
Is the Verbal IQ Versus the Performance IQ Difference Signifi cantly Different?
A more conservative confidence level increases the likelihood that the difference is "true" and not due to chance. If no significant discrepancy is found between Verbal IQ and Performance IQ, you may assume that the subject's overall verbal and nonverbal skills are equally developed and that additional steps in the WASI interpretation are not necessary. If the difference score is equal to or greater than the critical value, it is statistically significant at that particular level of confidence.
If there is a significant difference between the VIQ and the PIQ in either direction (VIQ > PIQ or PIQ > VIQ), the full-scale IQ-4 is not the best estimate of the child's or adult's cognitive function and should not be interpreted as meaningful representation of the individual's overall performance. If a significant difference is found, proceed to the next interpretation step to assess whether the difference between VIQ and PIQ is complete. In step 2, we determined whether the difference between verbal and performance IQs was large enough to be clinically significant.
For a Verbal IQ-Performance IQ difference to be meaningful, it must occur in a relatively small percentage of individuals. In the WASI standardization sample, about 50 percent of the adult sample achieved VIQ and PIQ score differences of 8 to 9 points, while 25 percent achieved VIQ. But just because a person has scored significantly higher or lower on one of the IQs does not mean that his or her abilities are rare or abnormal.
How often the discrepancy occurs in the normal population is presented in Table B.4 (p. 199) of the WASI manual.
Are the Verbal IQ versus the Performance IQ Differences Abnormally Large?
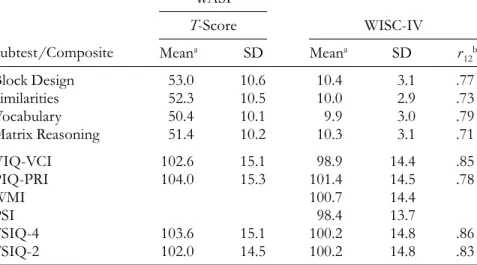
For examinees experienced with other Wechsler instruments, the WASI subtests are familiar and easy to use. There is not a theoretical explanation in the WASI manual to justify using lower start and stop points for individuals 45 through 89 on the Matrix Reasoning subtest. The WASI is linked to the WISC-III and WAIS-III and provides tables for estimating IQ ranges for these measures.
The WASI manual provides tables indicating the differences between the VIQ and the PIQ required for significance when the four-subtest version is administered. Verbal or executive IQ cannot be obtained when the two-subtest version of the WASI is administered. The results suggest that the WASI may serve as an adequate short instrument for screening individuals who are cognitively gifted.
5 According to the WASI Manual (Psychological Corporation, 1999), raw scores are converted to T-scores instead of scaled scores for the following reason: The moderate correlations found between the WASI and the WISC-IV, WAIS-III, and the WIAT provide support. Sarah, age 10, is administered the WASI version with four subtests and received a raw score of zero on the Vocabulary subtest.
You analyzed Shan's test scores on the two-subtest version of the WASI test, and there is a 40-point difference between his verbal scores and his matrix thinking T-scores.
THE WIDE RANGE INTELLIGENCE TEST (WRIT)
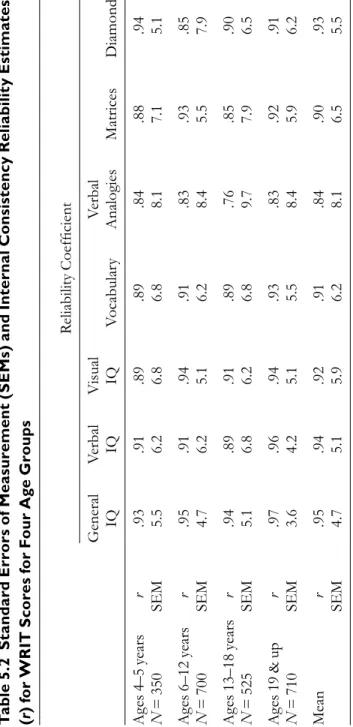
Data in the WRIT Manual (Glutting et al., 2000) highlight the correlations with the WISC-III and WAIS-III. STANDARDIZATION AND PSYCHOMETRIC PROPERTIES The following is a summary of the information in the WRIT manual regarding its standardization and psychometric properties. Always be familiar with the main descriptions of the WRIT's features, as described in the manual.
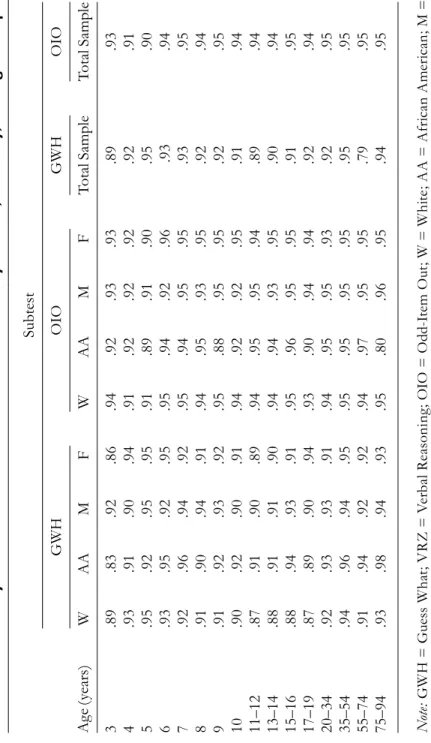
The WRIT subtests are administered in the following order: Matrices, Verbal Analogies, Diamonds, and Vocabulary. All WRIT subtests have age-specific starting points accompanied by specific basal and ceiling rules. Factor analytic evidence strongly supports the structure of the WRIT across age, gender, ethnicity, and educational attainment.
Correct answers are not listed on the examiner's record form, but appear on page 19 of the WRIT manual (Glutting et al., 2000). Diamonds is the most difficult of the WRIT subtests to administer accurately and will require the most practice. All WRIT IQs are scaled to the well-known IQ metric of a mean of 100 and SD of 15.
The mean internal consistency reliability coefficient for each of the WRIT subtests is best described as being.
SAMPLE EVALUATIONS USING BRIEF INTELLIGENCE TESTS
Altieri, Ashley is considered one of the brightest students in the third grade. Overall, the results of the evaluation are considered to be an accurate reflection of Ashley's current level of functioning. In the References section of the report, you should include all of the following except.
There is no need to document previous diagnoses in the Referral section of the report because this information may bias the audience's interpretation of test results. Which of the following should be included in the background section of a case report. a) subject's level of cooperation during testing (b) developmental history. In the Summary and Conclusions section of the report, it is appropriate to mention information that has not yet been discussed.
The validity of the Wechsler Abbreviated Scale of Intelligence and other very brief forms of estimation of intellectual functioning. Concurrent validity of the Wechsler Abbreviated Scale of Intelligence and the Kaufman Brief Intelligence Test among psychiatric inpatients. Exploratory factor analysis of the Wechsler Abbreviated Scale of Intelligence (WASI) in adult standardization and clinical samples.
Methodological issues in the clinical evaluation of two- and four-subtest short forms of the WAIS-R. It also has informative discussions of the various effects of aging on various aspects of intelligence. The authors also present a discussion of the major controversies surrounding the use of fitness measures in.