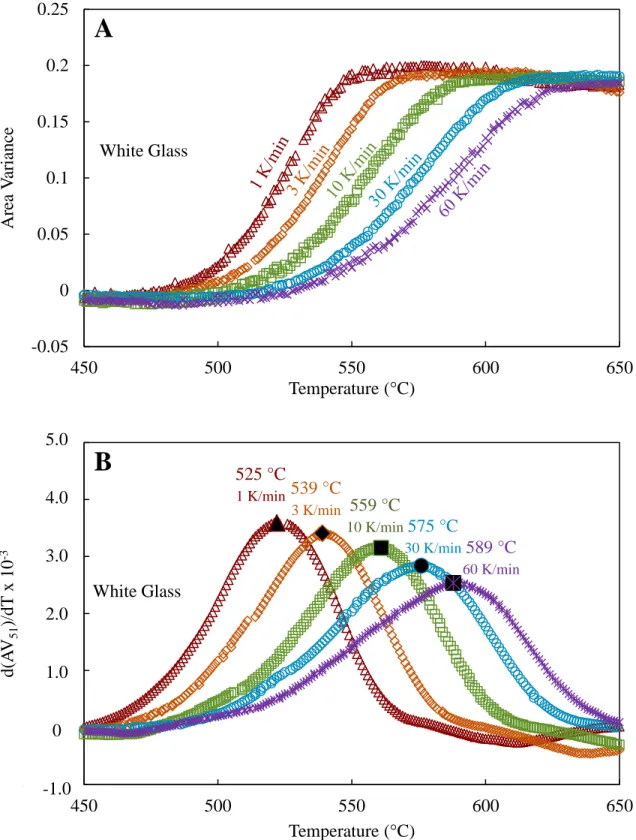
53 Figure 28. A) Area variance (normalized by the initial height of the sample) as a function of temperature normalized to the glass transition temperature for blue, white and borosilicate glass heated at 3 K/min. Approximate area under the curve for logarithmic time as a function of heating rate for borosilicate glass (green triangles), blue glass (blue circles) and white glass (gray squares).
Introduction to Sintering
Processes and Mechanisms
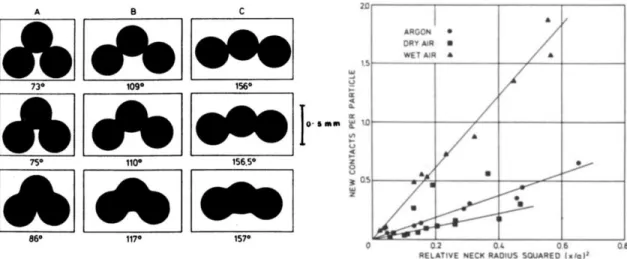
During the initial phase, neighboring particles form necks, which improves connectivity but slightly increases density.18-19, 24 Pores in the initial phase are interconnected and open. In the final stage of sintering, the pores are isolated or closed and the solid phase is completely connected.
Glass Sintering Stages and Classical Theories
Viscous Flow Definition and Initial Stage Sintering
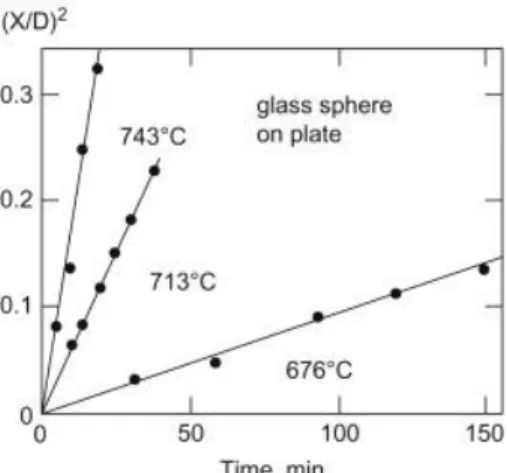
The meniscus at the contact of the spheres creates a compressive capillary force that pulls the centers together. Viscous deformation (change in shape due to viscous flow) occurs due to two combined pressures; (1) from the curvature of the neck and (2) from the curvature of the spherical surface.
Intermediate Stage
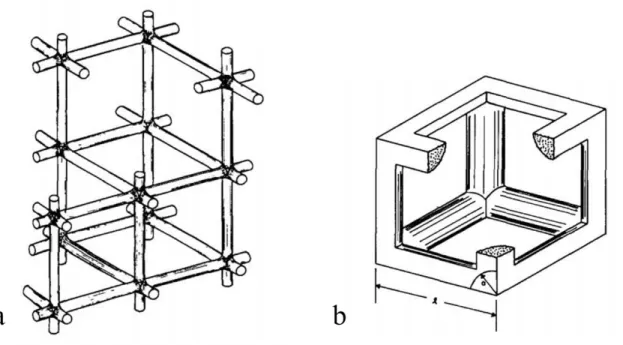
The ratio of the length of a cylinder to its radius corresponds to the ratio of pore size to particle size, and the relationship between a/l and relative density becomes. Theoretically, this is the end of the intermediate sintering phase because the pores are closed.
Final Stage
Bingham solids have a rate of shear stress proportional to the difference between the applied shear stress and the critical shear stress.4 The rate at which the pore radius, r1, decreases when pressure is applied internally (2γ/r1). pore can be calculated so that the energy dissipated by the current is equal to the work done by the surface tension. The process is treated as if it were steady because the kinetic energy of the material is assumed to be negligibly small.
Limitations of Classical Models
Non-isothermal Sintering
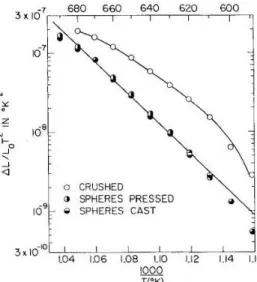
Differential shrinkage with respect to temperature, divided by the shrinkage, and multiplied by temperature squared, plotted against reciprocal temperature, multiplied by 1000, is suggested to yield a constant slope value of the activation energy divided by the gas constant, R, at each temperature. 32 Figure 9 is an example of this plot. Similarly, activation energy was determined by comparing the temperatures at which equivalent shrinkages are observed for different heating rates.32-36 Karamanov et al.33 use an analytical technique based on the theory that viscous flow densification exhibits a linear shrinkage related to the activation . energy for sintering, Esin, according to the equation.
Particle Shape and Size
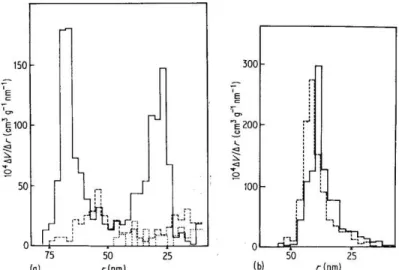
Particle shape will affect the particle packing and pore size distribution, even for powders with the same particle size distribution, thus ultimately affecting the sintering kinetics. Randomly oriented monodispersed powders showed a bimodal pore size distribution (Figure 13a), while polydispersed powders exhibited a more normal pore size distribution (Figure 13b). However, with heating, the average pore size increased, and the distribution skewed towards larger pores.
Shimohira concluded that average pore size reduction is more favorable in compacts consisting of particles of the same size, and multiple particle sizes will increase the average pore size due to the variation in decreasing center-to-center distances.
Viscosity and the Glass Transition
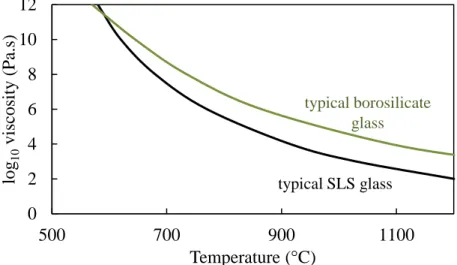
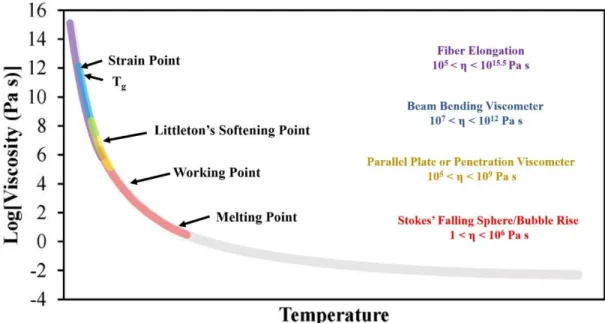
Introduction to Glass Viscosity
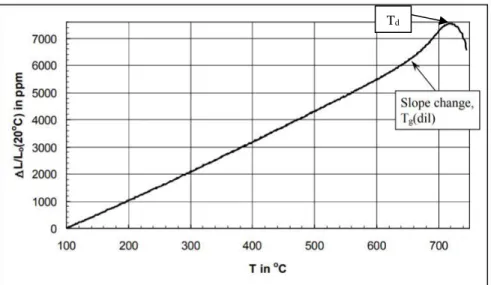
Throughout the forming process, the industry requires extremely precise control of glass viscosity to generate sufficient throughput for high-quality, replicable product yields.56 The. The dilatometric softening point, Td, (or in some cases Tsoft) is not included in the viscosity-temperature graph, as it is not exactly a viscosity-specific temperature. Td can occur over wider viscosity ranges than other characteristic temperatures and is reported to occur over a viscosity range of 108-1010 Pa s.56,58 Td is important when considering thermal expansion, and so can be obtained during dilatometry if the temperature where the glass sample reaches its maximum length during heating, as shown in Figure 16.
The glass transition temperature, more appropriately called the glass transition region, has an average viscosity of 1011.3 Pa s for ordinary glasses, according to Moynihan.61 However, this region often occurs at viscosities of 1012 Pa s.56 The glass sintering viscosity is said to occur between the glass transition temperature and softening temperature.
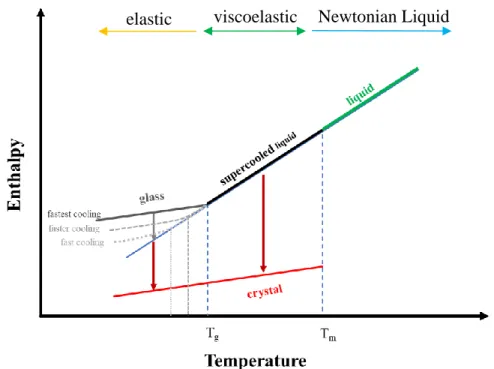
Glass Transition
However, these measurement techniques are reported to determine 'radically' different quantities for Tg.65 The coefficient of thermal expansion (CTE) is the temperature coefficient of the length of the sample, while heat capacity is the temperature coefficient of the enthalpy of the sample. . As the temperature increases, the expansion curve hooks downward, as seen in Figure 16, due to the softening of the sample causing the penetration of the push rods into the material or the sample sinking by gravity as the viscosity approximately 109-1010 Pa.s . Any measurement of Tg is composition dependent, but can also be influenced by heating rate (and cooling rate when measuring enthalpy and heat capacity) and thermal history (fictitious temperature) of the glass.56, 61 Faster heating rates can cause an increase in apparent glass transition temperature .
Optical dilatometers are claimed to have significantly higher accuracy than equivalent measurements from thermal microscopy due to the camera quality.
Viscosity-Temperature Relation and Models
Optical dilatometers are non-contact and have the potential not only to measure the glass transition point, but also the fictitious temperature and activation energy of the viscous flow of compressed powder samples, according to Karamanov et al.35 The optical dilatometer measures the thermal expansion of the sample with two high-resolution cameras that capture tips of the sample. An example of this is the glass transition temperature Tg, which occurs at about 1012 Pa s for most glasses, but actual temperatures can vary by hundreds of degrees depending on the structure and stability of the glass lattice. Glass-forming melts typically exhibit Arren behavior at low viscosities (< 103 Pa s), but also within the glass transition range from 1013 to 109 Pa s.56 However, the temperature dependence of viscosity between these two regions is considered non-Arren because the activation energy for the viscous flow is much lower for the flowing melt compared to that in the transition region.
The Vogel-Fulcher-Tammann or VFT model, developed by three researchers independently at about the same time in history, used three appropriate parameters to accurately predict viscosities over ten orders of magnitude.57 Fulcher66 was the first to propose it equation published in 1925, which modified the Arrhenian expression with an appropriate parameter, T0, to account for the variability of the activation energy for viscous flow, and replaced ΔHη with a less defined variable, B and η0, with a constant A.56 . The logarithm of this modified The Arrhenian equation is.
Heating Microscopy
Origin and Capabilities
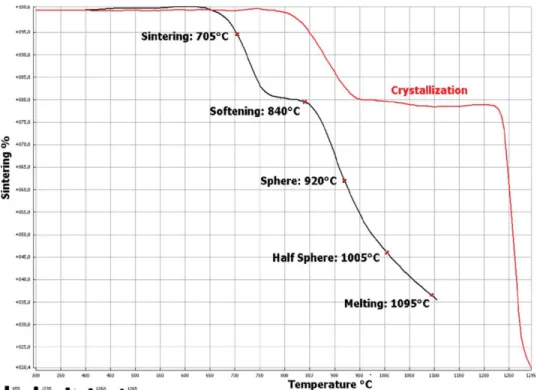
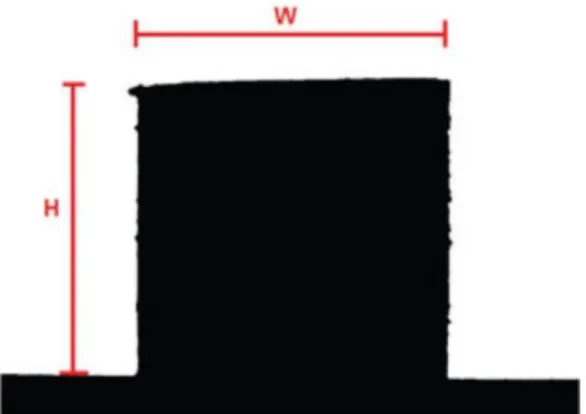
Images of the sample are acquired at predetermined time or temperature intervals during the heating cycle and dimensional parameters are automatically measured. Characteristic temperatures are provided during the test as the specimen progresses through each stage from initial shrinkage to the flow of the melt. The sample size is relatively small (about 3 mm x 2 mm) which ideally reduces the influence of a thermal gradient and the difference between the temperature recorded by the thermocouple and the temperature of the sample.
The manual suggests that "sintering temperature" occurs when the height of the sample decreases to 95% of the original sample, but can be adjusted by the user.
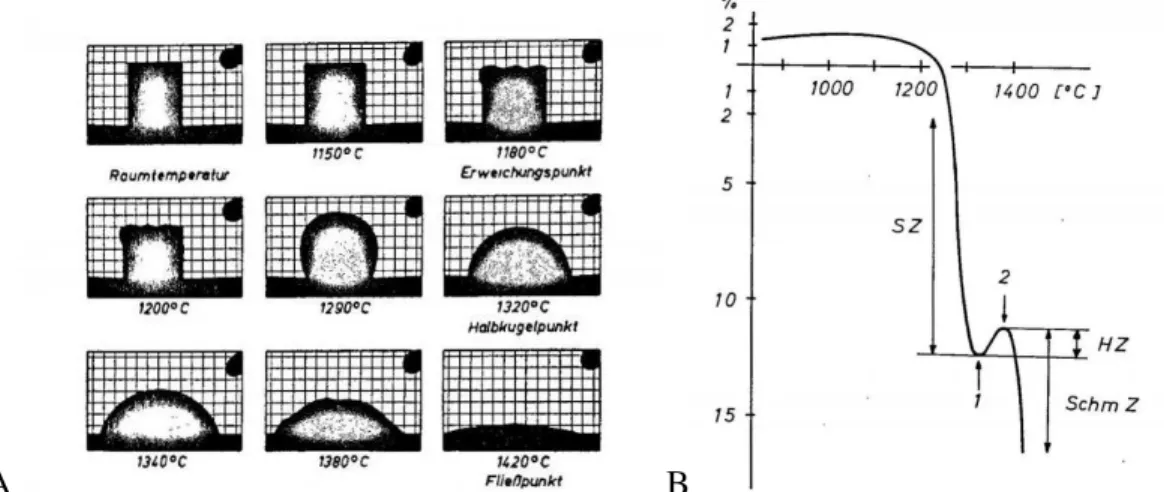
Characteristic Shapes and Corresponding Viscosities
Scholze determined the characteristic viscosities of silicate glasses using a heating microscope and established a correlation between conventional viscometry data in the viscosity range 109 -102 Pa∙s.* Determined viscosity points including the transformation point (1012 Pa∙s) point Littleton6 (106). ∙s) and the 'choking' point (potential leakage) Pa∙s) were used to calculate the constants of the VFT equation. The error in the viscosity ranges of the characteristic points in the silicate glasses was also evaluated. The log η values for each of the viscosity points can be obtained by substituting the temperatures for each characteristic point in the VFT curve.
However, several studies suggest that the temperatures corresponding to the characteristic viscosity points, especially for shrinkage, are strongly dependent on experimental conditions such as particle size and initial density.
Heat Transfer
The thermal diffusivity, κ, is equal to the thermal conductivity divided by the density and the specific heat capacity at constant pressure, so that.
Densification Investigation
Material Preparation
Property Characterization
Hot-stage Microscopy
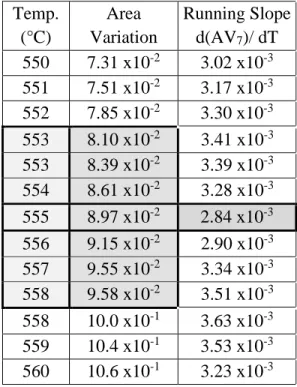
The peak sintering temperature, TPS, was calculated using a data smoothing technique in a spreadsheet (Microsoft Excel 2016 version bis, Redmond, WA) of the area variance data as a function of temperature, here defined as a running slope . An example of the data smoothing technique, as presented in Table III, calculates the slope of 7 data points. The role of the number of data points incorporated into the running slope function is demonstrated in Figure 21.
An example of the data smoothing technique used in the current study, using a 7-cycle run slope calculation.
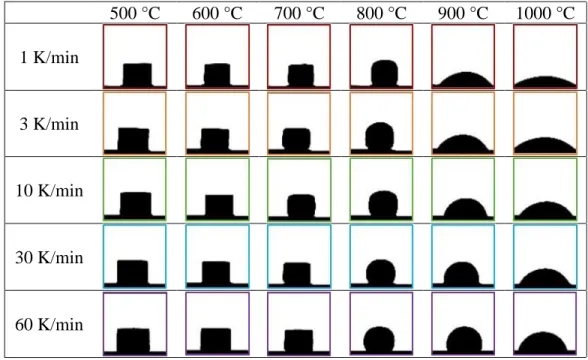
Influence of Heating Rate
The ratios between sintering temperature and glass transition temperature are similar for blue and white glass (Tg:TPS of 1:1.26 for blue and 1:1.31 for white), but the borosilicate glass has a significantly larger ratio of Tg:TPS: 1:1.48. The sintering temperatures of borosilicate glass appear to have a weaker dependence on heating rate than blue and white glass. Initial and maximum shrinkage temperatures and peak sintering temperatures as a function of heating rate for white, blue, and borosilicate glasses are shown in Figure 30.
Although these plots appear similar, it is clear that borosilicate glass behaves differently than the blue and maximum shrinkage temperatures when the slopes of the best-fit lines for initial shrinkage, TPS, and maximum shrinkage temperatures are plotted as a function of the y-intercept (normalized to Tg). white glass, as seen in Figure 31. Initial shrinkage temperature, peak sintering temperature, and maximum shrinkage temperature as a function of heating rate for A) white glass, B) blue glass, and C) borosilicate glass.
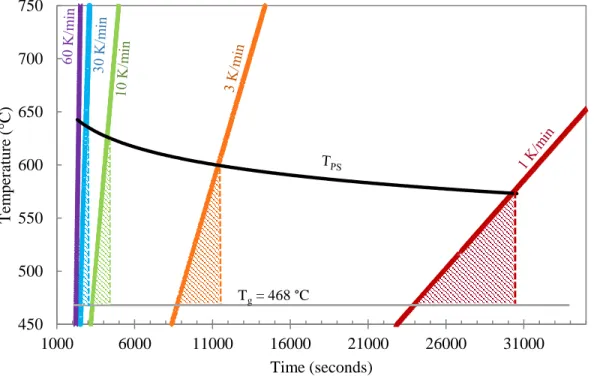
Heat Work
When time is plotted on a normal scale, the area of the triangles decreases as the heating rate increases. Correlation of the approximate area under the curve (calculated with normal time) with heating rate (K/sec) for the three glasses studied with both axes plotted on a log scale. The slope of the line is equal to the time it takes for the heat to reach the center (sec) times the heating rate (K/sec).
The thermal lag or temperature difference between the surface and the center of the compact (assuming a distance of 1 mm for heat to travel), for heat transfer ratios of and 0.001 mm/s for a constant heating rate of 60 K/min (1) K/ SEC).
Activation Energy
The activation energies for the maximum sintering temperatures for silicate glasses agree relatively well with published values for the sintering activation energy of silicate glasses.32-.
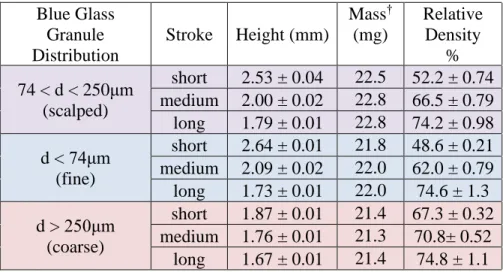
Influence of Pressed Density and Granule Size
The compaction ratio, CR, is the height of the fill (before compaction) divided by the height of the pressed compact. Sintering temperatures of the observed glass samples, heated to constant heating rates without residence time, were observed to increase with increasing heating rates. The comparisons of sintering behavior as a function of heating rate are only possible because of the similar initial densities within each data set and composition.
Starink, M., Determination of activation energy from linear heating rate experiments: comparison of the accuracy of isoconversion methods.