Looking at capacity, the renewable energy target of 45.2 GW by 2025 will not be met in the existing RUEN. In the realization scenario, electricity demand will decrease from 772 TWh in the existing RUEN to only 447 TWh in 2025. In addition, in 2050 new electricity demand will be 1,239 TWh, or more than 50% less than the projection in the existing RUEN.
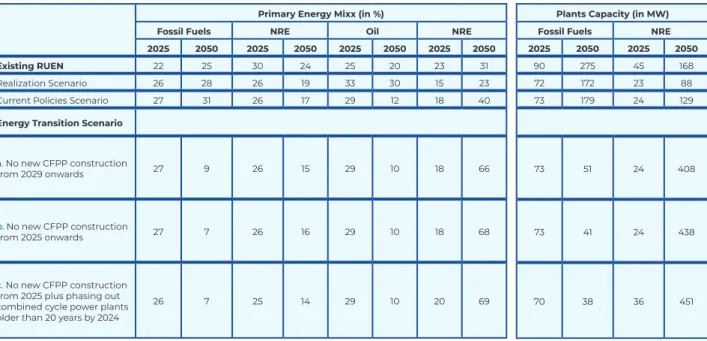
In the current policy scenario, the share of renewable energy in the primary energy mix increased due to the biodiesel program. In the energy transition scenario, the sooner the CFPP moratorium is applied, the greater the share of renewable energy in the primary energy mix, and the earlier the share of renewable energy surpasses fossil fuels. The share of renewable energy will surpass fossil in 2042, when the share of renewable energy in the primary energy mix reached 51%.
However, the biodiesel program alone is not sufficient to increase the share of renewable energy sources in the primary energy mix to more than 50%. CPO. In the energy transition scenario, the sooner the CFPP ban is applied, the greater the share of renewable energy sources in the primary energy mix, and the sooner the share of renewable energy sources surpasses fossil fuels. If we consider all three scenarios, the existing RUEN target of a 23% share of renewable energy in the primary energy mix and an installed capacity of 45 GW in 2025 will not be achieved.
However, in 2050 the energy transition scenario will far exceed the existing RUEN target, for both the renewable share in the primary energy mix and the total renewable installed capacity.
Basic Assumption
Gross Domestic Product (GDP) and Economic Growth
Industrial Sector
Energy Demand Structure
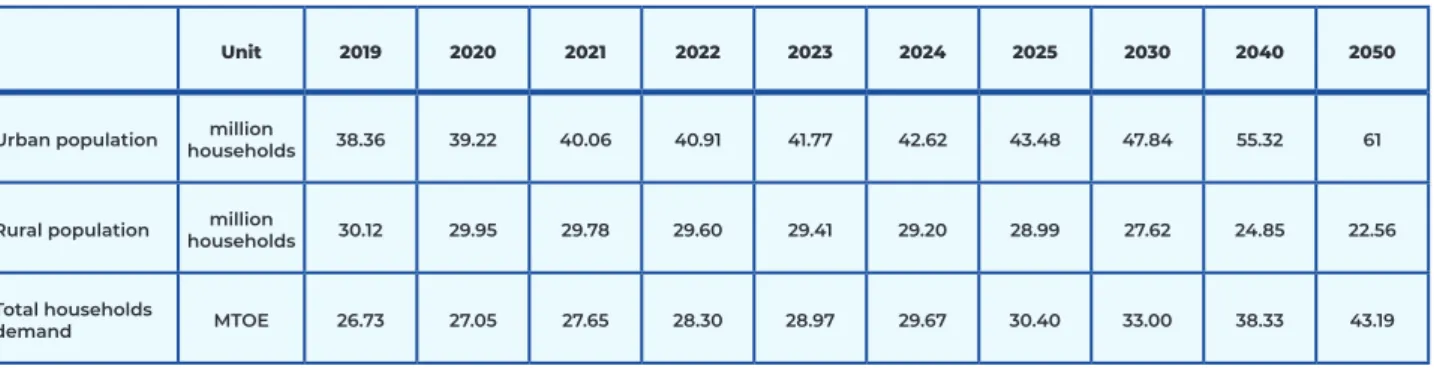
- Population Growth and Number of Households
- Transportation Sector
- Households Sector
- Commercial Sector
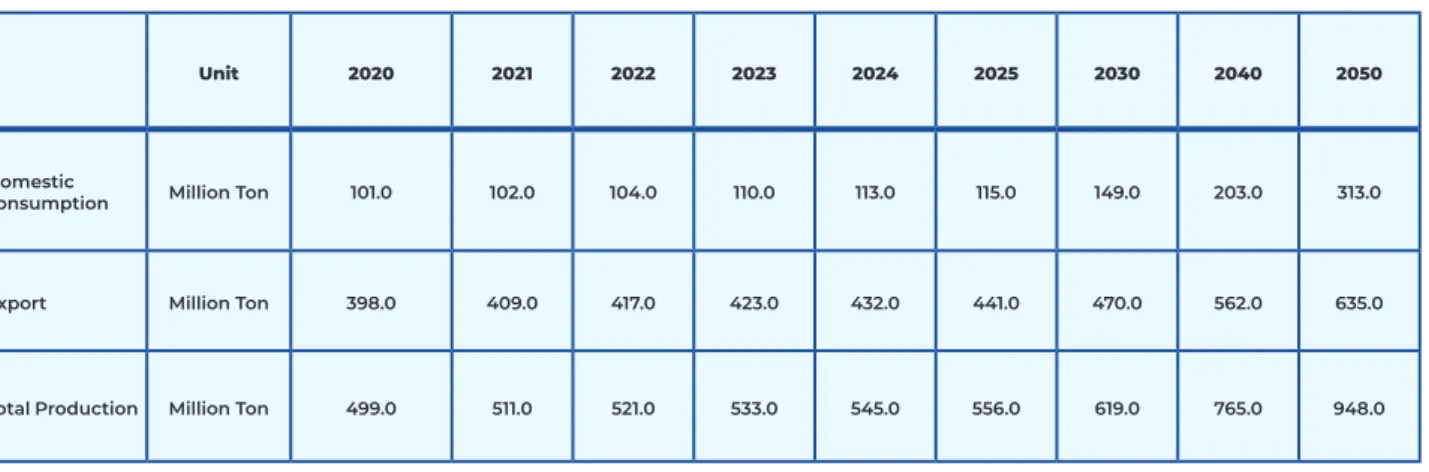
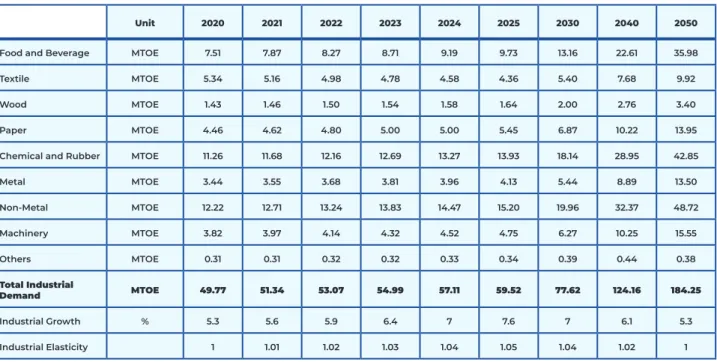
Source: adjustment of the existing RUEN data based on the industrial growth realization 2015-2018. Table 3 Updated industrial requirements in the new Indonesian energy model*. ferries) and air (passenger and cargo aircraft), including the fuels for each mode of transport. Looking at the 2016-2019 Indonesian statistics from BPS, the realization of the number of vehicles (i.e. car, bus, truck and motorcycle) from 2015 to 2018 was lower than the projection in the existing RUEN. Thinking about this condition, we predicted that the new number of vehicles between 2019 and 2050 would also be smaller than the existing RUEN projection.
Note: This number of vehicles is used only for realization scenarios; figures are cumulative. Source: adjustment of existing RUEN data based on the realized number of vehicles from 2015-2018 Table 4 Updated number of vehicles in the new Indonesian energy model*. Source: adjustment of existing RUEN data based on the number of vehicles realized from 2015-2018. Table 5 Updated transport needs in the new Indonesian energy model*.
Meanwhile, the energy intensity is estimated based on the technology of each device and its efficiency level. The activity level and energy intensity between urban and rural households are different. For example, the difference in purchasing power will create a difference in the ownership of household appliances between urban and urban families.
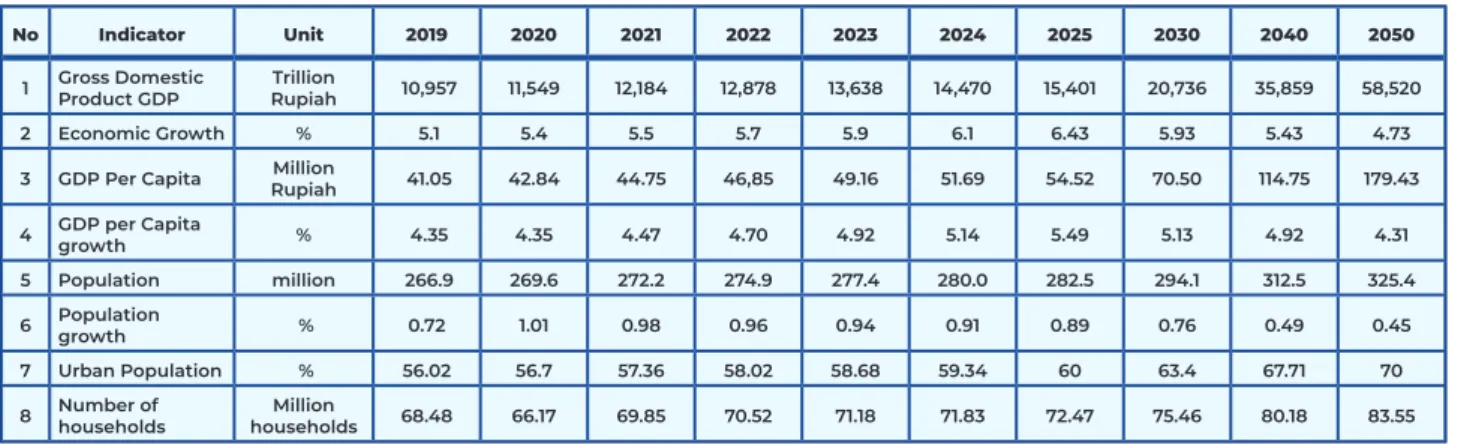
The number of households from 2019 to 2045, both urban and rural, in this model is updated using data from the 2015-2045 Indonesian population projection. This energy demand can be in the form of electricity (e.g. for lighting, air conditioning, elevator) and thermal (e.g. for cooking and water heater) (P2RUED-P, 2017). Source: adjustment of the existing RUEN data based on the realization figure for floor area growth and the elasticity of the business sector's GDP from 2015-2018.
Looking at the new figure from the commercial sector, the growth in our model is less than that. In light of this condition, we expected new commercial demand from 2019-2050 to also be lower than the existing RUEN projection. Aggregate power plants built by both fossil fuel and new renewable energy (NRE) are also updated and adjusted based on the new demand and adapted to the power plants.
Transformation
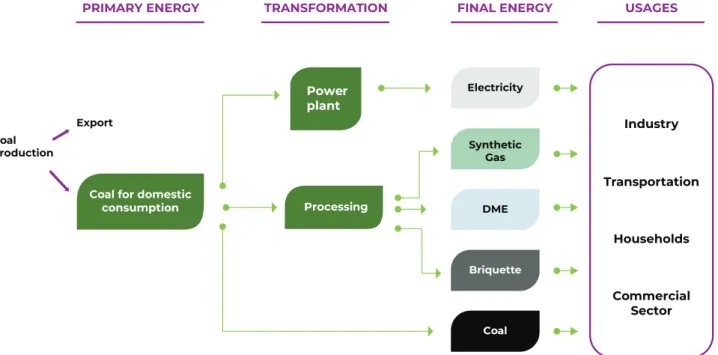
Coal
Energy Supply Structure
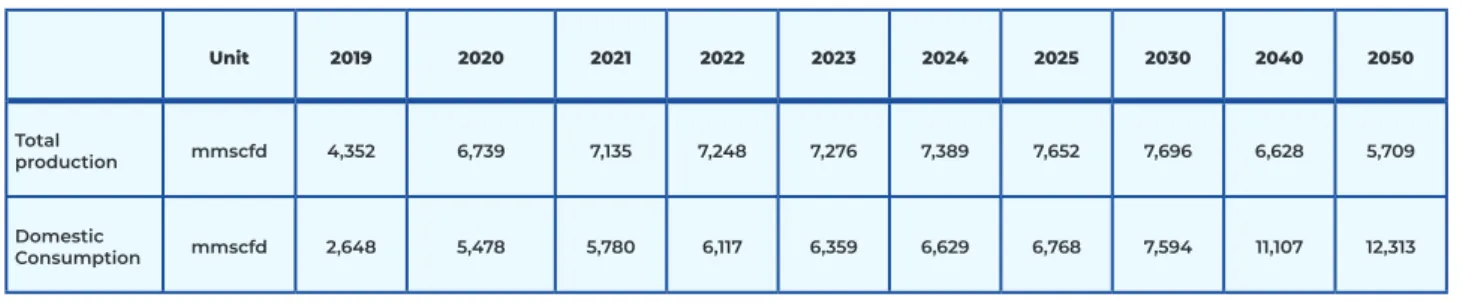
Natural Gas
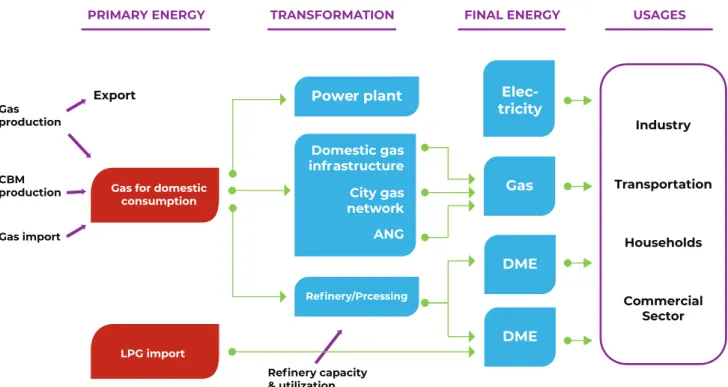
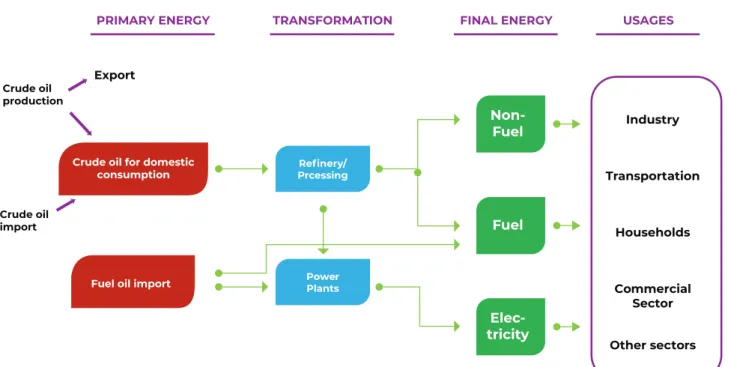
The primary energy supply to meet Indonesia's natural gas needs consists of domestic gas production and imports, coal bed methane (CBM) production, and liquefied petroleum gas (LPG) imports. This natural gas and CBM will go through the transformation process in power plants and processing plants/refineries to produce the final. In addition, this natural gas can also be used directly through the municipal gas pipeline network and Adsorbed Natural Gas (ANG).
Petroleum (Oil)
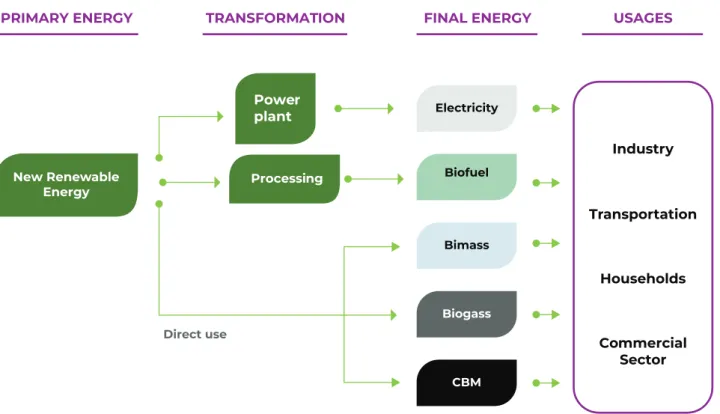
New and Renewable Energy (NRE)
Existing RUEN
- Current Policies Scenario
- City gas-network intensification
- Increase the usage of electric vehicles
- Combination of the City-Gas Network, Electric Vehicles, and Biofuel Intensifi-
- Energy Transition Scenario
- Increase usage of biofuel
- No CFPPs Construction from 2029 on- wards
- No Construction of New CFPPs from 2025
- Combination of Cessation of CFPPs Construction from 2025 and Latest Government Policy to Phase Out Combined Cycle Power Plants Aging Older than 20 Years by 2024
- Existing RUEN
- Realization Scenario
- Current Policies Scenario
- Legal Frameworks for Renewable Energy or Laws that Include Targets and Plans
- Financial and Regulatory Incentives for Renewables
- Grid Access and Dispatch Priority for Renewable Energy
Regarding the energy mix, the renewable energy target in the existing RUEN for the primary energy mix is 23% by 2025. In the realization scenario, the expected share of renewable sources in the primary energy mix is 15%. In 2025, electricity demand will decrease from 772 TWh in the existing RUEN to only 447 TWh.
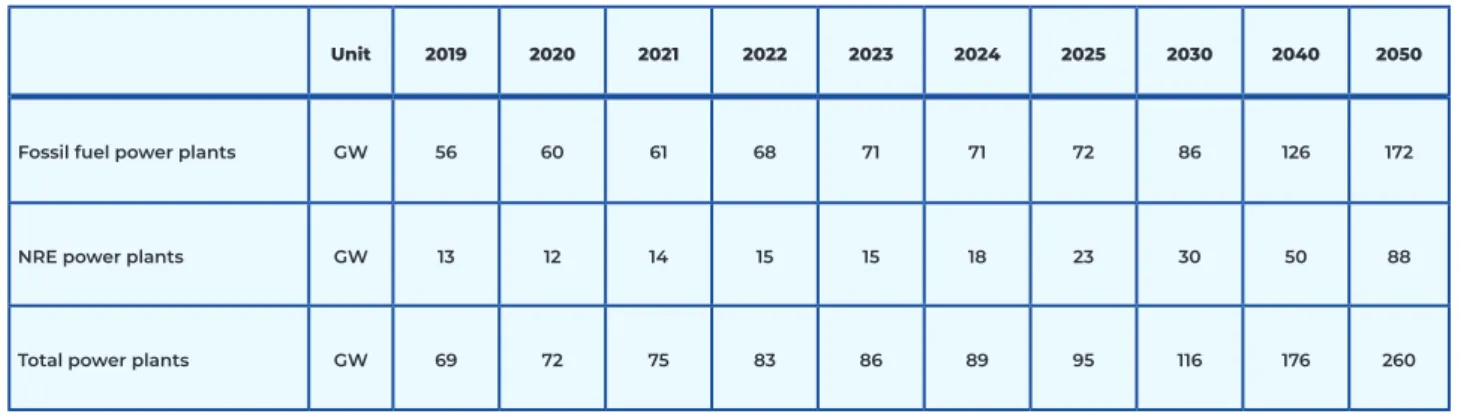
The new power plant capacity projection for 2025-2050 in the realization scenario can be seen in table 16. So in 2050 the difference between these two scenarios becomes more obvious, where renewable energy reaches 40% in the primary energy mix for the current policy ratio compared to 23%. The installed capacity of the power plant in the intensification scenario also increases compared to the realization scenario from 95 to 97 GW in 2025 and from 260 to 308 GW in 2050.
With a larger total power plant capacity in the current policy scenario, the share of each power plant is also adjusted. The share of renewable energy can only surpass the fossil share from 2040 to 2042 in the various intervention types. The share of renewable energy will exceed the fossil share in 2042, when it reaches 51% in the primary energy mix.
With higher total power plant capacity in the energy transition scenario, the weight of each power plant is also adjusted. The most recent projection of power plant capacity from 2025 to 2050 in the energy transition scenario that stops CFPP construction from 2029 onwards can be seen in Table 18 below. This means that the future projection in the existing RUEN is also disproportionate, for example, in the consumption of primary energy and electricity, including the power plant capacity.
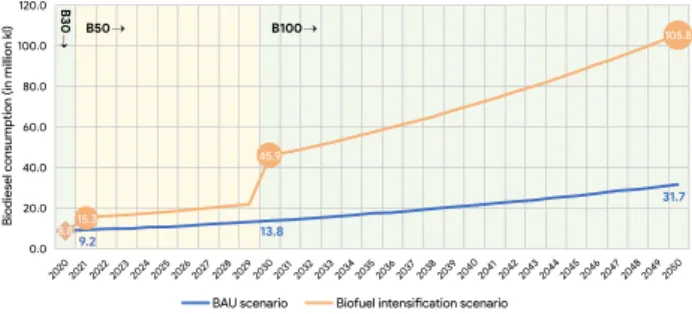
Primary energy consumption in the realization scenario is lower than the existing RUEN with an annual energy consumption growth rate of The current policy scenario will increase the share of renewable energy sources in the primary energy mix due to the biodiesel program, from B50 starting from 2021 to B100 starting from 2030. This biodiesel program alone is not sufficient to increase the share of renewable energy sources in the primary energy mix to more than 50%.
By 2050, however, renewable energy's share in the primary energy mix will reach 40.3%, well above the existing RUEN and realization scenario target. The sooner the CFPPs' ban is implemented, the more significant shares of renewable energy are in the primary energy mix, and the sooner renewable energy's share surpasses fossil fuels.