What student factor variables affect the likelihood that AP CSP is offered in CPS high schools. What teacher-factor variables affect the likelihood that AP CSP is offered in CPS high schools. Which school context factor variables influence the likelihood that AP CSP is offered in CPS high schools.
The presence of AP CSP partially qualified teachers and a five-year high school graduation rate correlated with a higher chance of a CPS high school offering AP CSP, while increased percentages of black students, increased percentages of students enrolled in special education, and the presence of a Career and Technical Education - Information Technology (CTE-IT) track correlated with decreased odds of a CPS high school offering AP CSP. Another recommendation is to do a case study of the schools that currently offer AP CSP to determine how they were able to do so. This project may help inform educational stakeholders about future research when determining optimal environments and support systems that may be needed when deciding where to initiate AP CSP courses within CPS.
Introduction
This is one way our project fits within the goal of CPS: AP CSP Course Extension. In theory, if more high schools in the district offer AP CSP, more students will be willing to take and pass the AP CSP exam. One of the immediate challenges for our partner organization is trying to determine the key factors that influence whether a Chicago public high school offers AP CSP.
Our partner organization wanted to increase AP CSP offerings across multiple high schools in CPS, and they are developing a strategy for how best to do this by examining school characteristics related to whether AP CSP is offered. Our partners want to expand this trend and introduce AP CSP across more colleges. By understanding which of the available school-level variables are most likely to predict the likelihood of AP CSP being offered, researchers and practitioners can use this information to target limited resources and expand this curricular offering.
Literature Review
A study of Catholic high schools, mostly located in low-SES neighborhoods, tended to offer fewer courses overall (Bryk et al., 1993), indicating that the higher the SES of families on average, the more courses offered a school probably have . Researchers also found that having well-prepared teachers was an important element for the ideal implementation of AP science courses in under-resourced areas (Long et al., 2019). In addition, research by Iatarola et al. 2011) found that school administrators in Florida used student standardized test scores and.
The optimal school size for maximum student academic achievement is a recurring issue in educational research (Berry & West, 2010; Bryk et al., 1993; Friedkin &. However, many education stakeholders agree that primary school attendance contributes significantly to academic and future success in life (Gonzales et al., 2002; Research also links schools with chronic student absenteeism to endemic poverty (Cheng & Balfanz, 2013; Singer et al., 2021).
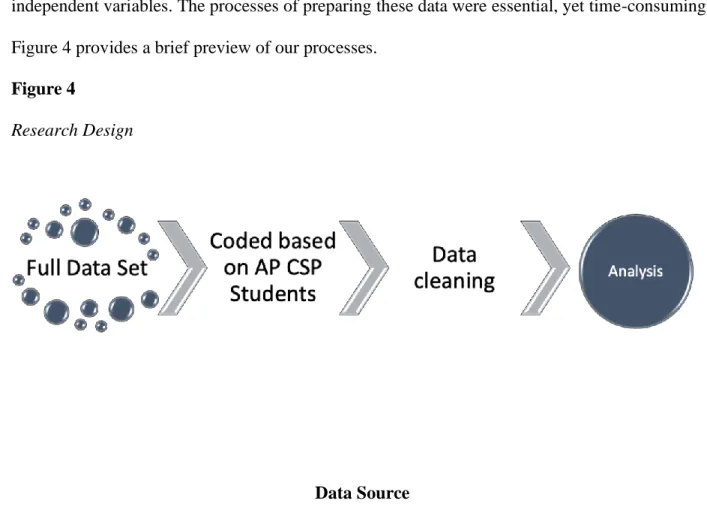
Project Design and Research Methods
Of the variables used in our analysis, there was a minimal amount (<1%) of missing data which we coded as N/A. In general, the null hypothesis states that all coefficients in the model are equal to zero, or that none of the predictor or independent variables has a statistically significant relationship with the response or dependent variable (Lottes et al., 1996). In other words, there is a statistically significant relationship between the predictor or independent variables and the response or dependent variable.
We used multiple logistic regression analysis mainly because of the binary dependent variable [Offer_CSP]. Researchers often use logistic regression in medical, psychological, economic, agricultural and social science research when studying outcomes represented by binary variables (Allen, 1997; Larsen et al., 2000; Mood, 2010; Sperandei, 2014; Szumilas, 2010). Logistic regression models can allow us to establish a relationship between a binary dependent variable and a group of independent variables.
Logistic regression estimates the probability that an event will occur or that the event in question will have a particular outcome by using information or characteristics that are thought to be related to or influence such events (Pampel, 2021; Tolles & Meurer, 2016). Multiple logistic regression allowed us to examine multiple variables simultaneously, as these variables can interact with each other in the real world. Multiple logistic regression was also more informative than simple logistic regression because it revealed the unique contribution of each variable after adjusting for the others (Stoltzfus, 2011).
In this project, the terms predictors and explanatory are used to refer to the independent variables for which the influences are quantified, and the term outcome is also used to refer to the dependent variable in the logistic regression model (Altman & Royston, 2000; Rose & McGuire, 2019; Tolles & Meurer, 2016). The use of logistic regression can show which of the various factors being assessed has the strongest association with an outcome and provides a measure of the magnitude of the potential influence. When researchers have a binary dependent variable, they often use logistic regression to obtain odds ratios in the presence of more than one explanatory variable (Lottes et al., 1996).
The result is the impact of each variable on the odds ratio of the observed event of interest, with the advantage of avoiding some confounding effects by analyzing the correlation between all variables together (Mood, 2010; Sperandei, 2014).
Results
The first design question asked what student factors influence the likelihood that AP CSP is offered in CPS high schools. Another design question asked what teacher factors influence the likelihood that AP CSP is offered in CPS high schools. The results show that the number of at least partially qualified AP CSP teachers was the only predictor of teachers in our final model.
Over the five years the course has been offered, 87 of the 532 CPS high schools have offered AP CSP. While the number of high schools offering AP CSP increased annually, schools that offered the course did not exceed 25 percent of all schools in the district. Chicago Public Schools should encourage schools with at least one partially qualified AP CSP teacher to consider offering the course.
The number of at least partially qualified AP CSP teachers had the greatest explanatory value in our model. A school that has at least one partially qualified CSP teacher should be the next target for schools to offer an AP CSP course. In the most recent year of available data, which is SY2020-2021, there were 35 schools that had at least one partially qualified AP CSP teacher.
Chicago Public Schools should encourage STEM schools with a high percentage of Black students and at least one partially qualified AP CSP teacher to offer the course. Forty-one of the 79 schools that did not offer AP CSP (51.3%) had at least 50 percent black students. There were four schools that had previously offered AP CSP but did not offer the course in SY2020-2021.
The district must continue to invest time, energy, and resources to increase the number of qualified AP CSP teachers.
Looking forward to high school and college: Middle-grade indicators of readiness in Chicago Public Schools. Diverse students, high school factors, and completion agenda goals: An analysis of the Illinois class of 2003. Teacher credentials and student achievement in high school: A cross-subject analysis with student fixed effects.
College comes after high school: Participation and achievement in Tennessee's innovative wave of dual-credit courses. 2011 NECAP: Middle-school scores higher, high school math lower five-year graduation rate rises to 80 percent [Press Release]. Confronting the "acid test": Educators' perspectives on expanding access to Advanced Placement at a diverse Florida high school.
Graduation Rate Calculation User's Guide, Volume 2: Technical Evaluation of Graduation Proximate Indicators (NCES 2006-605).
Appendices
34ECS_NumTchrs_AtLeastPartialQual_FIXED Number of at least partially qualified ECS teachers in the school for a given year. 36CSP_NumTchrs_AtLeastPartialQual_FIXED Number of at least partially qualified CSP teachers in the school for a given year. 47Ratio_EnrollToECS_NumTchrs_AtLeastPartialQual_FixedTotal Enrollment divided by the number of at least partially qualified ECS teachers.
49Ratio_EnrollToCSP_NumTchrs_AtLeastPartialQual_FixedTotal Enrollment divided by the number of at least partially qualified CSP teachers. None of the other student factor variables were individually predictive of whether AP CSP would be offered (see Figure 10). Simple regression analysis revealed that the number of ECS and CSP partially qualified teachers, the number of total ECS teachers per year, and the average years of ECS teaching experience were all positive predictors of whether the school would offer AP-CSP.
None of the other teacher factor variables were individually predictive of whether AP CSP would be offered (see Figure 11). After looking at the teacher factor variables individually and determining their single effects, we wanted to see the collective effects of all teacher factors when considered together. When all teacher factor variables were blocked together, only the number of partially qualified AP CSP teachers remained predictive (see Table 3).
After looking at the school context factor variables individually and determining their single effects, we wanted to see the collective effects of all school context factor variables when considered together. The time alone was significant as expected, as the number of schools offering AP-CSP increases every year. Using this model, the percentages of Black and special education students were still negatively predictive, and the proportion of partially qualified CSP teachers was positively predictive.
The positive predictors were enrollment, the five-year graduation rate, and the number of partially qualified CSP teachers.