Morphologic and facies trends through the fluvial – marine transition in tide-dominated depositional systems: A schematic framework for
environmental and sequence-stratigraphic interpretation
Robert W. Dalrymple ⁎ , Kyungsik Choi
1Department of Geological Sciences and Geological Engineering, Queen's University, Kingston, Ontario, Canada K7L 3N6 Received 22 June 2005; accepted 3 October 2006
Abstract
Most tide-dominated estuarine and deltaic deposits accumulate in the fluvial-to-marine transition zone, which is one of the most complicated areas on earth, because of the large number of terrestrial and marine processes that interact there. An understanding of how the facies change through this transition is necessary if we are to make correct paleo-environmental and sequence-stratigraphic interpretations of sedimentary successions. The most important process variations in this zone are: a seaward decrease in the intensity of river flow and a seaward increase in the intensity of tidal currents. Together these trends cause a dominance of river currents and a net seaward transport of sediment in the inner part of the transition zone, and a dominance of tidal currents in the seaward part of the transition, with the tendency for the development of a net landward transport of sediment. These transport patterns in turn develop a bedload convergence within the middle portion of all estuaries and in the distributary-mouth-bar area of deltas. The transport pathways also generate grain-size trends in the sand fraction: a seaward decrease in sand size through the entire fluvial–marine transition in deltas, and through the river-dominated, inner part of estuaries, but a landward decrease in sand size in the outer part of estuaries. A turbidity maximum (i.e., a zone of significantly elevated suspended-sediment concentrations) is developed within estuaries and the delta-plain region of deltas as a result of flocculation and density-driven water-circulation patterns. This leads to an area within the estuary or delta plain where the abundance and thickness of the mud drapes are greatest, including the potential for the development of fluid-mud deposits (i.e., structureless mud layers more than 0.5–1 cm thick that were deposited in a single slack-water period). A monotonic seaward increase in salinity characterizes both estuaries and deltas. The brackish-water conditions in the transition zone, accompanied by the high turbidity and physically harsh conditions, produce a biologically stressed environment, in which bioturbation is generally not pervasive. The ichnofossil assemblage in this zone is characterized by the low diversity of ichnogenera, small size of the individual burrows (typically smaller than their open-marine counterparts), and highly variable population densities, ranging from unbioturbated to very high-density mono-specific assemblages in local areas.
This review begins with a survey of how and why each depositional process varies through the fluvial-to-marine transition and then examines the sedimentological responses to these processes, focussing on the observable, longitudinal variations in the development and/or abundance of each deposit characteristic (e.g., sand grain size, paleocurrent patterns, mud drapes, and biological attributes). The review ends with a summary of the characteristics of each major facies zone through the transition, with separate discussions for both estuaries and deltas. It must be noted that any attempt to generalize, as is done here, will undoubtedly
⁎ Corresponding author. Tel.: +1 613 533 6186; fax: +1 613 533 6592.
E-mail addresses:[email protected](R.W. Dalrymple),[email protected](K. Choi).
1Present address: Faculty of Earth Systems and Environmental Sciences, Chonnam National University, Gwangju 500-757, Korea. Tel.: +82 62 530 3473; fax: +82 62 530 3469.
0012-8252/$ - see front matter © 2007 Elsevier B.V. All rights reserved.
doi:10.1016/j.earscirev.2006.10.002
contain statements that are inappropriate for individual deposits or systems. Exceptions must be expected and the concepts must be applied with due consideration for the local context.
© 2007 Elsevier B.V. All rights reserved.
Keywords:tide-dominated; proximal–distal facies trends; fluvial–marine transition; delta; estuary
1. Introduction
The correct interpretation of ancient sedimentary deposits, whether for academic or applied purposes, requires knowledge about two separate, but inter-related aspects of sedimentary successions: interpretation of the original depositional environments, using the techniques of facies analysis, as illustrated by the popular textbook
“Facies Models” (Walker and James, 1992); and subdivision of the stratigraphic succession into genetical- ly related units using the principles of sequence stratigraphy (e.g.,Van Wagoner et al., 1988; Posamentier and Allen, 1999; Catuneanu, 2006). The integration of these two lines of investigation allows the construction of realistic paleogeographic reconstructions that show how the depositional facies are related in space and time. From this, it is possible to develop more precise depositional histories, and to predict more accurately the location and geometry of hydrocarbon reservoir facies.
The sequence-stratigraphic analysis of sedimentary successions, including the identification of sequence boundaries and maximum flooding surfaces, is based on the identification of sequential (i.e., progressive) changes in the nature of the deposits. Thus, prograda- tional successions, in which more proximal deposits overlie those formed in more distal settings, characterize the falling-stage, lowstand, and highstand systems tracts, whereas retrogradational facies stacking (i.e., more distal over more proximal deposits) occurs in the transgressive systems tract. Facies stacking patterns are also important for the correct identification of some environments. For example, estuaries, as defined byDalrymple et al. (1992;
see alsoBoyd et al., 2006; Dalrymple, 2006), form only under transgressive conditions and thus are represented primarily by transgressive successions, whereas deltas are progradational (Dalrymple et al., 2003).
[Throughout this review, the terms “estuary” and
“estuarine”refer only to transgressive coastal areas and not to those areas with brackish-water! Indeed, as will be noted later, brackish-water conditions also occur in deltas and even in some shelf environments, whereas some transgressing coastal areas have either fully fresh or fully marine salinity. However, the use of“estuary”
here differs slightly from that proposed byDalrymple et al. (1992)and instead follows the revised definition
proposed byDalrymple (2006)in that we do not restrict the term to incised-valley systems. Thus, the abandoned portions of delta plains that are undergoing transgression (i.e., the“destructive phase”of the delta cycle) are here considered to be estuaries (Fig. 1). In this context, the term “delta”is applied only to the actively prograding portion of the larger deltaic system.]
The paragraphs above show that the ability to distinguish proximal facies from more distal deposits is an essential element of most sedimentary interpretations.
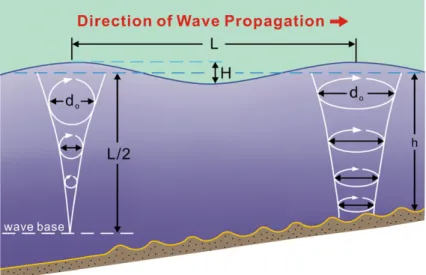
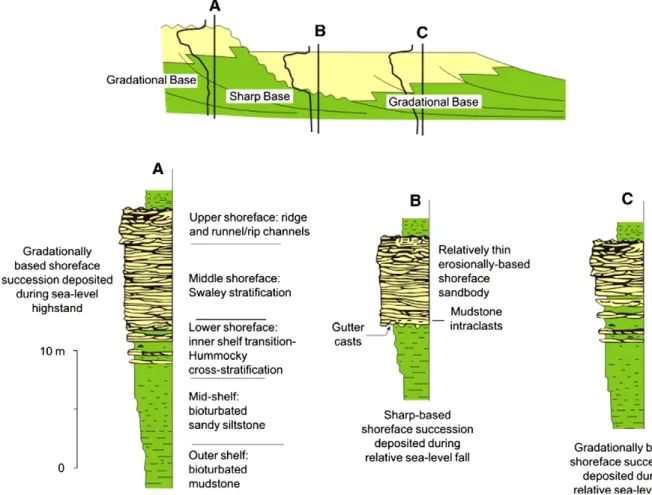
However, the distinction of proximal from distal facies is not equally easy in all environmental settings. Wave- dominated coastal zones (i.e., the beach-shoreface-shelf suite of environments) display a simple and well- understood decrease in wave-energy level as the water depth increases (Fig. 2). As a result of this monotonic trend in wave energy, there is a predictable correlation between water depth and facies that is represented by an upward-coarsening succession (Fig. 3A, C) that passes from mudstones (“offshore”), through deposits with thin,
Fig. 1. Satellite image of the Indus River delta (sensu lato). The area of active river outflow occurs at the apex of the deltaic protrusion in the centre of the image. Only this part of the coast and the immediately adjacent areas are receiving river-supplied sedimentdirectlyfrom the river; hence, this is the only part of the system that is actively prograding at the present time (i.e., it is the only part of the system that is truly deltaic in the context used in this paper). The remainder of the delta plain is inactive (i.e., abandoned) and is inferred to be undergoing slow transgression due to tectonic subsidence and/or compaction of the underlying mud. Thus, the many sinuous tidal channels in the abandoned part of the larger delta complex behave as estuaries, as def ined herein. For more information on this delta, seeBrookf ield (1998)andPrins et al. (2000). Courtesy of European Space Agency (ESA).
136 R.W. Dalrymple, K. Choi / Earth-Science Reviews 81 (2007) 135–174
discrete sandstone beds with wave ripples and hum- mocky cross stratification (HCS) (offshore transition), into amalgamated sandstones with HCS (lower shore- face) and eventually into sandstones with swaley cross stratification (SCS) and cross bedding (upper shoreface) (e.g., Walker and Plint, 1992). In fact, this vertical succession is so predictable that deviations from the expected succession can be used to infer such things as forced regressions (Fig. 3B).
By comparison, the proximal–distal changes in processes and facies that occur in tide-dominated environments (sensuBoyd et al., 1992; see the“General considerations”section below for a discussion of what is meant by“tide dominated”) are not well known because of their inherent complexity. At least two fundamental factors account for this. First, tidal energy does not vary in a simple (i.e., monotonic) way with onshore-offshore position. Studies in many modern environments show that tide-dominated environments are generally hypersyn- chronous. This means that the tidal range increases landward because of the funnel-shaped geometry of the channel systems comprising the estuary or delta (Figs. 4 and 5). This in turn means that there are two areas with relatively weak tidal currents (at the mouth and at the head), separated by an area with stronger tidal currents.
Thus, it might be possible to get similar tidal deposits in two very different parts of the fluvial–marine transition, leading to confusion and potential mis-interpretation of the depositional environment. Secondly, tidal environ- ments are characterized by complex networks of tidal channels and bars. This causes the architecture of the deposits to be complex because of the migration and
stacking of successive channels and the presence of erosion surfaces of several different orders (Figs. 6 and 7).
Furthermore, there are vertical changes in tidal current speeds within a single channel that mimic the longitudinal changes in tidal energy. The erosional juxtaposition of channel bodies also makes it difficult to recognize any larger-scale stratigraphic trends that may exist.
The task of interpreting ancient tidal deposits is made even more challenging by the fact that there is a global dominance of transgressive coastlines in the modern world. Consequently, almost all of the well-studied modern, tide-dominated systems are transgressive (i.e., estuaries such as the Bay of Fundy—Dalrymple et al., 1990, 1991; Dalrymple and Zaitlin, 1994; and the Severn Estuary—Harris and Collins, 1985; Allen, 1990). By comparison, there are very few well-documented modern (Dalrymple et al., 2003) or ancient (e.g.,Mutti et al., 1985; Maguregui and Tyler, 1991; Martinius et al., 2001) examples of progradational (i.e., deltaic) tide- dominated successions, and some well-respected sedi- mentologists have even suggested that tide-dominated deltas do not exist (Walker, 1992; Bhattacharya and Walker, 1992), a view that is not universally accepted (Dalrymple, 1999; Harris et al., 2002; Dalrymple et al., 2003; Willis, 2005). This bias in the availability of analogues leads to a tendency for workers to assume that ancient tide-dominated deposits were also formed during transgressions.
Given these inherent difficulties with the interpretation of tide-dominated deposits, which are of increasing economic importance given the large number of important petroleum reservoirs hosted by tidal deposits (e.g., the
Fig. 2. Diagram showing the decrease in the intensity of wave-orbital motion with increasing depth in a water body. Below“wave base”, there is no appreciable sediment movement due to surface-wave action. This trend is entirely predictable and leads to the vertical succession of sedimentary structures shown inFig. 3.
McMurray Oil Sands, Alberta, Canada), the purpose of this report is to synthesize the available information on the proximal–distal changes in the facies characteristics of tidal environments, from the limit of tidal action within fluvial systems, through the coastal zone, and out onto the shelf. In addition, we examine changes in facies as a function of water depth, both within channels in the inshore zone (i.e., landward of the main coast) and with increasing water depth in the offshore zone. Our approach is based on theoretical considerations, supplemented by what information there is from modern estuaries and deltas. Our objective is to produce a set of criteria that can be applied to ancient tide-dominated deposits in order to facilitate their environmental and sequence-stratigraphic subdivision and interpretation.
2. General considerations
The transition zone between terrestrial (river) environments and the open-marine shelf (i.e., the coastal
zone sensu lato) represents one of the most profound spatial changes in depositional conditions that can be found anywhere on earth. Many factors that influence the nature of the deposits change dramatically across this zone. The most fundamental of these are (Fig. 8):
(1) the bathymetry and geomorphology — from relatively shallow-water, channelized environ- ments landward of the coast, to deeper, uncon- fined settings on the shelf;
(2) the source of the physical energy responsible for sediment movement—from purely river currents to tidal, wave, and/or oceanic currents on the shelf;
(3) the resulting frequency, rate, and direction of sediment movement–unidirectional and continu- ous to seasonal or flashy in the river; reversing, with mutually evasive transport pathways in tidal settings, with a tendency for landward-directed residual transport; to episodic and either coast parallel in wave-dominated shelf settings or
Fig. 3. Depositional model for a prograding wave-dominated shoreline to shelf environment. Columns (A and C) represent the standard facies model that results from the decreasing intensity of wave motion with increasing water depth (seeFig. 2). Departures from the ideal succession can be used to infer such things as a forced regression, as shown in column (B). AfterPosamentier and Allen (1999). Courtesy of SEPM (Society for Sedimentary Geology).
138 R.W. Dalrymple, K. Choi / Earth-Science Reviews 81 (2007) 135–174
onshore–offshore in tide-dominated shelf envir- onments; and
(4) the salinity of the water — from fresh, through brackish, to fully marine on the shelf (hypersaline estuaries, such as those which occur in arid coastal areas, are not considered here).
These primary changes, which generally are not observable directly in the rock record, bring about changes in various sedimentary characteristics that are observable, including: the grain-size characteristics (mean size, sorting, etc.) of the sand-size sediment and their spatial (proximal–distal) distribution; the sus- pended-sediment concentration and, hence, the abun- dance, thickness and lateral extent of mud layers; the types of physical sedimentary structures (both current and wave generated); the direction of bedform migration and thus the paleocurrent directions recorded in the sediment; and the abundance and diversity of organisms and hence the abundance, style, and size of burrows.
This list of characteristics represents those features that the practicing geologist should record in order to work out proximal–distal trends in tidal facies. The remainder of this review will outline the manner in which these characteristics vary spatially and with water depth.
In the following discussion we will consider primarily tide-dominated sedimentary environments (sensu Boyd et al., 1992; Dalrymple et al., 1992; cf.Harris et al., 2002), with supporting reference to selected “mixed-energy”
environments (i.e., strongly tide-influenced settings) that have near-equal influence of waves and tidal currents. In this context, we define an“environment”as a large-scale assemblage of sub-environments or facies, which encom- passes a large geographic area. In other words, the geographic scope is larger than that of a single tidal flat or tidal sand bar. FollowingGalloway (1975),Swift (1976), and others, tidal dominance occurs if tidal currents are responsible for more sediment transport than river currents or waves and thus determine the larger geomorphology. Geomorphologically, this tidal domi- nance is shown by a predominance of coast-normal, elongate tidal bars and tidal-channel networks (Figs. 9– 11), and by an absence (or the restricted development) of wave-generated, coast-parallel barriers and/or beaches. In modern environments, this is easily determined using topographic and bathymetric maps. In ancient succes- sions, by contrast, it is much more difficult to determine, with confidence, whether a paleo-environment was tidally dominated in the larger context. An abundance of tide- dominated facies is not enough to indicate tidal domi- nance of the larger environment. For example, in the case of wave-dominated estuaries that have barriers at their mouth, the wave-formed barrier, which determines the fundamental facies distribution in such settings by their creation of a protected lagoon, is typically eroded during transgression, leaving behind only back-barrier, tidal facies (Fig. 12;Damarest and Kraft, 1987; Nummedal and Swift, 1987; Reinson, 1992). Thus, even though all of the
Fig. 4. Variation of tidal range and tidal-current speeds along the length of an estuary or delta. In the left-hand pair of figures, a“hypersyn- chronous”system, the funnel-shaped geometry causes the incoming tide to increase in range because of the progressive decrease in cross- sectional area. Beyond a certain point, however, friction on the bottom and sides causes the tidal range and tidal-current speeds to decrease to zero at the tidal limit. In the right-hand pair of diagrams, a“hypo- synchronous system, bottom friction always offsets the influence of convergence, leading to a continual landward decrease in tidal range and tidal-current speeds. Hypersynchronous conditions characterize tide-dominated environments, whereas hyposynchronous conditions are most common in wave-dominated environments. AfterSalomon and Allen (1983); see alsoNichols and Biggs (1985)andDyer (1997).
Fig. 5. Longitudinal variation of estuary width and tidal range in the Westerschelde estuary, The Netherlands. Place names (top) keyed to inset map. Note how the tidal range increases landward as the estuary width decreases, reaching a peak range (the“tidal maximum”) inland of Antwerp. Modified afterVan der Spek (1997).
preserved estuarine deposits may show strong evidence of tidal action and little or no wave influence, the environment as a whole was not tidally dominated. As a result, the application of the results presented below to individual rock successions must be done with caution.
3. Process variations
In the following sections, we examine the lon- gitudinal (from land to sea) and depth-related var-
iation of the physical, chemical, and biological processes that directly influence the nature of the deposits. Because estuaries and deltas have important differences in some regards, they are considered separately.
3.1. Physical processes
Three significant physical processes (i.e., the energy sources: Fig. 8) must be considered: river
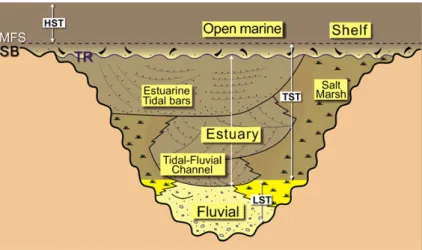
Fig. 6. Schematic vertical cross section of a tide-dominated estuary located within an incised valley (see map view inFig. 9). The overall succession is transgressive in character, with fluvial deposits at the base, overlain by estuarine deposits, and capped by open-marine deposits of the succeeding progradation. Systems tracts are noted. Within the estuary deposits, note that the sandy channels become larger (wider) upward, reflecting the seaward-flaring, funnel shape of this type of system (seeFigs. 9 and 21below). These sandy channel deposits are flanked by muddy tidal-flat and salt- marsh sediments. AfterDalrymple (1992).
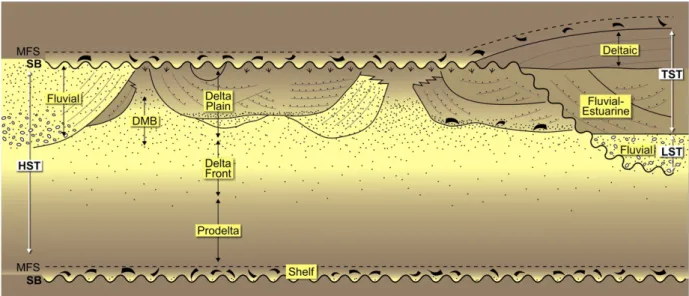
Fig. 7. Schematic vertical cross section of a tide-dominated delta, based on the Fly River delta, Papua New Guinea (see map view inFig. 11). The succession is progradational: from base to top, the facies succession consists of prodelta→delta front→distributary mouth bars (DMB)→delta plain→ fluvial deposits. Note that the delta-plain deposits consist of a nested series of tidally influenced/dominated channels. AfterDalrymple et al. (2003).
Courtesy of SEPM (Society for Sedimentary Geology).
140 R.W. Dalrymple, K. Choi / Earth-Science Reviews 81 (2007) 135–174
currents, tidal currents, and waves. The relative im- portance of these processes varies in a systematic manner through the river-to-marine transition (Figs. 9 and 11). Physical processes of lesser importance (e.g., wind and oceanic currents) are not considered here for simplicity, but may be important in some cases.
3.1.1. River currents
River currents decrease in strength and relative important in a seaward direction through both estuaries and deltas, because of the decreasing physical and hydraulic gradient as the river approaches the sea. The splitting of flow between multiple distributary and tidal channels also contributes to the seaward decrease in the strength of river flow.
Fig. 8. Coast-normal variation in the essential controls on sedimen- tation in the transition from purely fluvial settings (“land”), through the tide-dominated coastal zone, to shelf environments (“sea”). These variations represent the fundamental constraints that determine the nature of the facies changes through this transition zone.
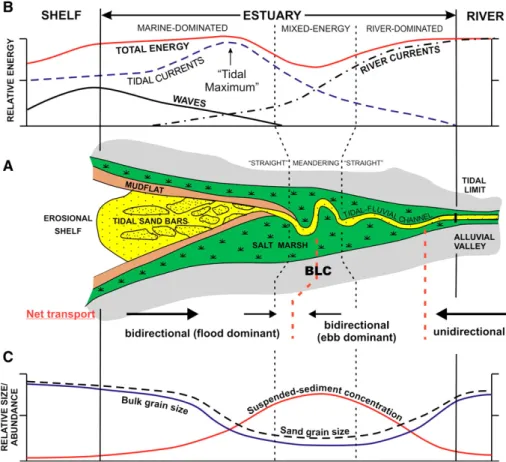
Fig. 9. (A) Schematic map of a tide-dominated estuary. Note the funnel shape, the systematic changes in channel geometry (“straight”-meandering-“straight”), the presence of elongate tidal bars in the seaward part, and the fringing muddy tidal flats and salt marshes. ( Note that the mud flats and salt marshes are replaced with mangroves in tropical areas). Because the system as a whole is migrating landward (i.e., transgressing), the outer margin of the mudflats is commonly bordered by an erosional channel margin (cf.Dalrymple et al., 1991). A schematic cross section of such an estuary is shown inFig. 6. AfterDalrymple et al.
(1992). (B) Longitudinal variation of the intensity of the three main physical processes, river currents, tidal currents and waves, and the resulting directions of net sediment transport (at bottom of A) through a tide-dominated estuary. Note the development of a bedload convergence (BLC) at the location of the tightly meandering portion of the channel. Modified fromDalrymple et al. (1992). (C) Longitudinal variation of: the grain size of the sand fraction, the suspended- sediment concentration and“bulk”grain size of the resulting deposits (essentially the sand:mud ratio). See text for additional discussion. A and B courtesy of SEPM (Society for Sedimentary Geology).
3.1.2. Tidal currents
The seaward part of estuaries and deltas is subjected to tidal action that produces an alternation of landward- directed (flood) and seaward-directed (ebb) tidal currents. Because tide-dominated systems are hyper- synchronous (Fig. 4), tidal ranges and tidal currents increase as one goes landward from the sea, because the incoming tidal wave is compressed into a progressively smaller cross-sectional area, until friction causes them to decrease toward the tidal limit. As a result, the maximum tidal-current speeds occur within the middle estuary (Figs. 9B and 13), or in the middle to inner part of the delta plain, near the place where the distributary channels bifurcate (Fig. 11C). This area is referred to here as the “tidal maximum” (Figs. 5 and 13). Local constrictions, and especially those caused by bedrock outcrops, will also produce areas with stronger currents, but these are generally of smaller geographic size than the current-speed maximum generated by convergence.
3.1.3. Resultant currents and sand transport directions The actually measured, resultant current speeds are the sum of the tidal and river-generated water move- ments (ignoring density-driven circulation for the time being). In the river proper, current speeds generally vary
only slowly, typically on a weekly to monthly time scale in response to seasonal or storm-related variations in water discharge. Even flashy fluvial systems with short, high-magnitude floods exhibit current-speed variations that that are generally slow relative to the semi-diurnal variation in current speeds that characterize most tidal systems. As a result, over the period of one tidal cycle (12.4 h in common semi-diurnal systems), the river currents can in most cases be considered to be effectively constant (Fig. 14A). As one moves seaward, tidal influence is felt first by a tidally induced modulation of the seaward-directed river flow: the current is directed seaward throughout the entire tidal cycle and never stops, but experiences variations in speed as a result of an alternation of retardation (by the tidal-backwater effect) and acceleration (by tidal drawdown) of the river current (Fig. 14B). Moving further seaward, the tidal currents gradually increase in strength such that, at some point, the retardation by the flood tide becomes great enough that the river flow is just stopped but doesn't reverse (Fig. 14C); still further seaward, periodic flow reversals occur, with the length and strength of the landward-directed currents increas- ing in a down-river direction, at least as far as the“tidal maximum” (Fig. 14D, E). As a result, the water movement in the seaward part of estuaries and deltas is typically dominated by tidal currents, whereas the inner part is dominated by river currents (Figs. 9,11,13 and 14).
The progressive, landward decrease in the effect of the tide means that the “tidal limit” is not a rigidly defined location. It could be placed anywhere between the most landward occurrence of flow reversal (Fig. 14C) and the most landward occurrence of tidally modulated river flow (Fig. 14B) that may be separated by many tens to hundreds of kilometers. These positions also move upstream and downstream over long distances in response to variations in river discharge or neap-spring changes in tidal range. Thus, areas with no tidal influence during times of high river discharge may experience appreciable tidal influence during times of low river flow. As a result, the “tidal limit” is best considered as a zone rather than a specific fixed point.
This also means that it is possible to find sporadic tidal indicators in areas that are otherwise purely fluvial. See Van den Berg et al. (in press)for additional discussion of how the tidal limit may be defined.
Sand-size bedload material and silt and clay-size suspended sediment respond very differently to the complex, combined fluvial and tidal currents, because of their different thresholds of motion and settling velocities. Bedload material almost always displays a
Fig. 10. Mosaic of satellite images of the tide-dominated Mankyung and Dong jin estuaries (Saemankum estuary, South Korea) showing shore-normal, elongate tidal bars. For more information on this system, seePark et al. (1995).
142 R.W. Dalrymple, K. Choi / Earth-Science Reviews 81 (2007) 135–174
residual or net movement in the direction of the fastest current (= the“dominant”current), whereas the direction of transport of suspended sediment is much more strongly influenced by the slow, residual circulation that results from density differences between the fresh and saline water (i.e., the“estuarine circulation”that occurs in both estuaries and deltas; cf.Dyer, 1995, 1997). As a result, bedload and suspended load can move in different directions in the same area (e.g., Culver, 1980). See Dalrymple and Choi (2003) for a more comprehensive examination. The following discussion focuses primarily on the transport pathways of sand-
sized material; the fate of the suspended sediment will be considered in a later section.
In the river-dominated portion of the fluvial–marine transition, the net water and sediment movement (both bedload and suspended load) is directed seaward, whereas in the tide-dominated portion the direction of net (residual) movement may be either seaward or landward, with the resulting development of“mutually evasive” transport pathways (i.e., adjacent areas with oppositely directed net transport; see more on this in the next section). However, deformation of the incoming tidal wave in shallow water, which occurs because the
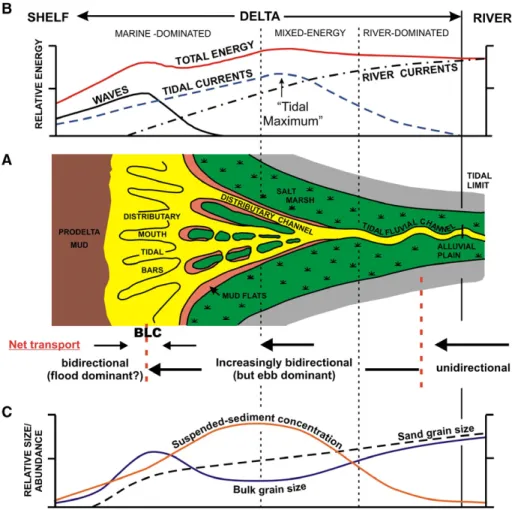
Fig. 11. (A) Schematic map of a tide-dominated delta (sensu lato), based loosely on the Fly River delta, Papua New Guinea. Note the funnel shape, the separation of distributaries by islands that are vegetated in humid climates, the absence of the“straight”-meandering-“straight”channel geometry that characterizes tide-dominated estuaries (Fig. 9), the presence of elongate tidal bars in the seaward part, and the fringing muddy tidal flats and salt marshes. (Note that the mud flats and salt marshes are replaced with mangroves in tropics settings). A schematic cross section of such a delta is shown inFig. 7. (B) Longitudinal variation of the intensity of the three main physical processes, river currents, tidal currents and waves, through a tide- dominated delta. The general patterns are the same as those for estuaries (Fig. 9B), except that there is greater overall influence of the river. As a result, the bedload convergence (BLC) is hypothesized to occur in the distributary-mouth-bar area (Dalrymple et al., 2003). However, because there are very few, well-described examples of tide-dominated deltas, the precise positioning of the curves relative to the morphological zonation is not as certain as is the case for estuaries. (C) Longitudinal variation of: the mean grain size of the sand fraction, the suspended-sediment concentration (which corresponds in a general way with the thickness of individual, slack-water mud drapes) and the“bulk”grain size of the resulting deposits (essentially the sand:mud ratio). See text for additional discussion.
trough of the wave experiences greater frictional slowing than the crest, which in turn causes the flood tide to be of shorter duration and have higher current speeds than the ebb tide, leads to a tendency for flood dominance and a net landward-directed transport of bed material (i.e., sand) in the seaward parts of estuaries and deltas.
Thus, all tide-dominated systems contain a“bedload convergence”(BLC; cf. Johnson et al., 1982) that lies between an inner, fluvially dominated portion that has net seaward-directed transport, and an outer, tide- dominated portion that has net landward-directed transport (Figs. 9B, 11B and 13). The location of the bedload convergence differs between estuaries and deltas: in tide-dominated estuaries, the convergence lies landward of the main coastline, in the middle part of the estuary (Figs. 9B and 13; cf.Dalrymple et al., 1992);
whereas, in deltas, the convergence appears to lie within the distributary-mouth-bar area (Fig. 11B; Dalrymple et al., 2003).
3.1.4. Wave action
Although this report focuses on tide-dominated and mixed-energy systems in which tidal currents play the predominant role in sediment transport and deposition, wave action cannot be ignored at the seaward end because of the large, open-water fetch that characterizes the marine basin. (Only in relatively constricted seaways where the fetch is limited will wave action be low to negligible). Wave energy at the bed will increase
landward from the shelf toward the shallower water at the coastline (Figs. 2, 9B and 11B), reaching a maximum at the mouth of the estuary or delta. Because of the open-mouth character of tide-dominated systems, wave energy will penetrate some distance into the estuary or delta, but frictional dissipation in shallow
Fig. 12. Block diagram illustrating the various sub-environments in a transgressing barrier island-lagoon system, and the stratigraphic succession that is generated as the barrier migrates landward. Note that the preserved succession lying between the sequence boundary and the ravinement surface consists entirely of tidal facies, because of the erosion of the wave-generated barrier island. Despite the prevalence of tidal deposits, the environment as a whole was wave dominated. AfterReinson (1992).
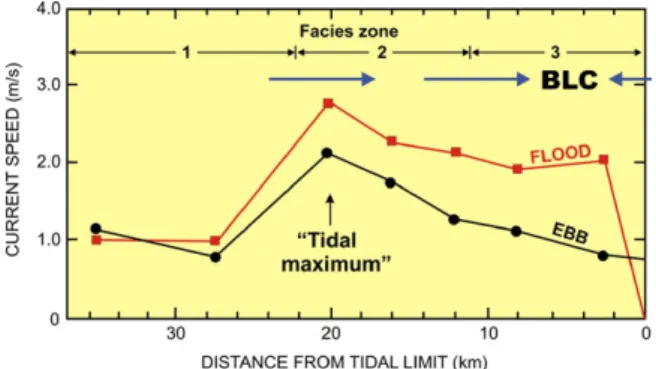
Fig. 13. Longitudinal variation of tidal-currents speed in the Cobequid Bay-Salmon River estuary, Bay of Fundy. All data points represent the averages of measurements taken at several locations. Note that both the flood and ebb currents are fastest at the 20 km point (= the “tidal maximum”); in other words, the system is“hypersynchronous”(cf.
Fig. 4). Note also that the average speed of the flood currents exceeds that of the ebb currents throughout most of the estuary, causing a
“flood dominance”and a net, landward transport of sand. Only in the very headward part of the estuary, where ebb currents are supple- mented by river flow, does ebb dominance occur. The net result is the development of a bedload convergence (BLC) at the 2 km point. (In estuaries with a larger river, the BLC lies proportionately further seaward than in this example). SeeFig. 27for the location of the facies zones. AfterDalrymple et al. (1991).
144 R.W. Dalrymple, K. Choi / Earth-Science Reviews 81 (2007) 135–174
water will cause the waves to decrease in importance in a landward direction. Thus, the mouth of tide-dominated estuaries and deltas will experience more wave action than areas either seaward or landward. Whether or not wave action dominates locally over tidal currents in this area depends on such factors as the climatic belt and the intensity of onshore-directed winds, the size of the open- water fetch, and the intensity of the tidal currents that vary as a function of the tidal prism (i.e., the area within the estuary or delta landward of the cross section of interest that experiences tidal water-level fluctuations, multiplied by the average tidal range in that area; cf.
Dalrymple, 1992).
3.2. Chemical processes
The mixing of fresh water and salt water is a fundamental aspect of all estuaries and deltas, with the salinity increasing monotonically from the river to the sea (Figs. 15, 16, 17 and 18; see alsoFenster et al. (2001, their Fig. 6) andHughes et al. (1998, theirFig. 4) for additional examples). The distance over which the transition occurs (i.e., the steepness of the longitudinal salinity gradient) depends on the intensity of tidal mixing and the amount of river discharge: the length of the zone of brackish water may range from only a few kilometres (Yeo estuary— 2 km, Uncles et al., 2002; Somerset Axe estuary — 2.9 km,Uncles et al., 2002; Squamish River estuary— 5.5 km,Gibson and Hickin, 1997) to many tens or even hundreds of kilometres (Rajang River delta —60 km, Staub et al., 2000; Gironde estuary—65 km,Allen, 1991;
Hawkesbury River estuary—75 km,Hughes et al., 1998;
Fly River delta — 80–100 km, Alongi et al., 1992;
Wolanski et al., 1995; Scheldt estuary—110–120 km, Muylaert et al., 2005; Gambia River estuary — 200–
250 km,Sanmuganathan and Waite, 1975). The landward limit of detectable salt-water influence (i.e., a salinity of ca 0.1‰) lies seaward of the tidal limit, regardless of how this is defined (cf.Fig. 14), in all cases (e.g.,Allen et al., 1980; Castaing and Allen, 1981). The limit of salt-water intrusion is pushed seaward at times of high river discharge, when salinities throughout the estuary or delta are reduced, whereas salt water penetrates fur- ther and salinities are higher when the river discharge is low.
Within the zone of mixing, the vertical gradient of salinity is dependant on the intensity of turbulence, which increases as the strength of the river and tidal currents increases. In most tide-dominated settings, turbulence is sufficient to cause salinity to be vertically homogeneous, but in areas or at times (e.g., neap tides) with weaker tidal currents, salinity-induced density stratification can occur, leading to the development of“estuarine circulation”in which denser, more saline bottom water tends to move landward at the bottom of the channel(s), while fresher water moves seaward at the surface (Fig. 19) (Dyer, 1997;
Dalrymple and Choi, 2003; Harris et al., 2004). [In arid coastal areas, evaporation within an estuary can produce elevated salinities, causing the development of an inverse circulation pattern: a wedge of dense, hypersaline water flows seaward along the bottom, while lighter, normal- marine water flows into the estuary at the surface (Lennon et al., 1987). Such estuaries are called“inverse estuaries”
by oceanographers. They are not considered further here.]
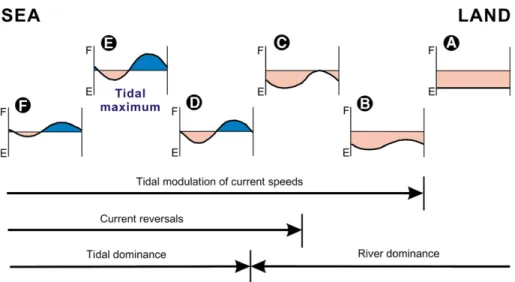
Fig. 14. Simplified schematic representation of the change in the nature of current patterns over a tidal period in the transition for purely river flow at right, to purely tidal flow in the sea at left. E = seaward-directed (river and/or ebb) currents; F = landward-directed (flood) currents. See text for additional discussion.
The salinity of the water within the marine basin at the mouth of the estuary or delta (i.e., the absolute value of the salinity at the seaward end ofFigs. 15 and 18) is typically normal marine (i.e., 35‰). However, if the river discharge is large and/or the marine basin has a distant or restricted connection with the world ocean, salinity within the basin may be depressed and brackish, either in nearshore areas only, or more generally. For example, the area offshore of the Amazon River is brackish for many hundreds of kilometres from the river mouth, especially to the northwest, in the direction of flow of the shelf currents (Gibbs and Konwar, 1986), while the entire Cretaceous Western Interior Seaway of the United States and Canada is thought to have been brackish at certain times (Slingerland et al., 1996).
3.3. Biological processes
As noted above, the fluvial-to-marine transition is subjected to brackish-water conditions. This area also experiences extremely variable conditions because of
changes in salinity over individual tidal cycles and seasonally in response to variations in river discharge (Figs. 15 and 18). In addition, there is frequent sediment disturbance (deposition or erosion) by tidal currents, river currents and/or waves, plus very high suspended- sediment concentrations in the water column in some areas (see more on this below). Within the intertidal zone, organisms must also cope with periodic expo- sure to the atmosphere and the associated temperature changes.
As a result, relatively few organisms are adapted to live in this hostile environment. Indeed, the number of species present (i.e., the species diversity) is generally lowest in areas with salinity levels of ca. 1–5‰ (Fig. 20), with species diversity increasing outward toward the sea (Figs. 16 and 17) and landward into fresh water (although the freshwater area does not have as high a diversity as the marine part of the system). The organisms that do live within the fluvial–marine transition are generally those that are adapted to life in salt water and display behaviours that protect them from these harsh and highly variable
Fig. 15. (A) Schematic facies map of a tide-dominated estuary. (B) Longitudinal variation of salinity through a tide-dominated estuary. The shaded zone is an indication of the temporal variability of salinity that occurs because of changes in the river discharge: the salinity gradient migrates up estuary as the river discharge decreases and down estuary when the river discharge is higher. (C) Longitudinal variation of: the diversity (number of species) of benthic invertebrate organisms, their size (i.e., the size of the burrows) and the relative number of individuals per square meter. Trends based on general observations reported byBuatois et al. (1997),Pemberton et al. (2001)andMacEachern et al. (2005b). See text for more discussion.
146 R.W. Dalrymple, K. Choi / Earth-Science Reviews 81 (2007) 135–174
conditions. Thus, they tend to be opportunists, with the capability to colonize surfaces quickly when conditions are suitable. They have rapid reproduction and typically occur in large numbers, commonly in near mono-specific assemblages. Most organisms live within the sediment rather than on the surface, and adopt a variety of feeding strategies because of the variable nature and location of food resources (i.e., suspension feeding, surface grazing and deposit mining). Among the various phyla of marine invertebrates, the molluscs (e.g., bivalves and gastropods) are most tolerant of“stressed”conditions; oysters are one such group. Furthermore, because of the stresses that they encounter, these organisms tend to be smaller in size than the same species would be in fully marine settings.
Readers are referred toBuatois et al. (1997),Pemberton et al. (2001)andMacEachern et al. (2005b,c)for more details.
4. Sedimentological consequences
The operation of the above processes produces a variety of observable sedimentological consequences that can be used to determine the relative location at which a given deposit formed in the fluvial–marine transition.
4.1. Channel-bar morphology and deposits
Except for continental shelves, all tidal environments are channelized. In this, tidal environments are very similar to meandering fluvial systems, with a prepon- derance of laterally accreting channel margins and vertically accreting “overbank” (i.e., tidal flat and salt marsh) areas. (Braided tidal-channel networks do exist (e.g., the braided sand-flat environment of Dalrymple et al., 1992), but are not common. Braided rivers may have tidal influence at their mouth, but the zone where tidal and river processes interact should be short because of the steep gradient of most braided rivers. Thus, most tidal deposits were probably formed by meandering channels). As will be argued below, even the apparently isolated, mid-channel, elongate tidal bars that characterize tide-dominated environments have more in common with meandering rivers and usually generate erosionally based, upward fining successions that will most likely be interpreted as channel and/or channel-bank deposits in ancient successions.
Observations of many modern tidal environments indicate that the geomorphology of channel-bar systems
Fig. 16. Longitudinal variation of salinity (vertical bars represent the range of values due to variations in river flow and tidal flux), the number of species of benthic invertebrates, and the number of individuals per square meter through the brackish-water zone in the Ogeechee River estuary, Georgia. AfterHoward et al. (1975). Map and lower panel reproduced by permission of E. Schweizerbart'sche Verlagsbuchhandlung (Ngele u.
Obermiller) OHG Science Publishers—http://www.schweizerbart.de.
Fig. 17. Longitudinal variation of salinity and number of species of benthic invertebrates in the Cobequid Bay–Salmon River estuary, Bay of Fundy. See Fig. 27for the location of the facies zones. After Dalrymple et al. (1991).
(including channel width, channel curvature and the types of bars present) changes in a systematic manner through the fluvial–marine transition. The primary control on these changes is the predictable seaward increase in the flux of water through the channels.
The amount of river discharge increases down the fluvial system as a result of the addition of runoff from tributary drainage basins and local precipitation. However, in the fluvial–marine transition, it is the tidally generated water movements that exert the major control on the
Fig. 18. (A) Schematic map facies map of a tide-dominated delta (sensu lato). (B) Longitudinal variation of salinity through a tide-dominated delta.
As in estuaries, the salinity gradient is displaced seaward when the river discharge is high, and landward when river discharge is low. In addition, there may be significant variation between the various distributary channels:“active”channels with high river discharge will contain water with lower salinity than“inactive”distributaries with minimal river input (cf.Wolanksi et al., 1997). The zone of brackish water is shown as being displaced seaward relative to that in estuaries (cf.Fig. 15), on the assumption that deltas have an overall greater river influence than estuaries. (C) Longitudinal variation of: the diversity (number of species) of benthic invertebrate organisms, their size (i.e., the size of the burrows) and the relative number of individuals per square meter. Trends based on general observations reported byBuatois et al. (1997),Pemberton et al. (2001)andMacEachern et al.
(2005b). See text for more discussion.
Fig. 19. Formation of a salt wedge, as shown by the inclined salinity contours (dashed lines) in the zone of mixing between fresh water and seawater.
The resulting, residual, density-driven circulation (outward flow in the surface layer; landward flow near the bed), coupled with the effects of flocculation, leads to the trapping of f ine-grained material near the tip of the salt wedge and the development of a turbidity maximum where suspended- sediment concentrations (SSCs) are elevated. SSC values may exceed 10 gL−1near the bed beneath the turbidity maximum, producing fluid-mud bodies in the bottoms of the channels. AfterDalrymple and Choi (2003). Reproduced with kind permission of Springer Science and Business Media.
148 R.W. Dalrymple, K. Choi / Earth-Science Reviews 81 (2007) 135–174
magnitude of the water flux. This tidal flux, which is termed the“tidal prism”, increases seaward as a result of the progressive increase in the area to be flooded and drained on each tide. Consequently, all channels with a strong tidal influence show a seaward increase in their cross-sectional area. In general, water depth does not increase significantly, so most of the increase in cross- sectional area is accomplished by a seaward increase in the width of each channel. Theoretical studies (Pillsbury, 1939; Myrick and Leopold, 1963) and morphological observations (e.g., Wright et al., 1973;Figs. 5 and 21) show that this seaward widening is exponential and is responsible for the classic“funnel-shaped” geometry of tide-dominated systems such as the Thames estuary and the Fly River delta. However, a similar funnel-shaped morphology typifies all tidal-flat and salt-marsh channels, even in microtidal and mesotidal areas (Figs. 1,5,22 and 23).
Almost all fluvial and tidal channels are curved (i.e., they display meander bends) to a greater or lesser degree. Two, inter-related factors appear to influence the tightness of the bends. Wide channels with a large discharge do not bend as tightly as narrow channels with a small discharge; therefore, the seaward parts of tide- influenced systems generally have much straighter channels than are found further landward. In addition, above some critical slope, steeper hydraulic gradients (i.e., steeper water-surface slopes), which are generally
associated with faster currents, produce straighter channels (Schumm and Khan, 1972). Thus, rivers tend to become more sinuous as one moves from steeper inland areas toward low-gradient coastal areas. Similar- ly, tidally influenced channels become more sinuous as the tidal current speeds decrease in a landward direction.
No quantitative data exist on these trends, but they are readily observable in satellite images and maps (Figs. 1, 22, 23, 24 and 25). Such observations also indicate that estuaries and deltas have somewhat different channel patterns. Within tide-dominated estuaries, the tightest meander bends universally occur at the location of the bedload convergence, producing the “straight”-mean- dering-“straight”channel pattern (Fig. 9A) described by Dalrymple et al. (1992). Examples that show this pattern include the Cobequid Bay–Salmon River estuary (Bay of Fundy;Fig. 27), the Severn River estuary, the Thames estuary, and the Ord River estuary (Fig. 21A), and the same pattern has been documented in a small tidal channel in the microtidal Venice lagoon (Solari et al., 2002, theirFig. 2). The tightly meandering zone appears to represent the site of the lowest hydraulic energy, located between the fluvially and tidally dominated parts of the estuary (Dalrymple et al., 1992). Within tide- dominated deltas, the radius of curvature is never as tight as that seen in the tightly meandering portion of estuaries and the“straight”-meandering-“straight”chan- nel pattern does not occur. Instead, the channels become
Fig. 20. Classification of salinity levels and variation of species diversity through the freshwater to seawater transition. Note that brackish-water environments have low taxonomic diversity and are characterized by a mixedSkolithos–Cruzianaichnofacies. AfterBuatois et al. (1997). Courtesy of SEPM (Society for Sedimentary Geology).
progressively less sinuous from the river toward the sea (Fig. 11A; Dalrymple et al., 2003). Examples that show this pattern include the Fly River delta (Fig. 21F), the Colorado River delta (Fig. 25), the Yangtze River delta (Fig. 26), the Ganges–Brahmaputra River delta, and the Amazon River delta.
The longitudinal changes in channel width and curvature have a strong influence on the nature of the bars that are developed. In the relatively narrow and more sinuous channels that characterize the inland parts of tidal systems, the bars are bank-attached point bars or alternate bars (cf.Barwis, 1978) with no separation of the flow into mutually evasive flood-and ebb-dominated channels (Van den Berg et al., in press). By contrast, at the seaward end of the system where the channels are wide and relatively straight, elongate tidal bars (also called tidal sand ridges or tidal sand banks in shelf areas) are the main within-channel morphological elements, occurring also in the distributary-mouth-bar area of
deltas. SeeDalrymple and Rhodes (1995)for additional discussion of barforms in tidal environments.
The transition between these two end-member bar types occurs gradually as the channel widens and straightens. In landward areas where the flow is overall ebb dominated, the downstream asymmetry that typifies meander bends in rivers (cf. Fagherazzi et al., 2004) causes the downstream portion of the point bar to be sheltered from the ebb tide, but to experience the full force of the flood tide. As a result, a flood barb (a headward- terminating,“blind”flood channel;Robinson, 1960) may be developed, that is separated from the main ebb channel by a short, elongate tidal bar (Fig. 26A). As one moves seaward into areas with straighter channels, the elongate tidal bars become longer, but remain attached to one or other of the channel banks (Fig. 26B). The channel-bar morphology in Cobequid Bay, Bay of Fundy, has this fundamental morphology (Fig. 27; Dalrymple et al., 1991). However, once the channel width exceeds
Fig. 21. Six examples of coastal systems that display a funnel-shaped geometry (i.e., the width increases exponentially with distance seaward): (A) Ord River, Australia; (B) Khor Abdullah, Iraq; (C) Irrawaddy River, Myanmar (Burma); (D) Hoogly River, India; (E) Cua Soirap, Vietnam; (F) Fly River, Papua New Guinea. Note that in most of the systems, the sinuosity of the channel increases as it becomes narrower. (A–E) Modified after Wright et al. (1973)and reproduced with permission of the University of Chicago Press.
150 R.W. Dalrymple, K. Choi / Earth-Science Reviews 81 (2007) 135–174
approximately 7–10 km, bars may become detached from the banks. Two of these may connect to form a U-shaped bar (Fig. 26C), or they may form part of larger bar complexes (Fig. 26D). In unconfined settings beyond the seaward limit of estuarine or deltaic distributary channels (i.e., in distributary-mouth-bar area or on the shelf), elongate tidal bars occur as relatively isolated, straight features (Wright et al., 1973; Kenyon et al., 1981;
Belderson et al., 1982; Harris, 1988).
Elongate tidal bars may become dissected by smaller channels, which cut obliquely across the bar (Fig. 26B, D). Such channels are called“swatchways”(Robinson, 1960). They occur where the bars have grown upward sufficiently that they impede the required cross-bar tidal flow (Huthnance, 1982; see discussion in Dalrymple and Rhodes, 1995). The upward growth of elongate bars is limited by the water depth: bars that have not grown upward enough to be limited in this way tend to be narrow and to have a relatively sharp crest, whereas depth-limited bars expand laterally and develop broad, flat tops (Fig. 26D;Harris, 1988).
Based on the available evidence, it appears that all elongate tidal bars migrate laterally (i.e., transverse to the
Fig. 22. Satellite image of the Irrawaddy River delta, Myanmar (spring tidal range 2 m). The active distributary lies in the upper left corner whereas the remainder of area is“inactive”delta plain; compare with Fig. 1. Note that the channels become progressively narrower and more sinuous in a landward direction. For more information on this system, seeRodolfo (1975)andWoodroffe (2000). Courtesy of NASA.
Fig. 23. Satellite image of Arcachon estuary, France (spring tidal range 4.9 m). Although macrotidal at spring tides, the very large waves from the Atlantic Ocean have produced a barrier across its mouth (at left side of the image). Note that the seaward parts of these tidal channels are wider and straighter than the more landward parts. For more infor- mation on this system, seeFenies and Faugères (1998). Courtesy of SEPM (Society for Sedimentary Geology).
Fig. 24. Satellite image of Yangtze River delta, China (spring tidal range 4.9 m). Note the seaward widening and straightening of the channels, although the funnel shape is less pronounced than in some other systems because of the large river discharge. For more information on this system, seeHori et al. (2002)andLi et al. (2002). Courtesy of NASA.
Fig. 25. Satellite image of Colorado River delta, Mexico (spring tidal range 9 m) showing the seaward straightening of the channels. For more information on this system, seeCarriquiry and Sánchez (1999) andMeckel (1975). Courtesy of NASA.
prevailing currents;Houbolt, 1968; Harris, 1988; Dalrym- ple and Zaitlin, 1994; Dalrymple and Rhodes, 1995;
Dalrymple et al., 2003), not in the direction of the dominant current as suggested by theMutti et al. (1985) model for“tidal bars”(Fig. 28; see review inDalrymple (1992)). Thus, the behaviour of tidal bars is similar to point bars. Such lateral migration happens for two reasons. First, tidal bars commonly occur on the inside of a channel bend and thus occupy a location analogous to that of a point bar, with deposition occurring on the side of the bar adjacent to the channel as the channel migrates away from it. Second, because elongate tidal bars are orientated at a slightly oblique angle to the predominant currents, their“stoss”
side is eroded by the dominant (stronger) current, whereas deposition occurs on the opposite “lee” side, thereby causing the bar to migrate in a highly oblique, downflow direction (Fig. 29). However, because these bars are nearly parallel to the current, the resulting motion generates lateral-accretion deposits. As discussed by Dalrymple (1992), the depositional side of elongate tidal bars is the
site of local dominance by the subordinate current, leading to the preferential preservation of structures generated by the regionally weaker flow (Fig. 29). It may be that such a counter-intuitive paleocurrent pattern is also possible in tidal point bars (Fig. 30), as noted in a modern example by Choi et al. (2004). If, indeed, there is preferential preservation of the subordinate paleocurrent direction, then great care must be exercised when reconstructing the directions of net sediment movement throughout the system (cf.Figs. 9 and 11).
The lateral-accretion bedding formed by the migration of both tidal point bars and elongate tidal bars will be erosively based, because of the migration of the thalweg of the adjacent channel. Because water depth and current speed both decrease upward from the thalweg toward the bar crest, set thicknesses should thin upward and the grain size should fine upward. (We believe that overall upward coarsening is rare and may occur most commonly in areas where fluid muds (see more below) are developed in the channel bottom (Dalrymple et al., 2003)). The smaller
Fig. 26. Longitudinal variation in the morphology of elongate tidal bars (crestlines shown by heavy dashed lines) in the Fly River and its delta (sensu lato). (A) Meander bend in the tidal-fluvial reach. The main channel is ebb dominated (black arrows); the only flood-dominated area (white arrows) is immediately adjacent to the downstream end of the tidal-fluvial point bar. In this location, a headward-terminating flood barb has been formed, separated from the main channel by an elongate tidal bar (heavy dashed line). (B) Long, straight tidal bar in a distributary in the inner part of the delta plain. The straighter nature of the channel here allows the bar to be longer than in (A). However, the bar remains attached to the channel bank at its landward end, just off the left edge of the figure, separated from the bank by a flood barb. The low areas in the bar crest are swatchways. (C) U-shaped tidal bar (two, connected, elongate tidal bars) in a distributary channel, outer part of delta plain. Because the channel is much wider here, these bars are detached from the channel banks. (D) Multiple, elongate bars in the distributary-mouth-bar area. Note the distinction between the strongly accretional, broad, flat-topped bar in line with Kiwai Island, and the narrower elongate bars elsewhere. The channel between Kiwai Island and the broad bar to the southeast is a swatchway. AfterDalrymple et al. (2003,Fig. 5). Courtesy of SEPM (Society for Sedimentary Geology).
152 R.W. Dalrymple, K. Choi / Earth-Science Reviews 81 (2007) 135–174
Fig. 27. Facies distribution in the Cobequid Bay–Salmon River macrotidal estuary, Bay of Fundy (maximum spring tidal range 16.3 m). Facies zone 1, elongate sand bars (medium to coarse sand);
zone 2, upper-flow-regime sand flats (fine sand); and zone 3, tidal-fluvial transition. The elongate sand bars in the outer part of the estuary occur in two rows (termed“bar chains”byDalrymple et al., 1991; red dashed lines) that attach to the shorelines at their landward ends. These bar chains are dissected into smaller, individual bars by swatchways. The erosional foreshores bordering zone 1 are not unique to Cobequid Bay and also occur in the Severn estuary (Allen, 1987). AfterDalrymple et al. (1991).
153Dalrymple,K.Choi/Earth-ScienceReviews81(2007)135–174
cross beds may be directed obliquely upslope, because of the tendency for the currents to flow obliquely across the crest of the bar. Both types of bar (i.e., tidal point bars and free-standing elongate bars) may develop inclined heterolithic stratification (IHS; Thomas et al., 1987), although bars in areas with low suspended-sediment concentrations (e.g., at the seaward end of estuaries or in areas near the inland limit of tidal influence; see more below) are less likely to display this style of sedimentation because of lower suspended-sediment concentrations;
instead, they will consist of stacked dune cross beds with gently inclined set boundaries (Dalrymple and Rhodes, 1995). IHS deposits formed in the inner part of the tidal- fluvial transition are more likely to contain coarse-grained layers formed by river floods, because the influence of river floods decreases seaward. However, the only fundamental difference between the deposits of elongate tidal bars and those formed by tidal point bars will be the amount of curvature: the lateral-accretion deposits formed by point bars will be moderately to highly curved, whereas elongate tidal bars should generate more or less
straight lateral-accretion bedding. Thus, the deposits of all tidal bars will appear to be channel or channel-bank deposits, regardless of whether the bar was bank-attached or free standing in the middle of the channel.
Fig. 28. Upward-coarsening facies model for features in the Ager Basin (Eocene), northern Spain, whichMutti et al. (1985)interpreted to be a“tidal bar”. The vertical succession is typically about 5 m thick.
However, as discussed in the text, tidal bars should generate lateral- accretion deposits, not the forward-accretion coset (smaller cross beds dipping in the same direction as the more gently dipping, master bedding planes) shown here. The succession illustrated is more likely to be the deposit of a compound dune or delta.
Fig. 29. Schematic diagram illustrating the oblique cross-bar flow over an elongate tidal bar. The resulting migration of the bar is oblique, but predominantly transverse to, the direction of the regionally dominant (stronger) current and to the bar crest. This leads to the preferential preservation of the down-current flank of the bar, where sedimentation is dominated by the subordinate current. As a result, the small cross beds within the large-scale lateral-accretion deposits are likely to be oriented in the direction of the regionally weaker current! AfterDalrymple (1992).
Fig. 30. Likely flow patterns of the dominant and subordinate currents in a meandering tidal channel. Flow in both directions is hypothesized to be out of phase with the channel sinuosity and with the current in the opposite direction. The dominant current is responsible for the obliquely down-current migration of the point bars, as indicated by the short black arrows, because the point-bar surfaces (indicated by stars) are in a low- speed zone at this time. By contrast, the subordinate current is stronger on the point-bar surface than it is on the cut-bank side of the channel. This may cause the preferential preservation within point bars of cross stratification dipping in the direction of the subordinate current. The deposits of the channel thalweg may preserve the dominant flow direction. This pattern of dune migration has been documented on a tidal point bar in the Han River (Choi et al., 2004), but the generality of this pattern remains to be determined. FromMutti et al. (1985).
154 R.W. Dalrymple, K. Choi / Earth-Science Reviews 81 (2007) 135–174
4.2. Cross-bedding styles and paleoflow indicators The detailed characteristics of the cross stratification produced by the ripples and dunes on the channel floor and banks will reflect the longitudinal variations in the time-velocity characteristics of the combined river and tidal currents (Fig. 14), whereas their orientation indicates the direction of residual sand transport at the site in question. As a result, cross stratification provides a powerful means to reconstruct the nature of the current regime and, hence, to determine where within a system the deposits in question may have formed.
In the truly fluvial portion of river, above limit of tidal influence (Fig. 14A), all of the ripples and dunes migrate seaward and paleocurrents are unidirectional toward the sea, with a degree of dispersion of orientation that reflects the sinuosity of the fluvial channel (Collinson, 1971).
As one moves seaward into the region that experiences weak tidal modulation of river flow (Fig. 14B), indicators of tidal action may not be evident because the flow remains unidirectional. The regular variations in current speed that occur in this region may be expressed as regular variations in the grain size of adjacent laminae: medium to coarse sand in the laminae deposited by the stronger currents;
finer sand in the laminae deposited by the slower currents (Piret Plink-Björklund, pers. comm., 2003). While such a regular alternation of grain sizes might be caused by tidal velocity variations, similar structures can be formed by the periodic arrival of superimposed ripples at the dune's brink (cf. McCabe and Jones, 1977). In order to interpret confidently such coarse–fine alternations as tidal, it would be necessary to document the existence of tidal rhythmicity (i.e., tidal bundling) in the form of thick–thin alternations (due to the diurnal inequality) and/or neap-spring changes in lamina thickness (cf. Dalrymple, 1992; see De Boer et al. (1989) for a method of assessing the statistical significance of possible tidal-rhythmite series).
Still further seaward, as the strength of the tidal currents increases, the appearance of slack-water periods (Fig. 14C, D) provides the first opportunity for the deposition of mud drapes within cross beds and/or between sets of ripple cross lamination. The relatively low suspended-sediment concentration (SSC) that occurs in this region (see more below) causes these drapes to be quite thin (perhaps less than 1 mm). The drapes may also be relatively silty and/or rich in terrestrial organic material or mica (Van den Berg et al., in press). The mud drapes in the tidal-fluvial transition zone may be single (Fig. 14C) or double (Fig. 14D), depending on whether there are one or two slack-water periods, the latter occurring further seaward than the former. The development of these mud drapes may also be influenced by the seasonal variation in river discharge that affects this area: during high river flow, the turbidity maximum (see below) will be pushed further seaward, thereby inhibiting the accumulation of mud drapes, whereas mud drapes may be formed more readily during periods of low river discharge when peak current speeds are less (cf.Lettley et al., 2005). (Mud drapes may also be present in the purely fluvial section up river, but they would have formed during season-long periods of low river flow and would probably be thicker and/or more composite in character than the drapes formed during a single, tidal slack-water period that lasts only a few tens of minutes (Smith, 1987; Thomas et al., 1987; Shanley et al., 1992; Lanier et al., 1993)).
Indicators of current reversals (cf.Fig. 14D–F) should begin to appear slightly further seaward than evidence of slack-water periods. The first evidence of such reversals might be landward-directed current ripples that are generated by the weak flood currents that would occur just seaward of the limit of flow reversals. (Note: One must be careful not to mistake the counter-current ripples formed by the flow-separation vortex in the troughs of dunes for those formed by the flood-tidal currents. The latter ripples may climb high up the dune's lee face (Van
Fig. 31. Internal structures of a small compound dune. In this example, the master bedding planes dip in the ebb direction, at angles generally less than 15°. Most of the angle-of-repose cross bed at the top will be eroded when the next superimposed dune arrives at the brink. Note the abundance of herringbone cross-stratification. r = reactivation surface formed by the last flood (subordinate) tide. This is a complex variant of the idealized structure shown inFig. 32D: the added complexity is caused by the selective preservation of subordinate-current dunes because of the strongly depositional nature of the lee face of the compound dune. AfterDalrymple (1984).
den Berg et al., in press) rather than being restricted to the lower parts of the cross beds as counter-current ripples are.) Reactivation surfaces caused by tidal-flow reversals
(Klein, 1970; De Mowbray and Visser, 1984) should also appear first in this same zone. (Note: Reactivation surfaces can also be formed by river-stage variations
156 R.W. Dalrymple, K. Choi / Earth-Science Reviews 81 (2007) 135–174