OCS Study
BOEMRE 2010-042
Coastal Marine Institute
Fact Book: Offshore Oil and Gas Industry
Support Sectors
OCS Study
BOEMRE 2010-042
Coastal Marine Institute
Fact Book: Offshore Oil and Gas Industry Support Sectors
Author
David E. Dismukes
December 2010
Prepared under BOEMRE Cooperative Agreement 1435-01-99-CA-30951-85248 (M07AC12508) by
Louisiana State University Center for Energy Studies Baton Rouge, Louisiana 70803
Published by
DISCLAIMER
This report was prepared under contract between the Bureau of Ocean Energy Management, Regulation and Enforcement (BOEMRE) and Louisiana State University’s Center for Energy Studies. This report has been technically reviewed by the BOEMRE, and it has been approved for publication. Approval does not signify that the contents necessarily reflect the views and policies of the BOEMRE, nor does mention of trade names or commercial products constitute endorsement or recommendation for use. It is, however, exempt from review and compliance with the BOEMRE editorial standards.
REPORT AVAILABILITY
This report is available only in compact disc format from the Bureau of Ocean Energy Management, Regulation and Enforcement, Gulf of Mexico OCS Region, at a charge of $15.00, by referencing OCS Study BOEMRE 2010-042. The report may be downloaded from the BOEMRE website through the Environmental Studies Program Information System (ESPIS).
You will be able to obtain this report also from the National Technical Information Service in the near future. Here are the addresses. You may also inspect copies at selected Federal Depository Libraries.
U.S. Department of the Interior U.S. Department of Commerce
Bureau of Ocean Energy Management, National Technical Information Service Regulation and Enforcement 5285 Port Royal Road
Gulf of Mexico OCS Region Springfield, Virginia 22161 Public Information Office (MS 5034) Phone: (703) 605-6040 1201 Elmwood Park Boulevard Fax: (703) 605-6900 New Orleans, Louisiana 70123-2394 Email: [email protected] Telephone requests may be placed at
(504) 736-2519, 1-800-200-GULF, or Rush Orders: 1-800-553-6847
Fax: (504) 736-2620
CITATION
Suggested citation:
Dismukes, D.E. 2010. Fact book: Offshore oil and gas industry support sectors. U.S. Dept. of the Interior, Bureau of Ocean Energy Management, Regulation and Enforcement, Gulf of Mexico OCS Region, New Orleans, LA. OCS Study BOEMRE 2010-042. 138 pp.
ABSTRACT
The purpose of this research has been to examine the nature and trends associated with a wide range of industries and activities that support offshore oil and gas exploration, development, and production. The sectors and activities examined include: drilling contractors; underwater contractors (diving); mud, drilling, and lubricants; air transport; water transport; geophysical services; dredging; catering; workover services and environmental consulting and mitigation.
A number of issues and aspects were examined for each of these sectors that includes a basic description of the industry and the types of services provided, typical industry characteristics that includes an examination of typical facilities, the geographical distribution of the firms and their location along the Gulf of Mexico, a description of each sectors’ labor force, and identification of typical or leading firms in those particular sectors.
Each chapter includes an examination of the industry trends and outlook for that respective support sector/activity including a discussion of the impacts that hurricane activity of 2005 had on each of the various support sectors and activities.
TABLE OF CONTENTS
Page
LIST OF FIGURES ... xi
LIST OF TABLES... xiii
ABBREVIATIONS AND ACRONYMS ...xv
EXECUTIVE SUMMARY ... 1
I. DRILLING CONTRACTORS ... 5
A. Description of Industry and Services Provided ...5
B. Industry Characteristics ...5
1. Typical Facilities...5
2. Geographical Distribution...9
3. Labor Force...10
4. Labor Statistics...11
5. Typical Firms ...12
C. Industry Trends and Outlook ...14
1. Rig Count ...14
2. Rig Contractors ...16
3. Hurricane Impacts...19
4. Outlook ...21
D. Chapter Resources ...22
II. UNDERWATER CONTRACTORS ... 23
A. Description of Industry and Services Provided ...23
B. Industry Characteristics ...26
1. Typical Facilities – Diving...26
2. Typical Facilities – ROVs...27
3. Geographical Distribution...31
4. Labor Force...32
5. Typical Firms ...33
C. Industry Trends and Outlook ...35
1. Trends ...35
2. Hurricane Impacts...36
3. Outlook ...37
D. Chapter Resources ...37
III. MUDS, DRILLING FLUIDS AND LUBRICANTS ... 39
A. Description of Industry and Services Provided ...39
B. Industry Characteristics ...40
1. Typical Facilities...40
2. Geographical Distribution...44
3. Labor Force...44
4. Typical Firms ...45
TABLE OF CONTENTS (continued)
Page
C. Industry Trends and Outlook ...46
1. Trends ...46
2. Hurricane Impacts...47
3. Outlook ...47
D. Chapter Resources ...47
IV. AIR TRANSPORT ... 49
A. Description of Industry and Services Provided ...49
B. Industry Characteristics ...49
1. Typical Facilities...49
2. Geographical Distribution...50
3. Labor Force...51
4. Labor Requirements...52
5. Typical Firms ...52
C. Industry Trends and Outlook ...54
1. Trends ...54
2. Hurricane Impacts...55
3. Outlook ...55
D. Chapter Resources ...56
V. WATER TRANSPORTATION... 57
A. Description of Industry and Services Provided ...57
B. Industry Characteristics ...57
1. Typical Facilities...57
2. Geographical Distribution...59
3. Labor Force...60
4. Typical Firms ...60
C. Industry Trends and Outlook ...61
1. Trends ...61
2. Hurricane Impacts...65
3. Outlook ...66
D. Chapter Resources ...66
VI. GEOPHYSICAL SERVICES ... 69
A. Description of Industry and Services Provided ...69
B. Industry Characteristics ...73
1. Typical Facilities...73
2. Geographical Distribution...74
3. Labor Force...75
4. Typical Firms ...76
TABLE OF CONTENTS (continued)
Page
C. Industry Trends and Outlook ...77
1. Trends ...77
2. Hurricane Impacts...79
3. Outlook ...79
D. Chapter Resources ...79
VII. DREDGING... 81
A. Description of Industry and Services Provided ...81
B. Industry Characteristics ...81
1. Vessels and Methods...81
2. Geographical Distribution...86
3. Labor Force...87
4. Typical Firms ...88
C. Industry Trends and Outlook ...89
1. Trends ...89
2. Hurricane Impacts...90
3. Outlook ...91
D. Chapter Resources ...92
VIII. CATERING AND PERSONAL SUPPORT SERVICES... 93
A. Description of Industry and Services Provided ...93
B. Industry Characteristics ...93
1. Typical Facilities...93
2. Geographical Distribution...97
3. Labor Force...98
4. Typical Firms ...99
C. Industry Trends and Outlook ...100
1. Trends ...100
2. Hurricane Impacts...100
3. Outlook ...100
D. Chapter Resources ...101
IX. WORKOVER SERVICES...103
A. Description of Industry and Services Provided ...103
B. Industry Characteristics ...104
1. Typical Facilities...104
2. Geographical Distribution...105
3. Labor Force...106
4. Typical Firms ...107
TABLE OF CONTENTS (continued)
Page
C. Industry Trends and Outlook ...108
1. Trends ...108
2. Hurricane Impacts...110
3. Outlook ...111
D. Chapter Resources ...112
X. ENVIRONMENTAL CONSULTING AND MITIGATION... 113
A. Description of Industry and Services Provided ...113
B. Industry Characteristics ...115
1. Typical Facilities...115
2. Geographical Distribution...115
3. Labor Force...116
4. Typical Firms ...117
C. Industry Trends and Outlook ...118
1. Trends ...118
2. Hurricane Impacts...120
3. Outlook ...120
D. Chapter Resources ...121
REFERENCES...123
LIST OF FIGURES
Page
Figure 1. Offshore drilling platforms...8
Figure 2. Worldwide offshore mobile fleet...10
Figure 3. Number of employees, oil and gas extraction ...12
Figure 4. Worldwide rig activity...14
Figure 5. Active rigs offshore ...15
Figure 6. Average number of rigs operating in deepwater Gulf of Mexico ...16
Figure 7. Drilling contractors, number of rig owners ...17
Figure 8. Drilling contractors, owner fleet size ...18
Figure 9. Number of available and active rigs in the U.S. GOM ...19
Figure 10. Hurricanes Katrina and Rita paths, 2005...20
Figure 11. What is an ROV?...24
Figure 12. Number of employees at GOM-based diving and ROV contractors...33
Figure 13. Mud injection process...40
Figure 14. Typical dispersion of ocean discharge ...41
Figure 15. Shale shaker...43
Figure 16. Number of employees at GOM-based drilling mud and services companies ...45
Figure 17. Locations of major helicopter service providers ...51
Figure 18. Number of employees at GOM helicopter service companies ...52
Figure 19. Market shares of major helicopter service providers in the Gulf ...53
Figure 20. Existing deepwater structures and corresponding service bases ...59
Figure 21. Pending plans and corresponding service bases...60
Figure 22. GOM rig and working boat counts, 1995 to 2004...62
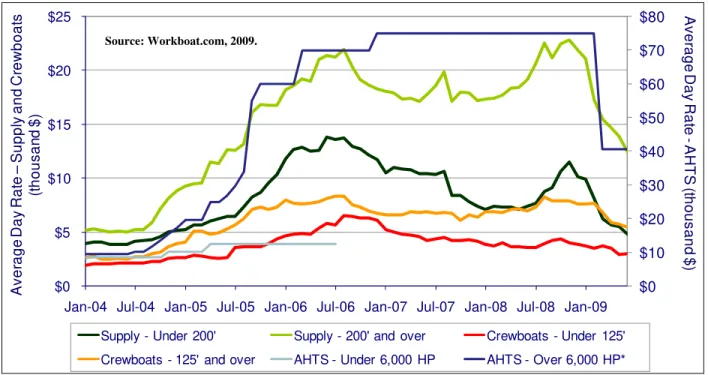
Figure 23. OSV day rates...63
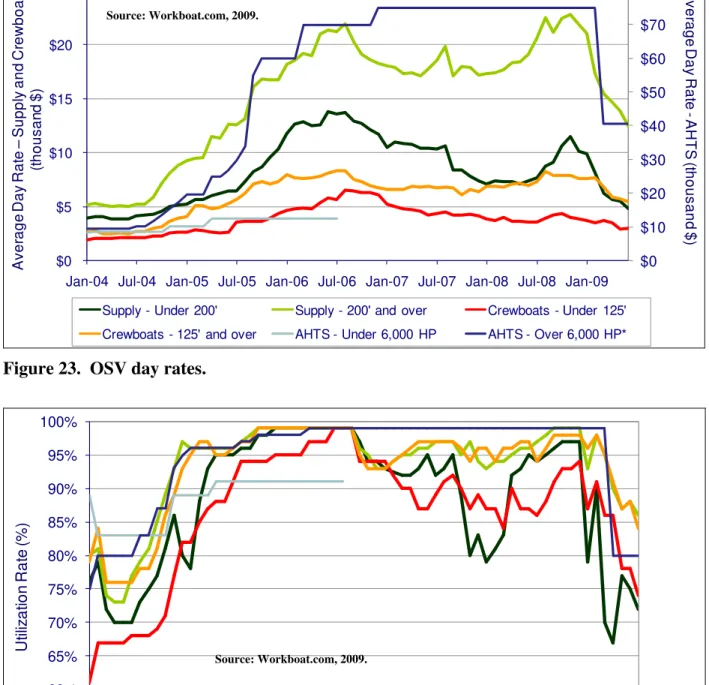
Figure 24. OSV fleet utilization rates ...63
Figure 25. Average number of deepwater rigs operating ...65
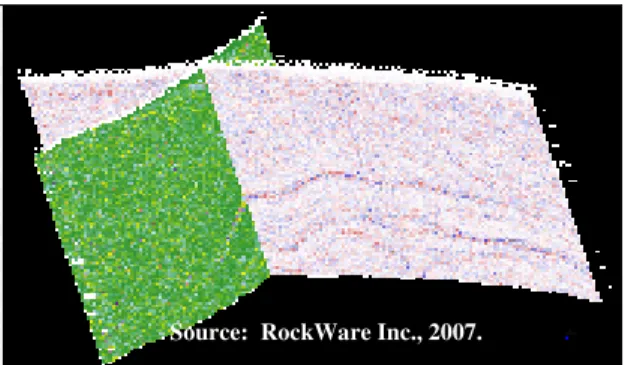
Figure 26. Two-dimensional seismic data set-pp ...70
Figure 27. Two-dimensional seismic data ...70
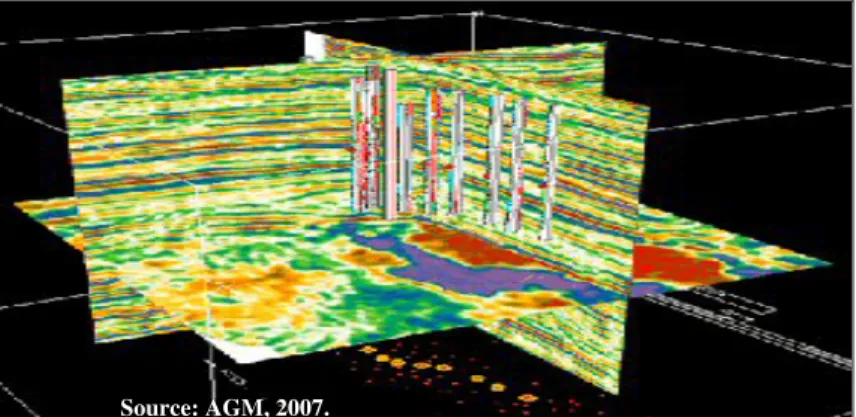
Figure 28. Interactive 3-D volume slicing of seismic data ...71
Figure 29. 3-D visualization using 3-D seismic data...71
Figure 30. Q-Marine seismic vessel...74
Figure 31. Distribution of labor among geophysical service companies registered within the five GOM states...75
Figure 32. Seismic crew survey ...78
Figure 33. Mechanical dredge...82
Figure 34. Hydraulic dredge ...83
Figure 35. Beach restoration project...85
Figure 36. Existing deepwater oil and gas supply ports ...86
Figure 37. Proposed deepwater oil and gas supply ports...87
Figure 38. Before and after photo of Katrina damage to Chandeleur Islands off coast of Louisiana ...91
Figure 39. Typical kitchen facility on large offshore platform...94
Figure 40. Offshore accommodations...95
Figure 41. Offshore floating accommodations (Floatel)...96
LIST OF FIGURES (continued)
Page
Figure 42. GOM existing supply bases and ports ...98
Figure 43. Future sites of GOM supply bases and ports...98
Figure 44. Cantilever jack-up rigs: Pride Kansas, Pride Mississippi and Pride Missouri ...105
Figure 45. Locations of workover and well services companies ...106
Figure 46. Number of employees, oil and gas extraction ...107
Figure 47. Gulf of Mexico and Southeast workover rig count (2000 to present)...109
Figure 48. Total U.S. workover rig count (2003 to present)...110
Figure 49. Gulf Coast workover rig count (2003 to present)...110
Figure 50. Typical dispersion of cuttings from drilling operations ...114
Figure 51. Geographic distribution of environmental consulting firms in the U.S. ...116
Figure 52. Number of employees at environmental services companies...118
LIST OF TABLES
Page
Table 1. Worldwide Offshore Fleet by Type ...9
Table 2. Top 25 Drillers Ranked by Footage Drilled. ...13
Table 3. Location of Major Diving and ROV Contractors ...32
Table 4. Work Class ROV Systems Operating Worldwide...34
Table 5. Summary of U.S. Offshore Requirements for Drilling Wastes ...43
Table 6. U.S. Geophysical Activity in Terms of Active Seismic Crews ...76
Table 7. Public Port Capital Dredging Expenditures by Region, 2006 ...90
Table 8. Environmental Consulting Firms by Employment (2002). ...117
ABBREVIATIONS AND ACRONYMS
2-D 2-dimensional
3-D 3-dimensional
4-D 4-dimensional
AAPA American Association of Port Authority
AAPG American Association of Petroleum Geologists AHTS Anchor Handling, Towing
and Supply vessel
AMSA Australian Marine Sciences Association
ATP airline transport pilot AUV autonomous underwater
vehicle
AVO amplitude variation with offset
BLS Bureau of Labor Statistics
CERCLA Comprehensive
Environmental Resource Compensation and Liability Act
CGG Compagnie Generale de Geophysique
CMP Coastal Management Plan CNSOPB Canada-Nova Scotia
Offshore Petroleum Board CPRA Coastal Protection and
Restoration Authority CRI cuttings re-injection CSEMI controlled seismic
electromagnetic imaging CWA Clean Water Act
CZMA Coastal Zone Management Act
DNR Department of Natural Resources
DOE Department of Energy
DOT Department of Transportation DP dynamic positioning DWMIS Drilling Waste Management
Information System EBJ Environmental Business
Journal
ECO Environmental Careers Organization
ELG effluent limitations guidelines
E&P exploration and production FAA Federal Aviation
Administration
FPSO Floating, Production, Storage and Offloading
FSV Fast Support Vessel GDP gross domestic product GOM Gulf of Mexico
HRSDC Human Resources and Skills Development Canada INC incident of non-compliance IPAA Independent Petroleum
Association of America JPL Jet Propulsion Laboratory LCA Louisiana coastal area LCROV "Low-cost" remotely
operated vehicle
LCWC Louisiana Coastal Wetlands Conservation
LNG liquefied natural gas
LOOP Louisiana Offshore Oil Port LWD logging while drilling MMcf million cubic feet MMS Minerals Management
Service
MODU mobile offshore drilling unit MPRSA Marine Protection, Research
and Sanctuaries Act MSV mini-supply vessel
MWD measurement while drilling NAICS North American Industry
Classification System NCP National Contingency Plan NPDES National Pollutant Discharge
Elimination System OBM oil-based drilling mud
OCS Outer Continental Shelf
ABBREVIATIONS AND ACRONYMS (continued)
OMSA Offshore Marine Service Association
OPA Oil Pollution Act OPEC Organization of the
Petroleum Exporting Countries
OSV offshore supply vessel PAH polynuclear aromatic
hydrocarbon
PGS Petroleum Geo-Services PHI Petroleum Helicopters,
Incorporated PIC pilot in charge
PSV platform supply vessel R&D research and development RCRA Resource Conservation
and Recovery Act RON remaining over night ROV remotely operated
vehicles
SAT saturation diving system SBM synthetic-based drilling
mud
SDWA Safe Drinking Water Act SEC Securities and Exchange
Commission
SEG Society of Exploration Geophysicists
SPCC spill prevention, control, and countermeasure SPE Society of Petroleum
Engineers
SPURV self-propelled underwater research vehicle
STCW Standards of Training, Certification and Watchkeeping SWD seismic while drilling ULCC ultra large crude carriers USACE U.S. Army Corps of
Engineers USCG U.S. Coast Guard
USDOC U.S. Department of Commerce
USDOI U.S. Department of the Interior
USEPA U.S. Environmental
Protection Agency
VLCC very large crude carrier VSP vertical seismic profile WBM water- based drilling mud WGN World Geophysical News
EXECUTIVE SUMMARY
The purpose of this research has been to examine the nature and trends in the industries and activities that support offshore oil and gas exploration, development, and production. The sectors and activities examined include: drilling contractors; underwater contractors (diving);
mud, drilling, and lubricants; air transport; water transport; geophysical services; dredging;
catering; workover services and environmental consulting and mitigation.
The issues examined for each of these sectors includes a basic description of the industry and the types of services provided, typical industry characteristics that include an examination of typical facilities, the geographical distribution of the firms and their location along the Gulf of Mexico (GOM), a description of each sectors’ labor force, and identification of typical or leading firms in those particular sectors. Each chapter includes an examination of the industry trends and outlook for that respective support sector/activity and the impact of 2005 hurricane activity on each of the various support sectors and activities.
Drilling
Drilling contractors provide the equipment, personnel, and expertise required to drill for oil and gas. They typically own and operate their own equipment, which can consist of onshore drilling rigs and offshore vessels, such as submersibles, jack-ups, semi-submersibles and drillships, and charge a fixed daily rate, or day rate, for the hardware (the rig) plus the associated costs of personnel and routine supplies. This cost may include fuel, but usually does not cover capital goods such as casing and wellheads; nor does it include special services, such as logging or cementing. As a guideline, the day rate can be considered as roughly half of the cost of the well (Schlumberger, 2007).
The tropical season of 2004-2005 caused considerable damage to drilling platforms throughout the GOM. Of particular concern during and immediately after these events was the dislocation and drifting of platforms during some of the more significant storms of this period (Ivan, Katrina, Rita). Numerous drilling platforms, primarily jack-ups, were pulled significant distances from their original drilling locations, in some instances up to 70 miles off station, causing damage to both the seafloor and the supporting pipeline infrastructure in the region and requiring restoration and recovery work for the drilling sector.
Overall industry trends have seen drilling contractor activity increase with high energy prices (oil and natural gas) starting in 2000, decreasing in 2002, then increasing considerably and staying robust through 2007 and into 2008. Despite the increase in overall drilling activity, however, a relative decrease in GOM activity has been caused by such factors as relative returns to drilling investments; regulatory regimes; and resource extraction opportunities.
Underwater contractors, specifically commercial divers, perform underwater activities related to construction, inspection, search, salvage, repair and photography. They can be employed by commercial diving contractors, shipping and marine construction companies or by the oil and gas companies themselves for these offshore operations.
Remotely operated vehicles (ROVs) are used in oil and gas production efforts world-wide, assisting or even replacing commercial divers in hazardous environments or water depths greater than 850 feet. The hurricanes of 2004-2005 increased the demand for offshore removal and repair work, and the increase in demand for subsea projects including inspection and repair has brought an influx of demand for both commercial divers and ROV equipment in the GOM.
Underwater contracting trends are dependent on the willingness of oil and gas companies to invest in offshore exploration, drilling and production. The future outlook for underwater contractors depends on the economy and advances in technology. With further deepwater exploration in the future ROV demand is expected to continue.
Drilling fluids or muds are used primarily to lubricate drill bits and to help keep them clean and cool during operation. Drilling fluids are made from a mixture of natural clays, minerals and small amounts of chemicals suspended in water or an organic liquid. The three types of drilling muds used in offshore production are water-based, oil-based and synthetic-based. Drilling wastes must be disposed of in accordance with environmental regulations.
Because drilling fluids are costly—about 10 percent of the total cost of the well construction—
reliable, accurate mud engineers are important to a drilling operation. The hurricanes’ impact on drilling fluids was directly correlated to well shut-ins and damage to infrastructure. With production suspended, the need for fluids decreased. By 2006, repairs to wells increased production, and drilling fluids were in demand. Industry trends for drilling fluids depend heavily on the level, type, depth and complexity of oil and gas drilling. The amount spent on product has grown from 2005 to 2006. With high oil and gas prices and demand for deepwater drilling, the demand for drilling fluids will increase.
Transport
Air transportation involves the use of helicopters to transport equipment and/or personnel to and from vessels, drilling rigs, production platforms and pipeline terminals. Helicopters can be used for routine transport, time-sensitive operations and for surveying pipelines for damage.
Helicopter service providers usually have helicopters of various sizes, used for different purposes. These helicopters are dispersed throughout the Gulf for quick response. This industry is very concentrated and specialized.
In the months after the 2005 hurricanes, helicopter services increased in the Gulf, yet many of the bases for the helicopters were destroyed, resulting in damages and loss of equipment.
This industry is largely dependent on the level of production, development and exploration in the Gulf. Demand for helicopters increases with an increase in activity levels associated with oil and gas production; however, as oil and gas companies seek to reduce costs with respect to air transportation services, demand for the frequency of these services is reduced.
Since the 2005 hurricanes, new equipment has been purchased and demand for services has increased along with the increases in offshore exploration and development. Water transportation vessels help transport supplies and personnel from land-based facilities to rigs and platforms in the Gulf. There are six general types of offshore supply vessels: tugs; marine
platform supply vessels; anchor handling; towing and supply vessels; mini-supply vessels; fast support vessels and liftboats; and floating, production, storage and offloading.
After the 2005 hurricanes, supply vessels were used for repairs, and that trend continues even today, with most of the vessels being used for construction supplies. Because of the large demand and the decrease in the number of vessels available since the hurricanes, the day rates for these vessels have increased an average of 71 percent. Industry trends project an increase in specialized vessels that can handle a longer range and capacity for the deepwater drilling that has been increasing recently.
Dredging, the removal of sediments from navigation channels, ensures the correct depth of water for ships to move safely. With the recent trend in the use of larger container ships, dredging is crucial to keeping ports and channels deep enough for safe navigation.
Dredging operations work primarily on capital projects, beach nourishment and maintenance.
Dredging can also be used for land creation, pipeline trenching and equipment recovery. The 2005 hurricanes damaged many shorelines, wetlands and barrier islands in the Gulf. Dredging plays a vital role in restoring these areas. Challenges to dredging operations include their proximity to protected areas, such as wetlands, estuaries and fisheries, and reduced funding for required port maintenance and improvements.
Geophysical & Environmental Operations
Geophysical services include acquiring, processing and selling seismic data. Services can be performed onshore from the seismic company’s headquarters or in large seismic exploration vessels in deeper waters and can take several months to conduct. Services can be provided by a one-man seismic broker or a large company.
The 2005 hurricanes did not affect the geophysical services industry, as most of the work is performed in onshore facilities, where no damage was reported. The post-hurricane cleanup efforts, however, did affect this industry.
With increasing exploration, the demand for geophysical services is increasing. Deepwater exploration requires high-quality equipment. Strong demand, coupled with low reserve replacements, brings a high demand for geophysical services.
Environmental consulting and mitigation is a service offered by companies who provide advice and technical assistance to businesses, government agencies and other organizations regarding environmental issues. They advise clients on emissions control, clean up, recycling programs and compliance with environmental laws and regulations. These companies conduct studies, audits or any other types of research needed to help client operations run efficiently.
Impacts from hurricanes in 2005 called for the services of many environmental companies for clean-up and restoration efforts. The oil spills and damages to infrastructure increased demand for environmental consulting services.
Industry trends in environmental consulting and mitigation are greatly affected by changes in environmental regulations at the state, local, federal and foreign levels. Changes in environmental consulting can also be the result of changes in environmental regulations in other industries, as well as changes in the overall economy. As the economy expands, for instance, construction, industrial and manufacturing activity also tends to expand, increasing the need for permitting and other environmental consulting services.
Catering Services
Catering services for oil and gas structures and those who run them include food management, accommodation management, security, medical services, potable water, waste management and more. As with all other services during the 2005 hurricanes, catering services were on hold during the storms, as employees were removed from the platforms. Soon after, services resumed to employees who were back in operation.
Demand for catering services depends on worker schedules. Due to high operating costs and competitiveness, smaller companies are bought out by larger ones and lower prices are negotiated for goods. With the expansion of deepwater exploration, demand for these services will increase.
Workover Services
Workover services provide repairs and restoration to producing wells to prolong or enhance the production of hydrocarbons. There are five general types of tasks for workover service:
excessive gas production; excessive water production; poor production rate; production of sand;
and equipment failures.
With an increase in demand for drilling services, the demand for workovers increases as well.
Since 2005, many new rigs are being built, with one company expecting to add 200 newly built workover and well-servicing rigs to meet the increased demand.
I. DRILLING CONTRACTORS A. Description of Industry and Services Provided
Drilling contractors provide the equipment, personnel, and expertise required to drill for oil and gas. They typically own and operate their own equipment, which can consist of onshore drilling rigs and offshore vessels, such as submersibles, jack-ups, semi-submersibles and drillships.
The drilling contractor usually charges a fixed daily rate, or day rate, for the hardware (the rig) plus the associated costs of personnel and routine supplies. This cost may include fuel, but usually does not cover capital goods such as casing and wellheads; nor does it include special services, such as logging or cementing. As a guideline, the day rate can be considered as roughly half of the cost of the well (Schlumberger, 2007).
Other primary contracting methods are footage rates and turnkey operations. Under a footage rate agreement, the contractor receives an agreed upon amount per foot of hole drilled (Schlumberger, 2007). Under a turnkey arrangement, the drilling contractor is fully responsible for the well to some predetermined milestone. This milestone could be the successful running of logs at the end of the well or the successful cementing of casing in the well or even the completion of the well. The operator owes nothing to the contractor until the specified milestone is reached. This type of arrangement puts a considerable amount of risk and potential reward on the drilling contractor. The contractor bears all risk of trouble in the well, and in extreme cases, may have to abandon the well entirely and start over. In return for assuming such risk, the price of the well is usually set higher than the well would cost if it were relatively trouble free. Thus, if the contractor is successful in drilling a trouble-free well, the fee added as contingency becomes profit (Schlumberger, 2007).
B. Industry Characteristics 1. Typical Facilities
Unless otherwise indicated, the following information is summarized from “Schlumberger Oil Field Services Glossary” (Schlumberger, 2007); and “NaturalGas.org” (NaturalGas.org, 2004a, 2004b, and 2004c).
Onshore
There are two main types of onshore drilling. Percussion, or 'cable tool' drilling, consists of raising and dropping a heavy metal bit into the ground, punching a hole down through the Earth.
After a few impacts from the bit, the cable is reeled in and the cuttings are removed from the well. The bit is then reeled back to the bottom of the hole and the process is repeated. Due to the increasing time required to retrieve and deploy the bit as the well is deepened, the cable tool method is limited to shallow depths. Recognized as being the first drilling method used, cable tool drilling is now largely obsolete, although it is used in some of the shallow wells of the Appalachian Basin.
Modern drilling activity has shifted mainly towards the more widely used method of rotary drilling. This method of drilling works like a screwdriver or hand-held drill, with a sharp,
rotating metal bit used to drill through the Earth's crust. Much more efficient than cable tool drilling, it is a nearly continuous process, as well cuttings are removed as drilling fluids circulate through the bit and up the wellbore to the surface. The difference in efficiency becomes particularly significant as hole depth increases.
Offshore
Each type of offshore rig has a specific environment it was created to work in, from the protected shallow waters of inland marshes that are only a few feet deep, to hostile oceans in water depths thousands of feet deep. Offshore rigs can either be moved from place to place, allowing for drilling in multiple locations, or permanently placed. Some of the most common types of rigs are described below.
Moveable Offshore Drilling Rigs
Source: rigzone.com
Drilling barges are used mostly for inland, shallow water drilling, typically in lakes, swamps, rivers, and canals. These large floating platforms must be towed by tugboat from location to location.
These rigs are kept in still, shallow waters, as they are not able to withstand the water movement in large open water situations.
Source: rigzone.com
Drillships are self-propelled and typically have a drilling platform and derrick located on the middle of the deck. The ‘moonpool’ of a drillship is a hole that extends through the ship down through the hull, allowing for the drill string to run through the boat and down into the water. Drillships are moored either by a standard anchoring system or by dynamic positioning of the vessel.
Dynamic positioning is the use of a computer-operated thruster system which keeps the vessel on location without the use of anchors. This allows vessels to drift in extremely deep water, often more than 6,000 feet deep.
Source: moc.noaa.gov/gu/
visitor/gu0303/rigs.htm
Jack-ups are used in waters up to 600 feet deep. Once a jack-up rig is towed to the drilling site, heavy machinery is used to jack 3 or 4
‘legs’ down to the seabed. The platform containing the work area is then jacked-up above the water’s surface, allowing the working platform to rest above the surface of the water. Jack-up rigs are suitable for shallower waters – it would be impractical to extend the legs in deep water. Because their working platform is elevated above the water, these rigs are typically safer to operate than drilling barges.
Source: rigzone.com
A submersible is towed to its location and submerged until it sits on the seabed. It consists of a platform with two hulls positioned on top of one another. The upper hull contains the living quarters for the crew, as well as the actual drilling platform. The lower hull works much like the outer hull in a submarine. When the platform is being moved from one place to another, the lower hull is filled with air, making the entire rig buoyant. When the rig is positioned over the drill site, the air is let out of the lower hull, and the rig submerses to the sea floor. This type of rig has the advantage of mobility, however its use is limited to shallow water areas (usually 80 feet deep or less).
Source: rigworker.com/
industry/semisub.shtml
Semisubmersible rigs are the most common type of offshore drilling rigs. This rig combines the advantages of submersible rigs with the ability to drill in deep water. Semisubmersible rigs use the same principle as submersible rigs; through the 'inflating' and 'deflating' of its lower hull. The main difference is that when the air is let out of the lower hull, the rig does not submerge to the sea floor. Instead, the rig is partially submerged, but still floats above the drill site. The lower hull is filled with water and provides stability to the rig when drilling. These rigs are held in place by huge anchors, each weighing upwards of ten tons. The anchors, combined with the submerged portion of the rig, ensure that the platform is stable and safe enough to be used in turbulent offshore waters. Semisubmersible rigs can be used to drill in much deeper water than the rigs mentioned above.
Moveable rigs are most often used to drill exploratory wells. If a commercially viable deposit of natural gas or petroleum is found, it may be more economical to build a permanent platform from which well completion, extraction and production can occur.
Offshore Drilling and Production Platforms – Permanently placed large drilling platforms are expensive and generally require large expected oil and gas deposits to be economical to construct. As described below, there are a number of different types of permanent offshore platforms, each useful for a particular depth range. See Figure 1 for examples of platforms at varying depths.
Figure 1. Offshore drilling platforms.
Fixed Platform Rig: Sometimes in shallow water it may be possible to actually attach a platform to the seafloor. The fixed platform has 'legs' that extend down from the platform rest on the seafloor. These legs are constructed of concrete or steel and their mass is so great, they do not need to be attached to the seafloor. These rigs are very stable as there is limited exposure to movement due to wind and water forces. These platforms cannot be used in deep water as it would not be economical to build legs that long.
Compliant Towers are similar to fixed platforms. The platform has a narrow tower that is attached to a foundation. The tower is flexible, allowing it to operate in much deeper water, as it can absorb much of the pressure exerted by the wind and sea.
Seastar Platforms are platforms with a floating rig, like a semisubmersible, but with tension legs like a tension leg platform. The Seastar’s lower hull is filled with water when drilling to increase the platform’s stability. It also has long, hollow tendons extending from the seafloor to the platform that are kept under constant tension. The tension restricts any up or down movement, but allows for side-to-side motion, which helps the platform withstand the force of the ocean and wind, without breaking off the legs. Typically, Seastar platforms are used for smaller deepwater reservoirs, when building a larger platform is not economical. They can operate in water depths of up to 3,500 feet.
Tension Leg Platforms are larger versions of the Seastar platform. The long, flexible legs are attached to the seafloor, and allow for significant side to side movement (up to 20 feet). Tension leg platforms can operate as deep as 7,000 feet.
Source: Natural Gas.org, 2004c.
Subsea production systems are located on the sea floor, as opposed to the surface. The well is drilled by a moveable rig, and rather than tying the well to a platform, the oil and natural gas is transported by riser or undersea platform to a nearby production platform. This format allows for one production platform to service many wells. Subsea systems are typically in use at depths of 7,000 feet or more, and do not have the ability to drill, only to extract and transport.
Spar platforms are huge platforms that consist of a large cylinder supporting a typical fixed rig platform. The cylinder does not extend all the way to the seafloor, but rather is tethered to the bottom by a series of cables and lines. The large cylinder stabilizes the platform in the water, and allows for movement to absorb the force of the ocean and wind.
Offshore Statistics
According to the ReedHycalog annual rig census, and as shown in Table 1, jack-ups comprise almost 60 percent of the global offshore mobile fleet and have the highest utilization rate at 89 percent. Semisubmersibles comprise 24 percent of the worldwide offshore fleet and have the second highest utilization rate, 87 percent. Drill barges account for 6 percent, as do drill ships, and submersibles account for only 1 percent of the worldwide fleet (Berkman and Stokes, 2006).
Table 1
Worldwide Offshore Fleet by Type
Number Percent Utilization
Type of Rig of Rigs of Fleet Rate
Jack-ups 385 59% 89%
Semisubmersibles 158 24% 87%
Drill barges 40 6% 48%
Drill ships 37 6% 78%
Drilling tenders 25 4% 76%
Submersible 9 1% 89%
Total 654 85%
Source: Berkman and Stokes, 2006.
2. Geographical Distribution
As shown in Figure 2, the U.S. employs 23 percent of the global offshore mobile fleet. Rigs off of South America account for 12 percent and the Middle East accounts for 12 percent.
Northwest Europe has 11 percent of the world’s offshore fleet, and Southeast Asia and West Africa account for about 10 percent and 8 percent, respectively. The remaining offshore rigs are working in Mexico, Indian Ocean, Far East, Mediterranean, Black Seas, Caspian Sea, Central America, Australia and New Zealand. Rigs offshore of Canada, the Russian Arctic and the Baltics account for less than 1 percent (Berkman and Stokes, 2006).
Figure 2. Worldwide offshore mobile fleet.
3. Labor Force
Unless otherwise indicated, the following information is summarized from “Schlumberger Oil Field Services Glossary” (Schlumberger, 2007); and the OTS Heavy Oil Science Center 2006 website (OTS Heavy Oil Science Center, 2006).
There are a number of specific jobs on an offshore rig. While the operating company usually has a representative at the drill site to protect its interests, the positions on the rig are filled by the drilling contractor.
The top representative of the contractor at the site is a “toolpusher.” The toolpusher is responsible for supervising the rig, its daily operations and the crews. As long as the rig is operating, the “toolpush” is always on call. This position is largely administrative, making sure that the rig has sufficient materials, spare parts, and skilled personnel available to continue efficient operations. Each morning the toolpusher compiles the results of the past 24 hours of drilling into a daily drilling or morning report. The report is phoned back to the drilling superintendent at the contractor's office. The report includes the depths, footage drilled, supplies used, and other drilling and geological data.
The next job in the chain of command is the driller, who leads each shift and ensures the efficiency of the drilling operation and the safety of the crew. The driller’s role is supervisory, but he or she must be capable of performing each job on the rig and maintain control of the major rig systems. From the control room, the driller operates the pumps, drawworks, and rotary table. It is the driller who operates the drawworks brake, which controls the speed and motion of the drilling line and the drillstring. For this reason, the driller is referred to as the person “on the brake” (Schlumberger, 2007).
U. S.
23%
Russian Arctic 0%
Southeast Asia 10%
Indian Ocean 6%
South America 12%
Australia and New Zealand
2%
Mexico 5%
Northwest Europe
11% Baltic
<1%
Far East 4%
Middle East 12%
West Africa 8%
Central America 1%
Canada 1%
Mediterranean and Black Seas 4%
Caspian 1%
Source: Berkman and Stokes, 2006.
The derrickman is second in command after the driller. The derrickman wears a special safety harness that enables him to climb to the monkeyboard, a platform near the top of the derrick, and reach the drillpipe in the center of the derrick or mast, throw a line around the pipe and pull it back to its storage location until it is time to run the pipe back into the well. In terms of skill, physical exertion and perceived danger, a derrickman has one of the most demanding jobs on the rig crew. On newer drilling rigs, automated pipe-handling equipment allows the derrickman to control the machinery without physically handling the pipe. Using an escape line often referred to as the Geronimo line, the derrickman can quickly reach the ground during an emergency.
Between trips, the derrickhand is usually responsible for the mud system, and making sure that it meets the specification for drilling a particular part of the hole (Schlumberger, 2007).
On the derrick floor there are usually two to four roughnecks (rotary or floor helpers), depending on the size of the rig. They handle and maintain the drilling equipment. One person is hired to maintain the engines. On a typical drilling crew, two roughnecks are responsible for lowering the end of the pipe when it is tripping out or in and for attaching each length of new drill pipe as needed. The work is heavy and exacting, requiring precise timing and teamwork. Roughnecks maintain and repair the rig and equipment, and ensure a safe operating area on the rig floor (OTS Heavy Oil Science Center, 2006).
Other jobs on the rig can include cleaner/painters, roustabouts, riggers, floorhands, crane operators, welders, electricians, mechanics, motormen, oilers, engineers, chief engineers, warehousemen, medic/safety persons, ballast controlmen, DP operators, barge operators, barge engineers, rig managers and rig superintendents. In addition, service and supply companies provide specialized tools and services needed during the drilling operations.
4. Labor Statistics
The number of jobs in oil and gas drilling can be measured by the “Oil and Gas Extraction”
series as reported by the U.S. Department of Labor’s Bureau of Labor Statistics. As shown in Figure 3, employment in the U.S. oil and gas drilling industry has been decreasing. Since its peak in 1982 of 264,500 jobs, employment fell over 50 percent, to its lowest point of 120,100 in 2003. Some of this decline can be attributed to industry consolidation, the decline of offshore drilling, and increasing competition, all of which is discussed later in this chapter. Oil and gas drilling employment has increased in recent years, to an annual average of 136,000 in 2005 and an average of 147,600 by July of 2007 (U.S. Dept. of Labor, BLS, 2007a).
Average earnings in the oil and gas extraction industry are significantly higher than the average for all industries. The average weekly earnings for production workers in the oil and gas extraction sector in 2006 was $920 per week. This translates to almost $48,000 per year. In comparison, the average weekly earnings for all workers in private industry in 2006 was $568 per week, or $29,530 per year. Also, because of their intense working conditions, employees at offshore operations generally earn higher wages than their onshore counterparts (U.S. Dept. of Labor, BLS, 2007a).
A description of typical companies and their number of employees is found in the next section.
0 50 100 150 200 250 300
1975 1977 1979 1981 1983 1985 1987 1989 1991 1993 1995 1997 1999 2001 2003 2005 2007
Number of Employees (thousands)
Figure 3. Number of employees, oil and gas extraction.
5. Typical Firms
RigData (2009) compiles a monthly list of the top 100 drilling companies ranked by footage.
Table 2 shows the top 25 drillers from this list (from January through July of 2009). As shown in the table, the top 25 drillers account for 60 percent of the well footage drilled. The remaining 40 percent is divided among over 75 smaller companies.
As shown in Table 2, Helmerich & Payne I.D.C leads the group in 2009 with over 8.4 million feet drilled, over nine percent of total footage drilled. Helmerich & Payne owns and operates land rigs in the U.S. as well as abroad and has offshore platform rigs which are mostly located in the GOM (Helmerich & Payne, 2009).
Second on the list is Nabors Drilling USA with almost nine percent of total footage drilled. The Nabors companies own and operate almost 600 land drilling and 800 land workover and well- servicing rigs in North America. Offshore, Nabors operates 41 platform rigs, 14 jack-ups, and four barge rigs in the domestic and international markets. In addition, Nabors markets 25 marine transportation and support vessels, primarily in the U.S. Gulf of Mexico (Nabors Industries LTD, 2007).
Patterson UTI provides onshore contract drilling services to exploration and production companies in North America. The Company owns 336 marketable land-based drilling rigs that operate primarily in oil and natural gas producing regions of Texas, New Mexico, Oklahoma, Arkansas, Louisiana, Mississippi, Colorado, Utah, Wyoming, Montana, North Dakota, South Dakota and western Canada. At the end of 2006, Patterson-UTI had approximately 9,000 full- time employees (SEC, 2006a).
Source: U.S. Dept. of Labor, BLS, 2007a.
Table 2
Top 25 Drillers Ranked by Footage Drilled (January – July 2009)
Percent Percent
Footage of Total Average Well of Total
Drilling Company Drilled Footage Footage Starts Starts
1 Helmerich & Payne I.D.C. 8,454,504 9.1% 9,774 939 7.2%
2 Nabors Drilling USA, LP 8,121,720 8.8% 10,887 809 6.2%
3 Patterson-UTI Drilling Company, LLC 5,464,122 5.9% 9,586 584 4.5%
4 Nomac Drilling, LLC 4,166,965 4.5% 7,441 566 4.3%
5 Precision Drilling Oilfield Svcs, Inc. 3,945,843 4.3% 10,636 381 2.9%
6 Ensign United States Drilling, Inc. 3,505,228 3.8% 8,763 417 3.2%
7 Trinidad Drilling, LP 2,053,428 2.2% 10,115 208 1.6%
8 Unit Drilling Company 1,924,106 2.1% 13,179 150 1.1%
9 Pioneer Drilling Company 1,771,241 1.9% 10,934 163 1.2%
10 Scandrill, Inc. 1,695,056 1.8% 12,745 133 1.0%
11 Nabors Well Services Company 1,268,564 1.4% 9,192 153 1.2%
12 Cactus Drilling Company, LLC 1,258,650 1.4% 11,442 110 0.8%
13 Union Drilling, Inc. 1,141,482 1.2% 5,679 216 1.6%
14 Xtreme Coil Drilling Corporation 1,121,491 1.2% 7,843 143 1.1%
15 Saxon Drilling, LP 1,034,649 1.1% 6,426 162 1.2%
16 Desoto Driling, Inc. 955,374 1.0% 4,227 226 1.7%
17 Goober Drilling LLC 930,892 1.0% 7,106 131 1.0%
18 Savanna Drilling LLC 905,809 1.0% 10,657 85 0.6%
19 Capstar Drilling, LP 898,473 1.0% 4,937 182 1.4%
20 Union Drilling Texas, LP 876,100 0.9% 9,734 90 0.7%
21 Bronco Drilling Company, Inc. 859,518 0.9% 9,658 94 0.7%
22 White Mountain Operating 858,260 0.9% 13,623 63 0.5%
23 Felderhoff Brothers Drilling, LLC 850,886 0.9% 9,561 89 0.7%
24 Falcon Drilling Company, LLC 815,035 0.9% 5,470 150 1.1%
25 Key Energy Services, Inc. 794,752 0.9% 12,042 69 0.5%
Total of Top 25 Companies 55,672,148 60.2% 6,313 48.1%
Remaining Companies 36,756,810 39.8% 6,800 51.9%
Source: RigData, 2009.
Although it is not shown in Table 2, Diamond Offshore is well known in offshore markets. It operates in four continents with a fleet of 30 semisubmersibles, 13 jack-ups and one dynamically positioned drillship. Diamond staff consists of approximately 500 shore-based support personnel and 3,800 offshore rig personnel (Diamond Offshore, 2007).
Another offshore leader is ENSCO, one of the leading offshore oil and gas drilling contractors with a fleet of 50 offshore drilling rigs. Its fleet includes 44 jackups, one deepwater semisubmersible, one barge rig, and four ultra-deepwater semisubmersible rigs under construction (ENSCO International, 2007).
GlobalSantaFe owns or operates a fleet of 59 offshore drilling rigs. GlobalSantaFe’s fleet includes: 43 cantilevered jackup rigs capable of drilling in maximum water depths of 200 feet to 400 feet; eight semi-submersible rigs suited for midwater drilling and/or harsh environments; one deepwater semi-submersible capable of drilling in water depths up to 5,750 feet; three dynamically positioned, ultra-deepwater drillships, two of which are designed for the ultimate drilling capability of up to 12,000 feet of water; two ultra-deepwater semi-submersibles, capable of drilling in water depths of up to 7,500 feet, in either DP or moored mode; and two semi- submersibles owned by third parties and operated under a joint venture agreement (GlobalSantaFe, 2007).
C. Industry Trends and Outlook 1. Rig Count
According to the Baker-Hughes Rig Count, worldwide drilling activity has been increasing since the middle of 2002. As shown in Figure 4, the number of active rigs worldwide peaked in February 2007 at 3,325 rigs – a 7 percent increase from the previous year’s peak (February 2006) and a 190 percent increase from the historic low of 1,156 active rigs in 1999.
North American rig counts have also been climbing since 2002, reaching a high of 1,771 in June 2007. This is more than a 6 percent increase since June 2006, and a 257 percent increase since the historic low of 496 rigs in April 1999.
0 500 1,000 1,500 2,000 2,500 3,000 3,500 4,000
Jan-90 Jan-92 Jan-94 Jan-96 Jan-98 Jan-00 Jan-02 Jan-04 Jan-06
Rigs
Worldwide North America International
Figure 4. Worldwide rig activity.
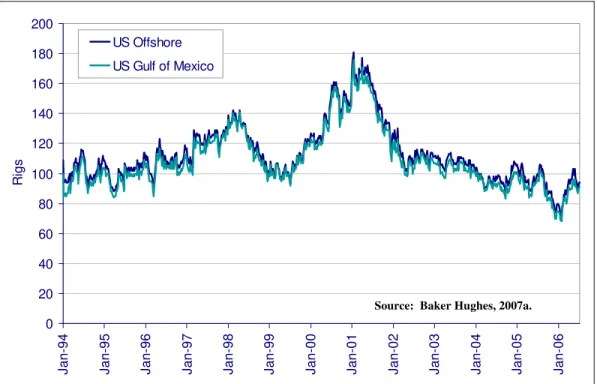
Despite the increase in drilling activity worldwide and onshore in the U.S., U.S. offshore operations have been decreasing over the past five to six years. In fact, Figure 5 shows that the number of active rigs in the U.S. and the Gulf of Mexico has decreased 55 percent since its high of 167 rigs in January 2001.
Source: Baker Hughes, 2007a.
Throughout the first half of 2005, the number of rigs in the Gulf began to increase. This increasing trend was halted by the hurricanes of 2005 as shown by the quick downturn in August 2005. By February 2006, however, rigs had rebounded almost to their pre-2005 hurricane levels.
Impacts from these hurricanes will be discussed in the next section.
0 20 40 60 80 100 120 140 160 180 200
Jan-94 Jan-95 Jan-96 Jan-97 Jan-98 Jan-99 Jan-00 Jan-01 Jan-02 Jan-03 Jan-04 Jan-05 Jan-06
Rigs
US Offshore US Gulf of Mexico
Figure 5. Active rigs offshore.
In the deepwater Gulf, production and the number of discoveries have increased substantially in recent years. As of March 2006, there were 118 deepwater hydrocarbon production projects online (French et al., 2006).
According to a 2006 BOEMRE report, there are many deepwater prospects waiting to be drilled.
Many of these prospects might not be drilled because of the limited number of rigs available for deepwater drilling in the GOM. Also, as some operators are drilling more often in increased depths this will cause rigs to be under contract for longer periods and unavailable for new prospects (French et al., 2006).
Figure 6 shows deepwater rigs operating in the Gulf from 1992 through 2005. The average number of rigs increased steadily from 1992 to a peak in 2001. The average number of rigs operating in the deepwater GOM decreased from 2002 through 2004, but increased in 2005 (French et al., 2006).
Source: Baker Hughes, 2007a.
30 26 30 36 41
33
26
18 14 11
6 3
28 28
0 5 10 15 20 25 30 35 40 45
1992 1993 1994 1995 1996 1997 1998 1999 2000 2001 2002 2003 2004 2005
Number of Deepwater Rigs
Figure 6. Average number of rigs operating in deepwater Gulf of Mexico.
2. Rig Contractors
For the past two decades, the number of drilling contractors in the U.S. has been decreasing.
Because of industry consolidation, the almost 700 rig contractors that existed in 1987 had decreased to 179 in 2003. The 2004 and 2005 data show a slight increase to 213 and 226 contractors. In 2004 this increase was attributed to better data collection and the addition of several small companies. However, the addition of 13 companies in 2005 and 31 companies in 2006 was actually a result of new, small companies entering a rejuvenating industry (Berkman and Stokes, 2006) (see Figure 7).
Source: French et al., 2006.
0 100 200 300 400 500 600 700 800
1987 1989 1991 1993 1995 1997 1999 2001 2003 2005
Number of Rig Owners
Figure 7. Drilling contractors, number of rig owners.1
Reasons for merging include access to capital at better rates and more efficient scales of operation. A large company has more geographical reach and can realize significant savings through lower insurance rates and large-scale purchasing. Also, a larger company will have more types of rigs available to meet cyclical markets.
As consolidations in the industry continued, the big companies got bigger. Figure 8 shows that in 2003, at the height of industry consolidation, 63 percent of rig contractors in the U.S. had fleets with more than 20 rigs. However, with additional companies entering the market, this number fell to 55 percent in 2005. U.S. companies holding 11 to 20 rigs, and those with just one rig both saw percentage gains.
1
Source: Berkman and Stokes, 2006.
20 25 28 29 37
50 54 58 62 63 60 55 58
25 22 22 24
18
16 15 12 11 10 11 15 13
20 21 19 19 18
12 10 10 10 11 12 12 11
28 26 26 23 22 18 17 16 13 13 14 13 14
7 6 5 5 5 4 4 4 4 3 3 4 4
0%
10%
20%
30%
40%
50%
60%
70%
80%
90%
100%
1993 1994 1995 1996 1997 1998 1999 2000 2001 2002 2003 2004 2005 2006
>20 rigs 11-20 rigs 6-10 rigs 2-5 rigs 1 rig
Percent of Total Rig Fleet
Figure 8. Drilling contractors, owner fleet size.2
Improved market conditions have not only encouraged new companies to enter the market, but the market has tightened, causing utilization rates to increase. Figure 9 shows that rig utilization in the U.S. GOM has been high in recent years, averaging 95 percent in 2005.
Despite these improved market conditions, the number of rigs in the U.S. GOM has fallen significantly, which also contributes to higher utilization rates (see Figure 9). Much of this has been due to increased competition from overseas prospects and impending expiration of leases in the GOM. A migration of rigs out of the Gulf of Mexico has also been supported by longer-term contacts that larger oil companies throughout the world are willing to sign. Rigs have been moving to places such as the west coast of Africa, Brazil and the Middle East. The number of rigs in the GOM fell by 19 from September 2006 to September 2007 (Sridharan, 2007).
2
Source: Berkman and Stokes, 2006.
0 100 200 300 400 500 600 700 800
1980 1984 1988 1992 1996 2000 2004
0%
10%
20%
30%
40%
50%
60%
70%
80%
90%
Available Active Utilization Rate 100%
Number of Rigs (Available and Active) Utilization Rate (%)
Figure 9. Number of available and active rigs in the U.S. GOM.
3. Hurricane Impacts
Hurricanes Katrina and Rita caused a substantial amount of damage to the production platforms of the GOM (see Figure 10). It is estimated that 3,050 of the GOM’s 4,000 platforms (or 76 percent of platforms) were in the direct path of either Hurricane Katrina or Hurricane Rita (USDOI, MMS, 2006a). Hurricane Katrina, which was a category 5 hurricane when it entered the GOM OCS, destroyed 46 platforms and four drilling rigs, and damaged an additional 20 platforms and nine drilling rigs. Shut-in production at its peak after Katrina was 95 percent for oil production and 88 percent for natural gas. Then, in just three weeks, as the industry was recovering, Hurricane Rita hit. Hurricane Rita, which was a category 4 hurricane when it entered the GOM OCS, destroyed 69 platforms and four drilling rigs. In addition, 32 platforms and 10 drilling rigs were damaged (Tubb, 2005). In the days following Hurricane Rita, 100 percent of oil production was shut-in as was about 80 percent of natural gas (USDOI, MMS, 2005a and 2006b).
In comparison, Hurricane Ivan moved through the GOM as a Category 4 hurricane in September 2004. Of the 4,000 platforms in the GOM, only 150 facilities were in its direct path. Hurricane Ivan resulted in an interruption of more than 10 percent of the Gulf’s production for at least four months. This seems pretty minor compared with Hurricanes Katrina and Rita (Drilling Contractor, 2005).
Source: ReedHycalog Rig Census, 2006.
Figure 10. Hurricanes Katrina and Rita paths, 2005.
Most of the structures that were lost were built 20 to 30 years ago when there were less stringent standards than what is currently in effect (Tubb, 2005). However, there were some exceptions.
Chevron U.S.A. Production Company’s Typhoon production facility, a SeaStar Tension Leg Platform located in 2,100 feet of water, was found upside down after Hurricane Rita. The deepwater TLP was less than four years old and produced about 40,000 barrels per day of oil and 60 MMcf per day of natural gas (Tubb, 2005). Many other mobile drilling units were torn from their anchor moorings and became adrift during the hurricanes. Drifting units not only means a lost facility, but also potential damage to existing fixed facilities, including underwater pipelines.
Anchors being dragged across the ocean floor have a good chance of breaking segments of pipeline (Tubb, 2005).
The tropical season of 2005 damaged many production facilities beyond repair. Chevron announced that it would sink its $250 million Typhoon oil platform that was damaged by Hurricane Rita. The Typhoon platform will be donated to a federal program that uses decommissioned platforms and rigs to create new reefs on the seafloor (Bloomberg.com, 2006).
Hurricanes Katrina and Rita resulted in losses to the industry of $26 billion and $12 billion respectively, largely as a result of platform and pipeline damage. The previous year, Hurricane Ivan caused an estimated $5.7 billion in losses (Energy Trader, 2007). Recently, it was projected that a Category 5 hurricane could cause more than $65 billion in damage to offshore platforms and undersea pipelines in the GOM region. This estimate included property damage of $35 billion and losses associated with business interruption and lost production capacity of $30 billion (Energy Trader, 2007).
Source: USDOI, MMS, 2005b.