SUPPLEMENTARY TEXT, TABLES, FIGURES, AND DATASETS Supplementary Text
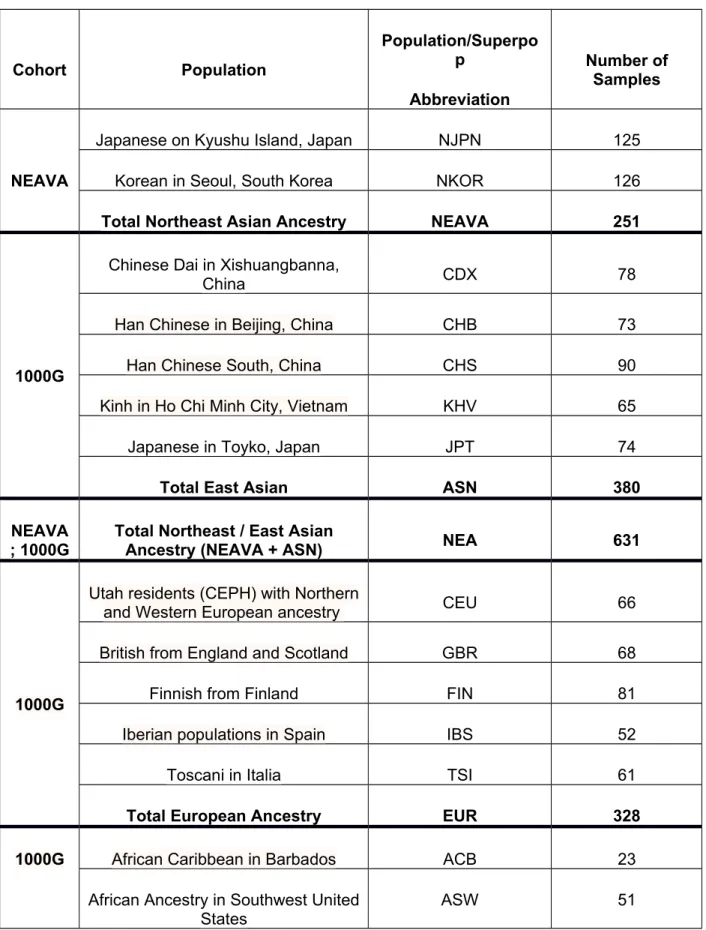
Table S1: Joint Sample Composition – By Population
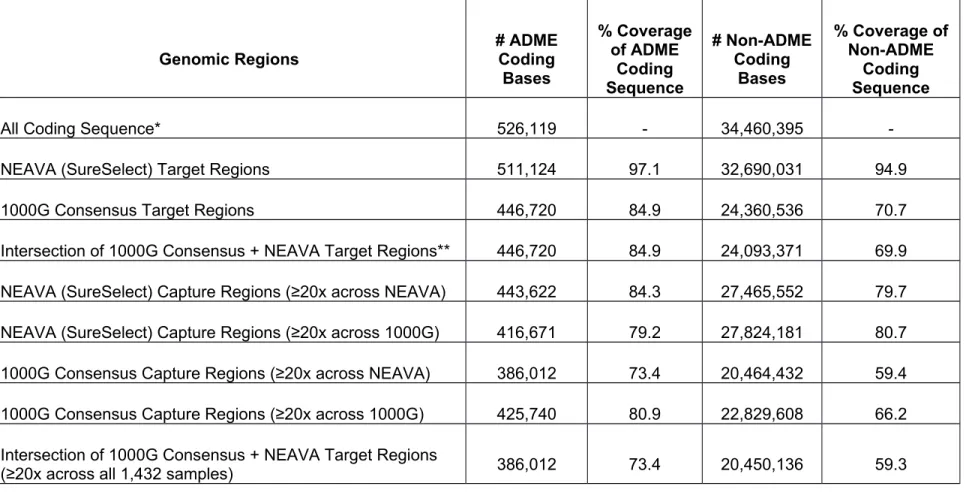
Table S2: Exome Sequencing Coverage of ADME & Non-ADME Coding Sequence
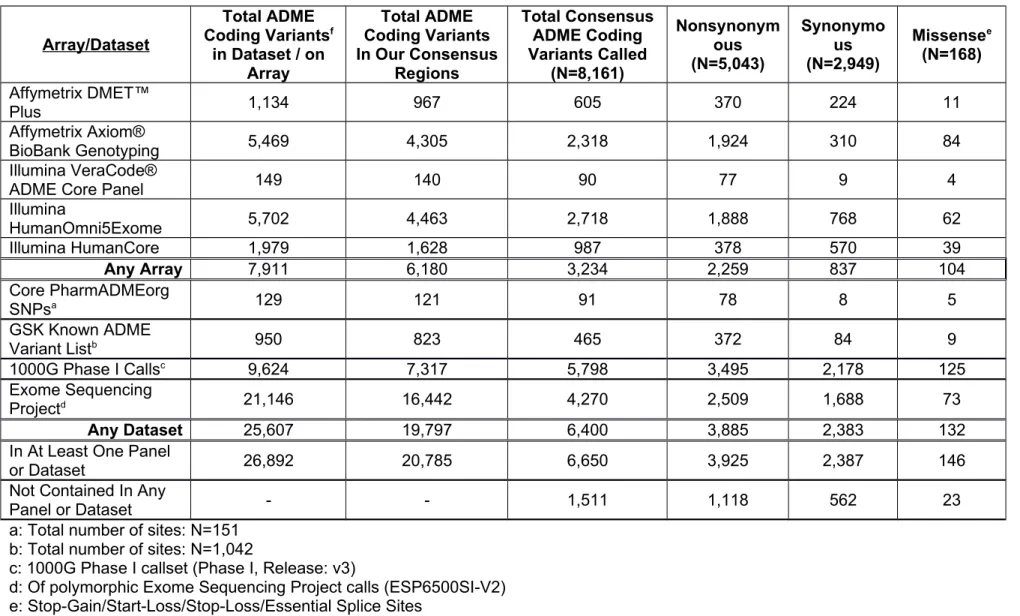
Table S3: Overlap of Consensus ADME SNV Calls with Proprietary ADME/Exome Arrays or Publicly-Available Datasets
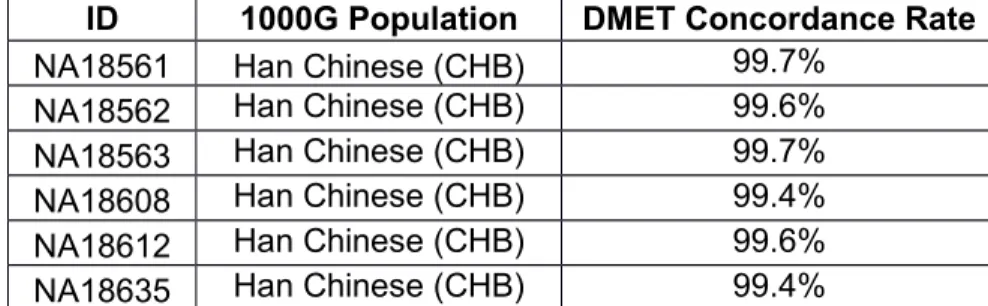
Table S4: Genotype Concordance for Samples with Affymetrix DMET™ Plus Array Genotype Data
Tables S5A-S5D: Between Population FST Analyses (at end of document for readability) Table S6: A summary of ns SNV in Core ADME
Table S7: A summary of imputability distribution based on MAF for ADME SNVs
Figure S1: Exome Sequencing Capture in NEAVA and 1000G Subjects Figure S2: Depth of Sequence Coverage of ADME Genes
Figure S3A: Principal Component Analyses (Joint Sample) Figure S3B: Principal Component Analyses (East Asian) Figure S4A-S4C: Variant Discovery Curves (All Populations)
Figure S5: Variant Discovery in Consensus ADME vs Consensus Non-ADME Regions for Selected Populations
Figure S6: Rates of ADME Variation per Individual across Continental and Sub-Continental Populations
Figure S7: Private Variation (Stratified by MAF and Predicted Deleteriousness) at Individual and Continental Level
Figure S8: Allele-Sharing Across MAF (Consensus ADME Regions)
Supplementary Datasets/PDFs
Dataset S1: List of ADME Genes Based on the UCSC knownGene Table (March 2013), Including 1000G/NEAVA Target and Average Coverage Information (Supplemental Digital Content 2)
Dataset S2: GSK Known ADME Variant List (Supplemental Digital Content 3)
Dataset S3: Sanger sequencing validation for ADME variants (Supplemental Digital Content 4) Dataset S4: SNV Callset Summary Tables, by Individual and Continental Population
(Supplemental Digital Content 5)
Dataset S5: Consensus-Region ADME Variants with Information Related to Coverage and Allele Frequency (Supplemental Digital Content 6)
Dataset S6: Proposed Variants for Inclusion in Future ADME Studies (Supplemental Digital Content 7)
Dataset S7: Core PharmADMEorg SNPs (Supplemental Digital Content 8)
Supplementary Text
Capture of ADME Variation with Exome Sequencing
A list of 1,062 published ADME SNVs (Supplemental Digital Content 3) was compiled using publicly available databases (pharmADMEorg, PharmGKBorg, UGT- and CYP-genes databases) and published literature (1–4) Of 950 protein-coding SNVs, 823 (87%) lie in the consensus regions, and 528 (56%) resulted in high-quality genotype calls in at least 90% of subjects In the joint sample, 485 (59%) of consensus-region known coding SNVs were polymorphic Of 401 coding ADME SNVs which were not polymorphic in this study, 70% were called as monomorphic across all 7,000 Exome Sequencing Project (ESP) samples (5)
Of 150 key functional ADME SNVs compiled by PharmADMEorg (2) 129 are protein coding, of which 121 fall in our overall consensus regions and 98 (65%) resulted in high-quality genotype calls in ≥90% of subjects (Supplemental Digital Content 8) Overall, 91 (75%) of the 121 key functional ADME SNVs in consensus regions were polymorphic in the joint sample An
additional 18 of the 150 key non-coding ADME SNV sites were called in the consensus regions A total of 26 (17%) of the key protein-coding PharmADME variants were poorly captured in NEAVA subjects, and thus not in our consensus regions The remaining 25 core PharmeADME sites were originally included in PharmADME’s site list with reported minor allele frequencies of
<5% We confirmed that all 25 of these sites were called as monomorphic (or had allele
frequencies of < 0.01%) across all 7,000 ESP samples in the Exome Sequencing Project All 25 sites were captured at high-depth across all NEAVA & 1000G samples, with no non-reference alleles being observed
Of 4,293 protein-coding, consensus-regions ADME variant sites present on the Axiom® Biobank Genotyping Array, the exome-sequencing approach used in this study identifies variants at 55%of these sites The remaining 45% of ADME coding variants on the Axiom array were called as monomorphic in the 96 typed samples, with >90% of these uncalled array sites having reported allele frequencies of <0.1% in Exome Sequencing Project (ESP), suggesting they are very rare in European populations Notably, 62% (~3,100 SNVs) of all consensus NS ADME coding SNVs identified in our sequencing-based call set were absent from the Axiom BioBank exome array
Supplemental Reference List
1 UGT Alleles Nomenclature Home Page (2005) UGT Nomencl Commitee 2 Philips,M (2013) PharmaADMEorg
3 The Human Cytochrome P450 (CYP) Allele Nomenclature Database (2005) Hum Cytochrome p450 Allele Nomencl Comm
4 Ramos,E, Doumatey, a, Elkahloun, a G, Shriner,D, Huang,H, Chen,G, Zhou,J, McLeod,H, Adeyemo, a and Rotimi,CN (2014) Pharmacogenomics, ancestry and clinical decision making for global populations Pharmacogenomics J,14, 217-22
5 Fu,W, O’Connor,T, Jun,G and Kang,H (2012) Analysis of 6,515 exomes reveals the recent origin of most human protein-coding variants Nature, 493, 216–220
6 Abecasis,GR, Auton,A, Brooks,LD, DePristo,M a, Durbin,RM, Handsaker,RE, Kang,HM, Marth,GT and McVean,G a (2012) An integrated map of genetic variation from 1,092 human genomes Nature, 491, 56–65
Table S1: Joint Sample Composition – By Population
Cohort Population
Population/Superpo p
Abbreviation
Number of Samples
NEAVA
Japanese on Kyushu Island, Japan NJPN 125
Korean in Seoul, South Korea NKOR 126
Total Northeast Asian Ancestry NEAVA 251
1000G
Chinese Dai in Xishuangbanna,
China CDX 78
Han Chinese in Beijing, China CHB 73
Han Chinese South, China CHS 90
Kinh in Ho Chi Minh City, Vietnam KHV 65
Japanese in Toyko, Japan JPT 74
Total East Asian ASN 380
NEAVA
; 1000G
Total Northeast / East Asian
Ancestry (NEAVA + ASN) NEA 631
1000G
Utah residents (CEPH) with Northern
and Western European ancestry CEU 66
British from England and Scotland GBR 68
Finnish from Finland FIN 81
Iberian populations in Spain IBS 52
Toscani in Italia TSI 61
Total European Ancestry EUR 328
1000G African Caribbean in Barbados ACB 23
African Ancestry in Southwest United States
ASW 51
Luhya in Webuye, Kenya LWK 25
Yoruba in Ibadan, Nigeria YRI 81
Total African Ancestry AFR 180
1000G
Colombian in Medellin, Colombia CLM 48
Mexican Ancestry in Los Angeles,
United States MXL 58
Peruvian in Lima, Peru PEL 47
Puerto Rican in Puerto Rico PUR 70
Total Americas Ancestry AMR 223
1000G
Gujarati Indian in Houston, TX GIH 70
Total South Asian Ancestry SAN 70
Number of individuals in the joint study sample (N=1,432) from individual and continental populations
Table S2: Exome Sequencing Coverage of ADME and Non-ADME Coding Sequence
Genomic Regions # ADME
Coding Bases
% Coverage of ADME
Coding Sequence
# Non-ADME Coding
Bases
% Coverage of Non-ADME
Coding Sequence
All Coding Sequence* 526,119 - 34,460,395 -
NEAVA (SureSelect) Target Regions 511,124 97.1 32,690,031 94.9
1000G Consensus Target Regions 446,720 84.9 24,360,536 70.7
Intersection of 1000G Consensus + NEAVA Target Regions** 446,720 84.9 24,093,371 69.9 NEAVA (SureSelect) Capture Regions (≥20x across NEAVA) 443,622 84.3 27,465,552 79.7 NEAVA (SureSelect) Capture Regions (≥20x across 1000G) 416,671 79.2 27,824,181 80.7 1000G Consensus Capture Regions (≥20x across NEAVA) 386,012 73.4 20,464,432 59.4 1000G Consensus Capture Regions (≥20x across 1000G) 425,740 80.9 22,829,608 66.2 Intersection of 1000G Consensus + NEAVA Target Regions
(≥20x across all 1,432 samples) 386,012 73.4 20,450,136 59.3
*: Autosomes & chrX, UCSC knownGene table (03/05/2013)
**: All 1000G Consensus Target Regions overlapping ADME coding sequence are in SureSelect Target Regions
Table summarizing the sequencing coverage of ADME coding bases in NEAVA and 1000G capture protocols 1000G Consensus Target Regions are taken from the phase 1 1000G paper and phase 2 project analysis (6) Agilent SureSelect target regions are taken from the Agilent SureSelect All Exon Human 50mb protocol (Agilent Technologies, Santa Clara, CA)
Table S3: Published ADME Variation & Overlap with Consensus ADME SNV Callset
Array/Dataset
Total ADME Coding Variantsf
in Dataset / on Array
Total ADME Coding Variants In Our Consensus
Regions
Total Consensus ADME Coding Variants Called
(N=8,161)
Nonsynonym ous (N=5,043)
Synonymo us (N=2,949)
Missensee (N=168) Affymetrix DMET™
Plus 1,134 967 605 370 224 11
Affymetrix Axiom®
BioBank Genotyping 5,469 4,305 2,318 1,924 310 84
Illumina VeraCode®
ADME Core Panel 149 140 90 77 9 4
Illumina
HumanOmni5Exome 5,702 4,463 2,718 1,888 768 62
Illumina HumanCore 1,979 1,628 987 378 570 39
Any Array 7,911 6,180 3,234 2,259 837 104
Core PharmADMEorg
SNPsa 129 121 91 78 8 5
GSK Known ADME
Variant Listb 950 823 465 372 84 9
1000G Phase I Callsc 9,624 7,317 5,798 3,495 2,178 125
Exome Sequencing
Projectd 21,146 16,442 4,270 2,509 1,688 73
Any Dataset 25,607 19,797 6,400 3,885 2,383 132
In At Least One Panel
or Dataset 26,892 20,785 6,650 3,925 2,387 146
Not Contained In Any
Panel or Dataset - - 1,511 1,118 562 23
a: Total number of sites: N=151 b: Total number of sites: N=1,042
c: 1000G Phase I callset (Phase I, Release: v3)
d: Of polymorphic Exome Sequencing Project calls (ESP6500SI-V2) e: Stop-Gain/Start-Loss/Stop-Loss/Essential Splice Sites
f: ADME coding regions defined by knownGene data download (download date: 03/05/2013
Table summarizing the overlap of ADME sequencing-based coding variants with existing genotyping arrays and published next- generation sequencing datasets All variant counts include variants located in our high-coverage (consensus) ADME gene coding regions (see Figure S1)
Table S4: Samples with Affymetrix DMET™ Plus Array Genotype Data
ID 1000G Population DMET Concordance Rate
NA18561 Han Chinese (CHB) 99.7%
NA18562 Han Chinese (CHB) 99.6%
NA18563 Han Chinese (CHB) 99.7%
NA18608 Han Chinese (CHB) 99.4%
NA18612 Han Chinese (CHB) 99.6%
NA18635 Han Chinese (CHB) 99.4%
Genotype concordance between the Affymetrix DMET™ Plus Array and sequencing-based variant calls from our study for six 1000G CHB subjects Concordance rates represent percentage of matching genotypes for all (e.g., homozygous reference, heterozygous, homozygous alternate) non-missing genotype calls passing depth filters (minGD=20) for high-quality variants present both on the DMET array and in our sequencing-based callset
Tables S5A-S5D: Individual Population FST Analyses Table S5A: Consensus ADME
Europe East Asian NEAVA African Americas S.Asian
CEU TSI GBR FIN IBS CHB JPT CHS CDX KHV NJPT NKOR YRI LWK ASW ACB MXL PUR CLM PEL GIH
Europe
CEU . 0.0017 0.0001 0.0043 0.0021 0.0317 0.0333 0.0317 0.0339 0.0324 0.0334 0.0316 0.0425 0.0587 0.0304 0.0555 0.0110 0.0051 0.0068 0.0278 0.0126 TSI 0.0017 . 0.0022 0.0072 0.0008 0.0315 0.0336 0.0316 0.0330 0.0311 0.0337 0.0321 0.0412 0.0549 0.0284 0.0519 0.0115 0.0043 0.0061 0.0288 0.0124 GBR 0.0001 0.0022 . 0.0049 0.0016 0.0308 0.0325 0.0309 0.0328 0.0314 0.0324 0.0307 0.0433 0.0609 0.0317 0.0578 0.0125 0.0061 0.0074 0.0289 0.0137 FIN 0.0043 0.0072 0.0049 . 0.0079 0.0330 0.0344 0.0326 0.0351 0.0339 0.0336 0.0318 0.0451 0.0671 0.0343 0.0647 0.0141 0.0086 0.0109 0.0303 0.0156 IBS 0.0021 0.0008 0.0016 0.0079 . 0.0344 0.0362 0.0352 0.0368 0.0345 0.0374 0.0357 0.0430 0.0552 0.0290 0.0517 0.0120 0.0043 0.0064 0.0300 0.0147
E. Asian
CHB 0.0317 0.0315 0.0308 0.0330 0.0344 . 0.0033 0.0010 0.0043 0.0043 0.0038 0.0018 0.0458 0.0697 0.0394 0.0673 0.0239 0.0249 0.0267 0.0273 0.0247 JPT 0.0333 0.0336 0.0325 0.0344 0.0362 0.0033 . 0.0045 0.0080 0.0074 0.0008 0.0023 0.0476 0.0732 0.0410 0.0703 0.0251 0.0260 0.0280 0.0288 0.0258 CHS 0.0317 0.0316 0.0309 0.0326 0.0352 0.0010 0.0045 . 0.0026 0.0022 0.0047 0.0029 0.0469 0.0739 0.0414 0.0718 0.0247 0.0255 0.0278 0.0275 0.0246 CDX 0.0339 0.0330 0.0328 0.0351 0.0368 0.0043 0.0080 0.0026 . 0.0015 0.0076 0.0061 0.0475 0.0738 0.0410 0.0714 0.0268 0.0264 0.0287 0.0297 0.0261 KHV 0.0324 0.0311 0.0314 0.0339 0.0345 0.0043 0.0074 0.0022 0.0015 . 0.0073 0.0062 0.0462 0.0675 0.0386 0.0655 0.0245 0.0250 0.0263 0.0278 0.0238 NEAVA NJPT 0.0334 0.0337 0.0324 0.0336 0.0374 0.0038 0.0008 0.0047 0.0076 0.0073 . 0.0014 0.0501 0.0838 0.0470 0.0828 0.0264 0.0280 0.0308 0.0290 0.0265 NKOR 0.0316 0.0321 0.0307 0.0318 0.0357 0.0018 0.0023 0.0029 0.0061 0.0062 0.0014 . 0.0490 0.0824 0.0457 0.0808 0.0252 0.0269 0.0295 0.0286 0.0249 African YRI 0.0425 0.0412 0.0433 0.0451 0.0430 0.0458 0.0476 0.0469 0.0475 0.0462 0.0501 0.0490 . 0.0085 0.0055 0.0032 0.0405 0.0320 0.0365 0.0477 0.0405 LWK 0.0587 0.0549 0.0609 0.0671 0.0552 0.0697 0.0732 0.0739 0.0738 0.0675 0.0838 0.0824 0.0085 . 0.0069 0.0049 0.0528 0.0395 0.0423 0.0627 0.0567
Americas
ASW 0.0304 0.0284 0.0317 0.0343 0.0290 0.0394 0.0410 0.0414 0.0410 0.0386 0.0470 0.0457 0.0055 0.0069 . 0.0015 0.0272 0.0192 0.0217 0.0353 0.0303 ACB 0.0555 0.0519 0.0578 0.0647 0.0517 0.0673 0.0703 0.0718 0.0714 0.0655 0.0828 0.0808 0.0032 0.0049 0.0015 . 0.0495 0.0353 0.0379 0.0593 0.0535 MXL 0.0110 0.0115 0.0125 0.0141 0.0120 0.0239 0.0251 0.0247 0.0268 0.0245 0.0264 0.0252 0.0405 0.0528 0.0272 0.0495 . 0.0064 0.0047 0.0074 0.0122 PUR 0.0051 0.0043 0.0061 0.0086 0.0043 0.0249 0.0260 0.0255 0.0264 0.0250 0.0280 0.0269 0.0320 0.0395 0.0192 0.0353 0.0064 . 0.0023 0.0178 0.0113 CLM 0.0068 0.0061 0.0074 0.0109 0.0064 0.0267 0.0280 0.0278 0.0287 0.0263 0.0308 0.0295 0.0365 0.0423 0.0217 0.0379 0.0047 0.0023 . 0.0154 0.0113 PEL 0.0278 0.0288 0.0289 0.0303 0.0300 0.0273 0.0288 0.0275 0.0297 0.0278 0.0290 0.0286 0.0477 0.0627 0.0353 0.0593 0.0074 0.0178 0.0154 . 0.0247 S.Asian GIH 0.0126 0.0124 0.0137 0.0156 0.0147 0.0247 0.0258 0.0246 0.0261 0.0238 0.0265 0.0249 0.0405 0.0567 0.0303 0.0535 0.0122 0.0113 0.0113 0.0247 .
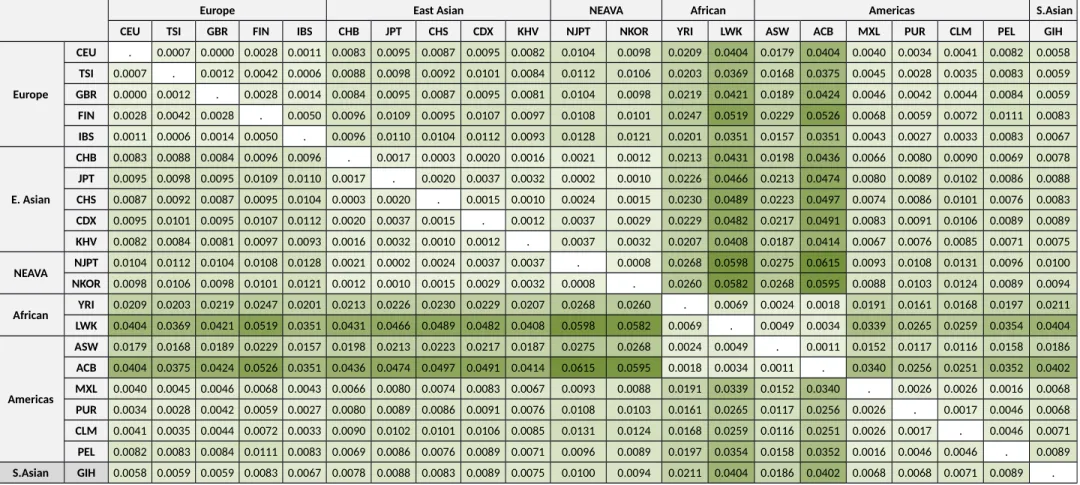
Table S5B: Consensus ADME (MAF < 0.05)
Europe East Asian NEAVA African Americas S.Asian
CEU TSI GBR FIN IBS CHB JPT CHS CDX KHV NJPT NKOR YRI LWK ASW ACB MXL PUR CLM PEL GIH
Europe
CEU . 0.0007 0.0000 0.0028 0.0011 0.0083 0.0095 0.0087 0.0095 0.0082 0.0104 0.0098 0.0209 0.0404 0.0179 0.0404 0.0040 0.0034 0.0041 0.0082 0.0058 TSI 0.0007 . 0.0012 0.0042 0.0006 0.0088 0.0098 0.0092 0.0101 0.0084 0.0112 0.0106 0.0203 0.0369 0.0168 0.0375 0.0045 0.0028 0.0035 0.0083 0.0059 GBR 0.0000 0.0012 . 0.0028 0.0014 0.0084 0.0095 0.0087 0.0095 0.0081 0.0104 0.0098 0.0219 0.0421 0.0189 0.0424 0.0046 0.0042 0.0044 0.0084 0.0059 FIN 0.0028 0.0042 0.0028 . 0.0050 0.0096 0.0109 0.0095 0.0107 0.0097 0.0108 0.0101 0.0247 0.0519 0.0229 0.0526 0.0068 0.0059 0.0072 0.0111 0.0083 IBS 0.0011 0.0006 0.0014 0.0050 . 0.0096 0.0110 0.0104 0.0112 0.0093 0.0128 0.0121 0.0201 0.0351 0.0157 0.0351 0.0043 0.0027 0.0033 0.0083 0.0067
E. Asian
CHB 0.0083 0.0088 0.0084 0.0096 0.0096 . 0.0017 0.0003 0.0020 0.0016 0.0021 0.0012 0.0213 0.0431 0.0198 0.0436 0.0066 0.0080 0.0090 0.0069 0.0078 JPT 0.0095 0.0098 0.0095 0.0109 0.0110 0.0017 . 0.0020 0.0037 0.0032 0.0002 0.0010 0.0226 0.0466 0.0213 0.0474 0.0080 0.0089 0.0102 0.0086 0.0088 CHS 0.0087 0.0092 0.0087 0.0095 0.0104 0.0003 0.0020 . 0.0015 0.0010 0.0024 0.0015 0.0230 0.0489 0.0223 0.0497 0.0074 0.0086 0.0101 0.0076 0.0083 CDX 0.0095 0.0101 0.0095 0.0107 0.0112 0.0020 0.0037 0.0015 . 0.0012 0.0037 0.0029 0.0229 0.0482 0.0217 0.0491 0.0083 0.0091 0.0106 0.0089 0.0089 KHV 0.0082 0.0084 0.0081 0.0097 0.0093 0.0016 0.0032 0.0010 0.0012 . 0.0037 0.0032 0.0207 0.0408 0.0187 0.0414 0.0067 0.0076 0.0085 0.0071 0.0075
NEAVA NJPT 0.0104 0.0112 0.0104 0.0108 0.0128 0.0021 0.0002 0.0024 0.0037 0.0037 . 0.0008 0.0268 0.0598 0.0275 0.0615 0.0093 0.0108 0.0131 0.0096 0.0100 NKOR 0.0098 0.0106 0.0098 0.0101 0.0121 0.0012 0.0010 0.0015 0.0029 0.0032 0.0008 . 0.0260 0.0582 0.0268 0.0595 0.0088 0.0103 0.0124 0.0089 0.0094
African YRI 0.0209 0.0203 0.0219 0.0247 0.0201 0.0213 0.0226 0.0230 0.0229 0.0207 0.0268 0.0260 . 0.0069 0.0024 0.0018 0.0191 0.0161 0.0168 0.0197 0.0211 LWK 0.0404 0.0369 0.0421 0.0519 0.0351 0.0431 0.0466 0.0489 0.0482 0.0408 0.0598 0.0582 0.0069 . 0.0049 0.0034 0.0339 0.0265 0.0259 0.0354 0.0404
Americas
ASW 0.0179 0.0168 0.0189 0.0229 0.0157 0.0198 0.0213 0.0223 0.0217 0.0187 0.0275 0.0268 0.0024 0.0049 . 0.0011 0.0152 0.0117 0.0116 0.0158 0.0186 ACB 0.0404 0.0375 0.0424 0.0526 0.0351 0.0436 0.0474 0.0497 0.0491 0.0414 0.0615 0.0595 0.0018 0.0034 0.0011 . 0.0340 0.0256 0.0251 0.0352 0.0402 MXL 0.0040 0.0045 0.0046 0.0068 0.0043 0.0066 0.0080 0.0074 0.0083 0.0067 0.0093 0.0088 0.0191 0.0339 0.0152 0.0340 . 0.0026 0.0026 0.0016 0.0068 PUR 0.0034 0.0028 0.0042 0.0059 0.0027 0.0080 0.0089 0.0086 0.0091 0.0076 0.0108 0.0103 0.0161 0.0265 0.0117 0.0256 0.0026 . 0.0017 0.0046 0.0068 CLM 0.0041 0.0035 0.0044 0.0072 0.0033 0.0090 0.0102 0.0101 0.0106 0.0085 0.0131 0.0124 0.0168 0.0259 0.0116 0.0251 0.0026 0.0017 . 0.0046 0.0071 PEL 0.0082 0.0083 0.0084 0.0111 0.0083 0.0069 0.0086 0.0076 0.0089 0.0071 0.0096 0.0089 0.0197 0.0354 0.0158 0.0352 0.0016 0.0046 0.0046 . 0.0089 S.Asian GIH 0.0058 0.0059 0.0059 0.0083 0.0067 0.0078 0.0088 0.0083 0.0089 0.0075 0.0100 0.0094 0.0211 0.0404 0.0186 0.0402 0.0068 0.0068 0.0071 0.0089 .
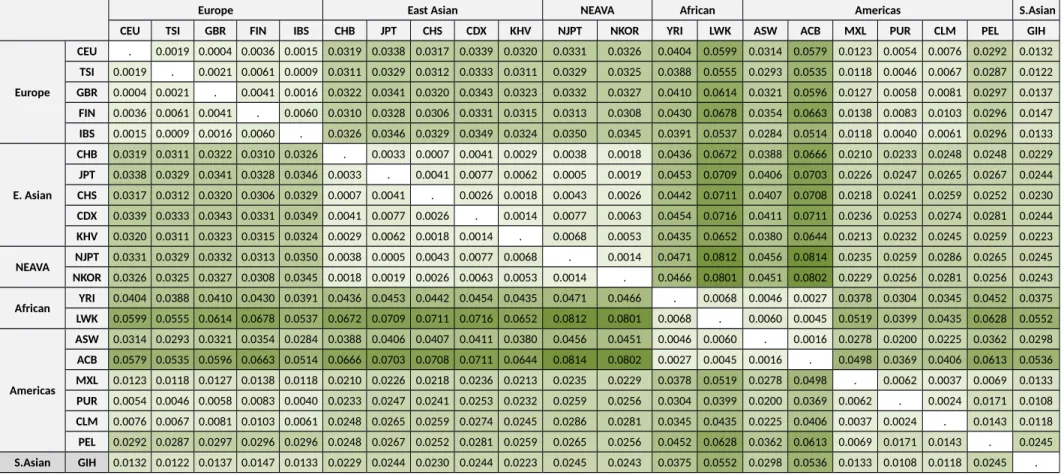
Table S5C: All Consensus
Europe East Asian NEAVA African Americas S.Asian
CEU TSI GBR FIN IBS CHB JPT CHS CDX KHV NJPT NKOR YRI LWK ASW ACB MXL PUR CLM PEL GIH
Europe
CEU . 0.0019 0.0004 0.0036 0.0015 0.0319 0.0338 0.0317 0.0339 0.0320 0.0331 0.0326 0.0404 0.0599 0.0314 0.0579 0.0123 0.0054 0.0076 0.0292 0.0132 TSI 0.0019 . 0.0021 0.0061 0.0009 0.0311 0.0329 0.0312 0.0333 0.0311 0.0329 0.0325 0.0388 0.0555 0.0293 0.0535 0.0118 0.0046 0.0067 0.0287 0.0122 GBR 0.0004 0.0021 . 0.0041 0.0016 0.0322 0.0341 0.0320 0.0343 0.0323 0.0332 0.0327 0.0410 0.0614 0.0321 0.0596 0.0127 0.0058 0.0081 0.0297 0.0137 FIN 0.0036 0.0061 0.0041 . 0.0060 0.0310 0.0328 0.0306 0.0331 0.0315 0.0313 0.0308 0.0430 0.0678 0.0354 0.0663 0.0138 0.0083 0.0103 0.0296 0.0147 IBS 0.0015 0.0009 0.0016 0.0060 . 0.0326 0.0346 0.0329 0.0349 0.0324 0.0350 0.0345 0.0391 0.0537 0.0284 0.0514 0.0118 0.0040 0.0061 0.0296 0.0133
E. Asian
CHB 0.0319 0.0311 0.0322 0.0310 0.0326 . 0.0033 0.0007 0.0041 0.0029 0.0038 0.0018 0.0436 0.0672 0.0388 0.0666 0.0210 0.0233 0.0248 0.0248 0.0229 JPT 0.0338 0.0329 0.0341 0.0328 0.0346 0.0033 . 0.0041 0.0077 0.0062 0.0005 0.0019 0.0453 0.0709 0.0406 0.0703 0.0226 0.0247 0.0265 0.0267 0.0244 CHS 0.0317 0.0312 0.0320 0.0306 0.0329 0.0007 0.0041 . 0.0026 0.0018 0.0043 0.0026 0.0442 0.0711 0.0407 0.0708 0.0218 0.0241 0.0259 0.0252 0.0230 CDX 0.0339 0.0333 0.0343 0.0331 0.0349 0.0041 0.0077 0.0026 . 0.0014 0.0077 0.0063 0.0454 0.0716 0.0411 0.0711 0.0236 0.0253 0.0274 0.0281 0.0244 KHV 0.0320 0.0311 0.0323 0.0315 0.0324 0.0029 0.0062 0.0018 0.0014 . 0.0068 0.0053 0.0435 0.0652 0.0380 0.0644 0.0213 0.0232 0.0245 0.0259 0.0223
NEAVA NJPT 0.0331 0.0329 0.0332 0.0313 0.0350 0.0038 0.0005 0.0043 0.0077 0.0068 . 0.0014 0.0471 0.0812 0.0456 0.0814 0.0235 0.0259 0.0286 0.0265 0.0245 NKOR 0.0326 0.0325 0.0327 0.0308 0.0345 0.0018 0.0019 0.0026 0.0063 0.0053 0.0014 . 0.0466 0.0801 0.0451 0.0802 0.0229 0.0256 0.0281 0.0256 0.0243
African YRI 0.0404 0.0388 0.0410 0.0430 0.0391 0.0436 0.0453 0.0442 0.0454 0.0435 0.0471 0.0466 . 0.0068 0.0046 0.0027 0.0378 0.0304 0.0345 0.0452 0.0375 LWK 0.0599 0.0555 0.0614 0.0678 0.0537 0.0672 0.0709 0.0711 0.0716 0.0652 0.0812 0.0801 0.0068 . 0.0060 0.0045 0.0519 0.0399 0.0435 0.0628 0.0552
Americas
ASW 0.0314 0.0293 0.0321 0.0354 0.0284 0.0388 0.0406 0.0407 0.0411 0.0380 0.0456 0.0451 0.0046 0.0060 . 0.0016 0.0278 0.0200 0.0225 0.0362 0.0298 ACB 0.0579 0.0535 0.0596 0.0663 0.0514 0.0666 0.0703 0.0708 0.0711 0.0644 0.0814 0.0802 0.0027 0.0045 0.0016 . 0.0498 0.0369 0.0406 0.0613 0.0536 MXL 0.0123 0.0118 0.0127 0.0138 0.0118 0.0210 0.0226 0.0218 0.0236 0.0213 0.0235 0.0229 0.0378 0.0519 0.0278 0.0498 . 0.0062 0.0037 0.0069 0.0133 PUR 0.0054 0.0046 0.0058 0.0083 0.0040 0.0233 0.0247 0.0241 0.0253 0.0232 0.0259 0.0256 0.0304 0.0399 0.0200 0.0369 0.0062 . 0.0024 0.0171 0.0108 CLM 0.0076 0.0067 0.0081 0.0103 0.0061 0.0248 0.0265 0.0259 0.0274 0.0245 0.0286 0.0281 0.0345 0.0435 0.0225 0.0406 0.0037 0.0024 . 0.0143 0.0118 PEL 0.0292 0.0287 0.0297 0.0296 0.0296 0.0248 0.0267 0.0252 0.0281 0.0259 0.0265 0.0256 0.0452 0.0628 0.0362 0.0613 0.0069 0.0171 0.0143 . 0.0245 S.Asian GIH 0.0132 0.0122 0.0137 0.0147 0.0133 0.0229 0.0244 0.0230 0.0244 0.0223 0.0245 0.0243 0.0375 0.0552 0.0298 0.0536 0.0133 0.0108 0.0118 0.0245 .
Table S5D: All Consensus (MAF < 0.05)
Europe East Asian NEAVA African Americas S.Asian
CEU TSI GBR FIN IBS CHB JPT CHS CDX KHV NJPT NKOR YRI LWK ASW ACB MXL PUR CLM PEL GIH
Europe
CEU . 0.0009 0.0003 0.0024 0.0010 0.0087 0.0098 0.0090 0.0098 0.0088 0.0106 0.0102 0.0202 0.0419 0.0188 0.0425 0.0042 0.0033 0.0040 0.0082 0.0057 TSI 0.0009 . 0.0012 0.0036 0.0007 0.0085 0.0095 0.0089 0.0096 0.0084 0.0108 0.0104 0.0191 0.0381 0.0173 0.0385 0.0038 0.0028 0.0033 0.0076 0.0051 GBR 0.0003 0.0012 . 0.0027 0.0012 0.0088 0.0099 0.0090 0.0100 0.0090 0.0105 0.0101 0.0207 0.0436 0.0195 0.0444 0.0045 0.0036 0.0044 0.0085 0.0060 FIN 0.0024 0.0036 0.0027 . 0.0039 0.0092 0.0103 0.0092 0.0104 0.0097 0.0102 0.0098 0.0230 0.0514 0.0229 0.0526 0.0062 0.0056 0.0067 0.0101 0.0073 IBS 0.0010 0.0007 0.0012 0.0039 . 0.0091 0.0103 0.0098 0.0104 0.0090 0.0121 0.0116 0.0185 0.0352 0.0159 0.0355 0.0036 0.0021 0.0026 0.0077 0.0057
E. Asian
CHB 0.0087 0.0085 0.0088 0.0092 0.0091 . 0.0018 0.0004 0.0021 0.0015 0.0022 0.0011 0.0201 0.0440 0.0200 0.0449 0.0069 0.0077 0.0086 0.0075 0.0076 JPT 0.0098 0.0095 0.0099 0.0103 0.0103 0.0018 . 0.0022 0.0041 0.0033 0.0002 0.0010 0.0211 0.0471 0.0212 0.0483 0.0078 0.0084 0.0097 0.0087 0.0086 CHS 0.0090 0.0089 0.0090 0.0092 0.0098 0.0004 0.0022 . 0.0015 0.0011 0.0023 0.0014 0.0214 0.0488 0.0221 0.0500 0.0075 0.0083 0.0096 0.0081 0.0079 CDX 0.0098 0.0096 0.0100 0.0104 0.0104 0.0021 0.0041 0.0015 . 0.0010 0.0041 0.0033 0.0214 0.0481 0.0217 0.0493 0.0081 0.0087 0.0101 0.0091 0.0086 KHV 0.0088 0.0084 0.0090 0.0097 0.0090 0.0015 0.0033 0.0011 0.0010 . 0.0038 0.0030 0.0196 0.0418 0.0190 0.0426 0.0069 0.0075 0.0084 0.0078 0.0075
NEAVA NJPT 0.0106 0.0108 0.0105 0.0102 0.0121 0.0022 0.0002 0.0023 0.0041 0.0038 . 0.0008 0.0251 0.0607 0.0275 0.0623 0.0093 0.0103 0.0124 0.0099 0.0095 NKOR 0.0102 0.0104 0.0101 0.0098 0.0116 0.0011 0.0010 0.0014 0.0033 0.0030 0.0008 . 0.0247 0.0594 0.0270 0.0609 0.0088 0.0100 0.0119 0.0093 0.0091
African YRI 0.0202 0.0191 0.0207 0.0230 0.0185 0.0201 0.0211 0.0214 0.0214 0.0196 0.0251 0.0247 . 0.0061 0.0021 0.0015 0.0177 0.0150 0.0156 0.0185 0.0197 LWK 0.0419 0.0381 0.0436 0.0514 0.0352 0.0440 0.0471 0.0488 0.0481 0.0418 0.0607 0.0594 0.0061 . 0.0046 0.0038 0.0344 0.0275 0.0275 0.0365 0.0404
Americas
ASW 0.0188 0.0173 0.0195 0.0229 0.0159 0.0200 0.0212 0.0221 0.0217 0.0190 0.0275 0.0270 0.0021 0.0046 . 0.0012 0.0154 0.0121 0.0121 0.0164 0.0187 ACB 0.0425 0.0385 0.0444 0.0526 0.0355 0.0449 0.0483 0.0500 0.0493 0.0426 0.0623 0.0609 0.0015 0.0038 0.0012 . 0.0345 0.0265 0.0270 0.0369 0.0410 MXL 0.0042 0.0038 0.0045 0.0062 0.0036 0.0069 0.0078 0.0075 0.0081 0.0069 0.0093 0.0088 0.0177 0.0344 0.0154 0.0345 . 0.0025 0.0018 0.0018 0.0060 PUR 0.0033 0.0028 0.0036 0.0056 0.0021 0.0077 0.0084 0.0083 0.0087 0.0075 0.0103 0.0100 0.0150 0.0275 0.0121 0.0265 0.0025 . 0.0014 0.0045 0.0059 CLM 0.0040 0.0033 0.0044 0.0067 0.0026 0.0086 0.0097 0.0096 0.0101 0.0084 0.0124 0.0119 0.0156 0.0275 0.0121 0.0270 0.0018 0.0014 . 0.0040 0.0065 PEL 0.0082 0.0076 0.0085 0.0101 0.0077 0.0075 0.0087 0.0081 0.0091 0.0078 0.0099 0.0093 0.0185 0.0365 0.0164 0.0369 0.0018 0.0045 0.0040 . 0.0082 S.Asian GIH 0.0057 0.0051 0.0060 0.0073 0.0057 0.0076 0.0086 0.0079 0.0086 0.0075 0.0095 0.0091 0.0197 0.0404 0.0187 0.0410 0.0060 0.0059 0.0065 0.0082 .
Gene SNV
N ns SNV identified ns SNV / singleton observed, N (% ns SNV)
ns SNV SNVs)N (%
Deleterious nsSNVs)N (%
Singleton nsSNVs)N (%
NEA
(N=631) EUR
(N=328) AFR
(N=180) AMR
(N=223) SAN
(N=70) Phase I
CYP1A1 46 36 (0.78) 26 (0.72) 18 (0.50) 16 (0.44) / 4
(0.25) 6 (0.17) / 2 (0.33) 11 (0.31) / 5
(0.45) 11 (0.31) / 7
(0.64) 3 (0.08) / 0 CYP1A2 40 31 (0.78) 20 (0.65) 19 (0.61) 12 (0.39) / 6
(0.50) 8 (0.26) / 5 (0.63) 6 (0.19) / 3
(0.50) 8 (0.26) / 3
(0.38) 5 (0.16) / 2 (0.40) CYP2A6 65 34 (0.52) 12 (0.35) 13 (0.38) 11 (0.32) / 2
(0.18) 10 (0.29) / 5
(0.50) 16 (0.47) / 5
(0.31) 13 (0.38) / 1
(0.08) 7 (0.21) / 0 CYP2B6 72 52 (0.72) 22 (0.42) 22 (0.42) 15 (0.29) / 8
(0.53) 15 (0.29) / 4
(0.27) 22 (0.42) / 3
(0.14) 15 (0.29) / 5
(0.33) 4 (0.08) / 2 (0.50) CYP2C19 48 33 (0.69) 15 (0.45) 15 (0.45) 11 (0.33) / 4
(0.36) 10 (0.30) / 4
(0.40) 10 (0.30) / 1
(0.10) 11 (0.33) / 3
(0.27) 8 (0.24) / 3 (0.38) CYP2C8 43 31 (0.72) 15 (0.48) 14 (0.45) 12 (0.39) / 4
(0.33) 10 (0.32) / 2
(0.20) 12 (0.39) / 3
(0.25) 11 (0.35) / 3
(0.27) 7 (0.23) / 2 (0.29) CYP2C9 32 24 (0.75) 13 (0.54) 12 (0.50) 10 (0.42) / 5
(0.50) 6 (0.25) / 1 (0.17) 9 (0.38) / 2
(0.22) 8 (0.33) / 3
(0.38) 4 (0.17) / 1 (0.25) CYP2D6 38 24 (0.63) 10 (0.42) 12 (0.50) 7 (0.29) / 4
(0.57) 12 (0.50) / 6
(0.50) 7 (0.29) / 2
(0.29) 6 (0.25) / 0 3 (0.13) / 0
CYP2E1 38 19 (0.50) 12 (0.63) 9 (0.47) 9 (0.47) / 5
(0.56) 5 (0.26) / 2 (0.40) 3 (0.16) / 0 5 (0.26) / 0 5 (0.26) / 2 (0.40)
CYP3A4 28 24 (0.86) 9 (0.38) 11 (0.46) 9 (0.38) / 3
(0.33) 11 (0.46) / 4
(0.36) 5 (0.21) / 2
(0.40) 5 (0.21) / 2
(0.40) 0 / 0
CYP3A5 22 15 (0.68) 7 (0.47) 9 (0.60) 8 (0.53) / 4
(0.50) 3 (0.20) / 2 (0.67) 3 (0.20) / 2
(0.67) 2 (0.13) / 1
(0.50) 1 (0.07) / 0 Phase II and Others
GSTM1 4 2 (0.50) 0 0 1 (0..50) / 0 2 (1.00) / 0 2 (1.00) / 0 2 (1.00) / 0 1 (0..50) / 0
NAT1 20 13 (0.65) 6 (0.46) 6 (0.46) 7 (0.54) / 4
(0.57) 6 (0.46) / 0 1 (0.08) / 1
(1.00) 6 (0.46) / 1
(0.17) 2 (0.15) / 0
NAT2 26 19 (0.73) 8 (0.42) 6 (0.32) 8 (0.42) / 3
(0.38) 4 (0.21) / 0 14 (0.74) / 2
(0.14) 9 (0.47) / 0 6 (0.32) / 1 (0.17) SULT1A1 32 19 (0.59) 7 (0.37) 12 (0.63) 9 (0.47) / 7
(0.78) 5 (0.26) / 1 (0.20) 5 (0.26) / 3
(0.60) 3 (0.16) / 1
(0.33) 0 / 0
TPMT 13 10 (0.77) 6 (0.60) 4 (0.40) 3 (0.30) / 1
(0.33) 5 (0.50) / 2 (0.40) 5 (0.50) / 0 5 (0.50) / 0 2 (0.20) / 1 (0.50) UGT1A1 33 19 (0.58) 13 (0.68) 13 (0.68) 12 (0.63) / 7
(0.58) 2 (0.11) / 1 (0.50) 2 (0.11) / 2
(1.00) 4 (0.21) / 3
(0.75) 2 (0.11) / 0 UGT2B15 35 26 (0.74) 19 (0.73) 12 (0.46) 7 (0.27) / 3
(0.43) 7 (0.27) / 3 (0.43) 11 (0.42) / 2
(0.18) 15 (0.58) / 4
(0.27) 4 (0.15) / 0 UGT2B17 21 15 (0.71) 6 (0.40) 4 (0.27) 2 (0.13) / 0 5 (0.33) / 2 (0.40) 8 (0.53) / 1
(0.13) 7 (0.47) / 1
(0.14) 0 / 0
UGT2B7 30 17 (0.57) 6 (0.35) 11 (0.65) 7 (0.41) / 4
(0.57) 6 (0.35) / 3 (0.50) 6 (0.35) / 2
(0.33) 4 (0.24) / 0 4 (0.24) / 2 (0.50)
GSTM1 4 2 (0.50) 0 0 1 (0.50) / 0 2 (1.00) / 0 2 (100) / 0 2 (1.00) / 0 1 (0.50) / 0
NR1I2 19 8 (0.42) 4 (0.50) 2 (0.25) 2 (0.25) / 0 2 (0.25) / 0 5 (0.63) / 2
(0.40) 3 (0.38) / 0 0 / 0
NR1I3 18 8 (0.44) 4 (0.50) 5 (0.63) 6 (0.75) / 4
(0.67) 0 / 0 1 (0.13) / 0 1 (0.13) / 1
(1.00) 0 / 0
DPYD 64 41 (0.64) 22 (0.54) 24 (0.59) 18 (0.44) / 9
(0.50) 12 (0.29) / 6
(0.50) 16 (0.39) / 5
(0.31) 13 (0.32) / 3
(0.23) 6 (0.15) / 1 (0.17) Transporters
ABCB1 55 39 (0.71) 8 (0.21) 22 (0.56) 17 (0.44) / 9
(0.53) 10 (0.26) / 5
(0.50) 8 (0.21) / 2
(0.25) 15 (0.38) / 6
(0.40) 5 (0.13) / 0 ABCC2 103 72 (0.70) 30 (0.42) 40 (0.56) 23 (0.32) / 15
(0.65) 28 (0.39) / 15
(0.54) 21 (0.29) / 4
(0.19) 20 (0.28) / 5
(0.25) 7 (0.10) / 1 (0.14) ABCG2 39 34 (0.87) 16 (0.47) 24 (0.71) 19 (0.56) / 14
(0.74) 11 (0.32) / 5
(0.45) 5 (0.15) / 2
(0.40) 7 (0.21) / 1
(0.14) 5 (0.15) / 2 (0.40) SLC15A2 38 20 (0.53) 9 (0.45) 14 (0.70) 8 (0.40) / 5
(0.63) 4 (0.20) / 1 (0.25) 8 (0.40) / 3
(0.38) 7 (0.35) / 4
(0.57) 5 (0.25) / 1 (0.20) SLC22A1 65 47 (0.72) 23 (0.49) 20 (0.43) 23 (0.49) / 9
(0.39) 13 (0.28) / 1
(0.08) 18 (0.38) / 5
(0.28) 12 (0.26) / 3
(0.25) 9 (0.19) / 2 (0.22) SLC22A2 37 26 (0.70) 11 (0.42) 14 (0.54) 9 (0.35) / 3
(0.33) 4 (0.15) / 3 (0.75) 6 (0.23) / 2
(0.33) 8 (0.31) / 3
(0.38) 4 (0.15) / 3 (0.75)
SLC22A6 17 9 (0.53) 1 (0.11) 5 (0.56) 3 (0.33) / 2
(0.67) 2 (0.22) / 0 (0.00) 2 (0.22) / 1
(0.50) 3 (0.33) / 2
(0.67) 1 (0.11) / 0 SLC47A1 27 18 (0.67) 8 (0.44) 12 (0.67) 6 (0.33) / 3
(0.50) 6 (0.33) / 3 (0.50) 2 (0.11) / 1
(0.50) 8 (0.44) / 4
(0.50) 1 (0.06) / 1 (1.00) SLC47A2 22 15 (0.68) 10 (0.67) 10 (0.67) 7 (0.47) / 6
(0.86) 5 (0.33) / 2 (0.40) 3 (0.20) / 2
(0.67) 3 (0.20) / 0 1 (0.07) / 0 SLCO1A2 31 23 (0.74) 8 (0.35) 12 (0.52) 7 (0.30) / 3
(0.43) 4 (0.17) / 2 (0.50) 11 (0.48) / 4
(0.36) 6 (0.26) / 3
(0.50) 3 (0.13) / 0 SLCO1B1 61 44 (0.72) 22 (0.50) 28 (0.64) 22 (0.50) / 12 9 (0.20) / 4 (0.44) 16 (0.36) / 7 11 (0.25) / 4 7 (0.16) / 1
SLCO1B3 53 35 (0.66) 19 (0.54) 20 (0.57) 13 (0.37) / 6
(0.46) 8 (0.23) / 4 (0.50) 15 (0.43) / 5
(0.33) 13 (0.37) / 5
(0.38) 4 (0.11) / 0 SLCO2B1 46 29 (0.63) 12 (0.41) 18 (0.62) 14 (0.48) / 7
(0.50) 11 (0.38) / 5
(0.45) 5 (0.17) / 2
(0.40) 7 (0.24) / 3
(0.43) 5 (0.17) / 1 (0.20)
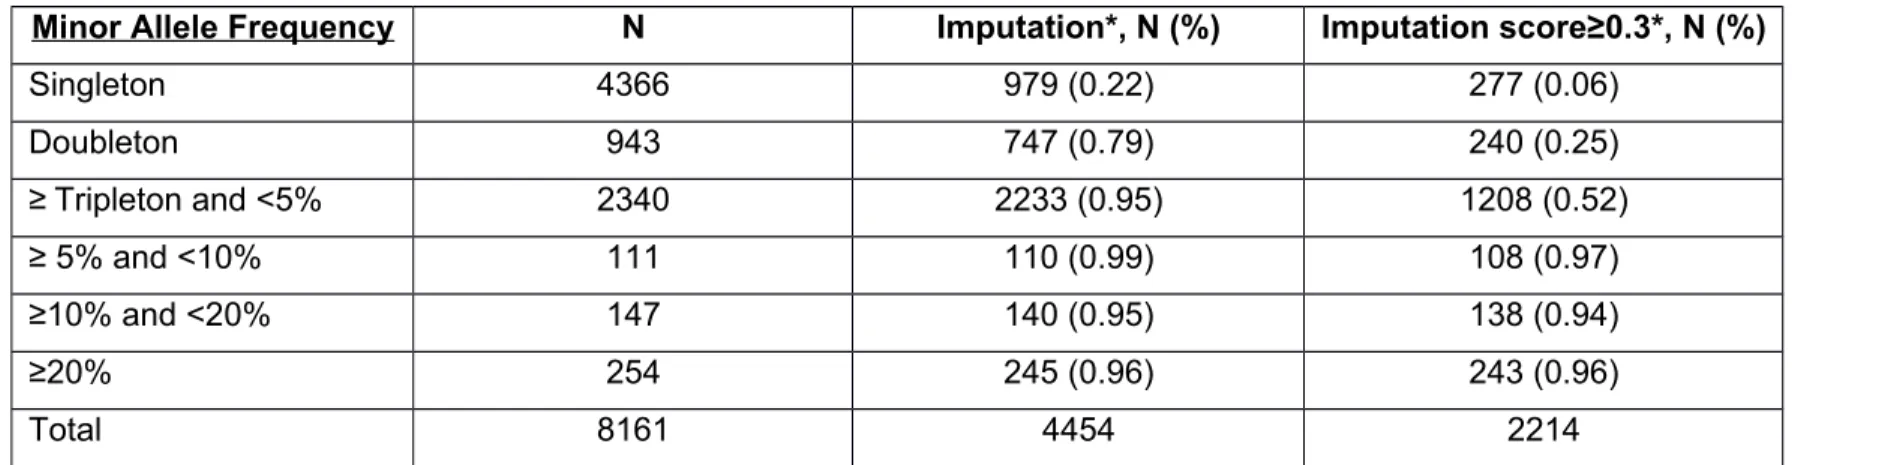
Table S7: A summary of imputability distribution based on MAF for ADME SNVs
Minor Allele Frequency N Imputation*, N (%) Imputation score≥0.3*, N (%)
Singleton 4366 979 (0.22) 277 (0.06)
Doubleton 943 747 (0.79) 240 (0.25)
≥Tripleton and <5% 2340 2233 (0.95) 1208 (0.52)
≥ 5% and <10% 111 110 (0.99) 108 (0.97)
≥10% and <20% 147 140 (0.95) 138 (0.94)
≥20% 254 245 (0.96) 243 (0.96)
Total 8161 4454 2214
*
Imputation was summarized using the existed dataset from European population (N=5399) , which were genotyped via the Axiom® Biobank
Genotyping Array (Affymetrix, Santa Clara, CA) and imputed using Hidden Markov Model methods as implemented in MaCH and minimac based on a cosmopolitan haplotype reference panel from the 1000 Genomes Project phase 3.
Figure S1: Exome Sequence Capture of NEAVA and 1000G Subjects
Figure depicting target and capture regions for the exome sequencing protocols used in sequencing NEAVA and 1000G samples. Blue-shaded rows correspond to non-ADME coding sequence, and orange-shaded rows correspond to ADME coding sequence. In total, 73% of all ADME coding sequence is captured at high depth (≥20x) across all 1,432 samples used in this study
Figure S2: Depth of Sequence Coverage of ADME Genes
Figure S3A: Principal Component Analyses (Joint Samples)
Principal component analyses for the joint sample (N=1,432; see Table S1) This analysis used common (MAF >5%), linkage-disequilibium-pruned set of single nucleotide polymorphisms located in our exome-wide consensus capture regions (see Figure S1) Principal components 1 and 2 are plotted Samples cluster by geographical location of ancestral populations as expected
Figure S3B: Principal Component Analyses (Northeast/East Asian)
Principal component analyses for the Northeast Asian/East Asian sample (N=631; see Table S1) This analysis used common (MAF >5%), linkage-disequilibium-pruned set of single nucleotide variants polymorphic in the NEA subsample All variants were located in our exome-wide consensus capture regions (see Figure S1) Principal components 1 and 2 are plotted
Figure S4: Variant Discovery in Consensus ADME vs Consensus Non-ADME Regions (All Populations) A: All SNVs
B: Nonsynonymous SNVs
C: Synonymous SNVs
Variant discovery curves for all 21 individual populations in this study using all synonymous single nucleotide variation in consensus capture regions Variant discovery curves were used to compare the rate at which variation was discovered in population samples of different sizes Panel A uses all single nucleotide variation in consensus capture regions; Panel B uses all nonsynonymous single nucleotide variation in consensus capture regions and Panel C uses all synonymous single nucleotide variation in consensus capture regions Solid line, dot, and dashed line represent hypergeometric expectation, observed number of variants and jackknife
projections, respectively, for each population Similar quantities of synonymous variation (per kilobase) are observed in ADME vs non-ADME coding sequence across all 21 populations
Figure S5: Variant Discovery In Consensus ADME vs Consensus Non-ADME Regions For Selected Populations
A: Nonsynonymous
B: Synonymous
Variant discovery curves for 6 selected individual populations (YRI, CHB, CEU, JPT, NKOR, NJPN; see Table S1) Variant discovery curves were used to compare the rate at which variation was discovered in population samples of different sizes Panel A uses all nonsynonymous single nucleotide variation in consensus capture regions; Panel B uses all synonymous single nucleotide variation in consensus capture regions Greater quantities of nonsynonymous variation (per kilobase) are observed in ADME vs non-ADME coding sequence across all selected populations; little difference in quantity of
discovered variation exists when comparing rates of synonymous variation in ADME and non-ADME regions
Consensus ADME Regions Consensus Non-ADME Regions Consensus ADME Regions Consensus Non-ADME Regions
Figure S6: Rates of ADME Variation per Individual across Continental and Sub-Continental Populations
Totals reflect all consensus ADME variation per individual (including variants in both core & extended ADME genes) A & B) Rates of variation per individual at the continental level across variant category C) Proportion of individuals carrying ≥1 knockout (nonsense) allele (all, novel) within continental populations D & E) Rates of variation per individual at sub-continental level across variant category F) Proportion of individuals carrying ≥1 knockout allele (all, novel) within sub-continental populations
F D E
A B C
Figure S7: Private Variation (Stratified by MAF and Predicted Deleteriousness) at Individual and Continental Level
Private variation across 21 individual study populations Private defined as variants seen in only a single individual or continental population AFR=African; AMR=American; EUR=European;
NEA=Northeast Asian; CONTPOP=Continental population; Del=Deleterious; NotDel=Not Deleterious
Figure S8: Allele-Sharing Across MAF (Consensus ADME Regions)
Allele sharing across minor allele frequency for selected populations Allele sharing is defined as the probability that two individuals carrying an allele with a given minor allele frequency come from different populations, normalized by the expected frequency in a panmictic population (eg, a population with random mating) CEU=Utah residents with Northern and Western European ancestry; JPT=Japanese in Tokyo, Japan;
NKOR=Korean in Seoul, South Korea; NJPN=Japanese on Kyushu Island in Japan; YRI=Yoruba in Ibadan, Nigeria Geographically closer populations show higher allele sharing ratios, most notably at lower minor allele frequencies