I really appreciate the research atmosphere in Institute of Software Integrated Systems, and I would like to thank every member who made this experience unforgettable. In addition, I would like to thank my Chinese friends at Vanderbilt, especially Weihan Wang, Jiani Li, Xuyi Luo, Huahong Zhang, Yasi Wang, Yongtai Liu, Tengyu Ma, Xiaojia Zhao, Pengfei Wang, Xinle Hong, Ruohan Wang, and Xiao Li, for the making life in a foreign country pleasant without being more lonely.
Motivation
However, the time series sequence deviates significantly from the normal sequential behavior and is outside the distribution of normal sequences.
System Model and Research Challenges
The timing and memory requirements should be similar to the LEC requirements used in the CPS architecture. The detection of some specific cyber attacks, such as replay attacks on sensor measurements, must consider time series sequences because point detection methods will easily bypass nuanced attacks.
Research Contributions
The execution time is comparable to the sampling period of typical CPSs, which enables real-time detection. The execution time of the detection method is much shorter than the sampling period of the system, which indicates that the proposed method can be used for real-time detection.
Organization
Then, in Section 2.3, we provide a state-of-the-art review on anomaly detection, with a special focus on the methods that use deep neural networks. We briefly discuss the related work on novelty detection for unknown classes and anomaly detection for reinforcement learning in Section 2.5 and Section 2.6, respectively.
Safety Assurance in Learning-enabled Cyber-physical Systems
In this chapter, we review the related work in the research of OOD detection in learning-enabled CPSs. OOD detection can be used with repair and reconfiguration techniques to supplement design-time verification.
Security of Cyber-physical Systems
Focusing on design-time techniques, a Feature Space Partitioning Tree (FSPT) is used to partition the input feature space into multiple partitions and to identify those partitions where the training samples are insufficient in [15]. The technique is also used at design time to increase the reliability of autonomous CPS and can provide additional training data for OOD detection.
Anomaly Detection
Conventional Anomaly Detection
Nonparametric methods that make no assumption of prior knowledge of the distribution can overcome this obstacle. Also, some variants have been raised and the anomaly score can be calculated as the sum of nearest neighbor distances [34], or as the inverse of the number of nearest neighbors whose distances are less than a threshold [35 ].
Anomaly Detection using Deep Neural Networks
To solve the disadvantage of AnoGAN, efficient GAN-based anomaly detection (EGBAD) and fast AnoGAN (f-AnoGAN) are proposed by [56] and [57] respectively. GANomaly [58] is another GAN-based anomaly detection method that extends the idea of EGBAD and f-AnoGAN.
Conformal Anomaly Detection
The proposed approach adapts the reinforcement learning method by considering the problem of anomaly detection in time series as a Markov decision process (MDP) and redefining the optimization object of reinforcement learning as maximizing the performance of the detector . The proposed method takes a set of normal trajectories as input, and the normal behavior can be understood by the reward function derived from IRL.
Anomaly Detection for Neural Networks
Out-of-distribution Detection for Neural Networks
The anomaly score is defined as the combined log-likelihood of a transformed image conditioned on each of the applied transformations [75] and can be used to detect OOD instance. The information from the monitored neural network, such as predictions and features in the hidden layers, can be used to detect the OOD samples.
Adversarial Examples Detection in Neural Networks
Thus, the latter method estimates the uncertainty of the prediction using a dropout neural network, and the uncertainty can be used to detect the adversarial examples. Then, the score assigned by the thek-NN classifier to the class predicted by the neural network can be used as the confidence of the classification.
Novelty Detection for Unknown Classes
The latter means that while the origin changes slightly, the activation values of the neurons can differ significantly from those in the presence of benign inputs. This can be achieved by training a set of one-class classification models for individual layers using only activation values and status of benign examples.
Out-of-distribution Detection for Reinforcement Learning
Neural Network Interpretability
Introduction
The main contribution of the chapter is an approach for real-time detection of OOD inputs. Therefore, the detection algorithm weights the input features based on their influence on the output of the LEC.
Problem Formulation
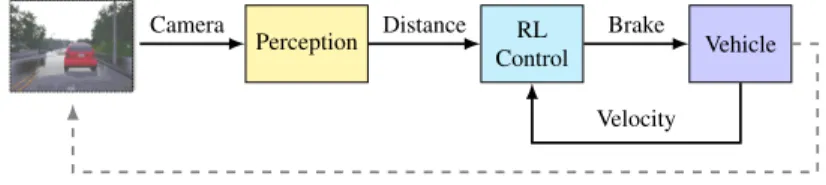
The objective of AVSD is to estimate the direction changes of a host vehicle from images captured by a camera. For all cases, the execution time of the detection method is comparable to the execution time of the original LECs, which indicates that the method can be used in real time.
VAE-based Detection
Offline Training and Nonconformity Measure
The non-conformance scores of the calibration samples are sorted and saved so that they can be used at runtime. The pre-computed non-conformance scores from the calibration data are sorted and stored for use at runtime.
Online Detection
However, if the input is sampled from the same distribution as the training data set, the p-values will be large, and they can be used for OOD detection. An alarm is raised when St is greater than a thresholdSt>τ, which can be optimized using empirical data [106].
SVDD-based Detection
Offline Training and Nonconformity Measure
During the offline phase, nonconformity scores for the calibration data are precalculated using equation (3.4) and sorted for use at runtime.
Online Detection
Compared to VAE, the SVDD-based method is more efficient as it does not require the generation of multiple examples at each step. MartingaleMt can be calculated recursively by incorporating the p-value of the new input and leaving out the last one in the sliding window.
Saliency Maps
VAE-based Detection with Saliency Maps
We define the NCM by weighting the squared error between the input sample x and a generated sample ˆx of the UAE using the saliency maps. The proper training dataset is used to train both the LEC and the UAE network.
SVDD-based Detection with Saliency Maps
During runtime monitoring, given a test input x′t, the algorithm computes the observability maps′t=G(xt′;f) and uses the observability-masked input ˜x′t as input to the SVDD network to compute the discrepancy scoreαt′ as well as the-value for the test case. 3.4, a sliding window is used to adjust the martingale test, and a stateless detector is used to generate alarms for OOD cases.
Evaluation
- Advanced Emergency Braking System
- Experimental Setup
- VAE and SVDD training
- Experimental Results
- Self-driving End-to-end Control
- Experimental Setup
- Experimental Results
- Autonomous Vehicle Seasonal Dataset
- Experimental Setup
- Experimental Results
- Computational Efficiency
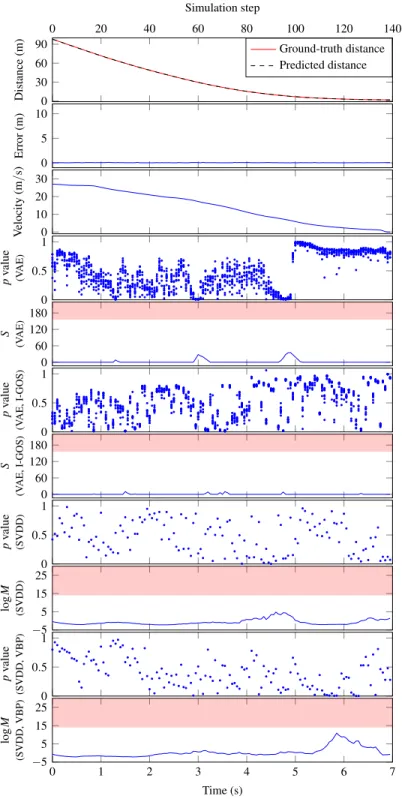
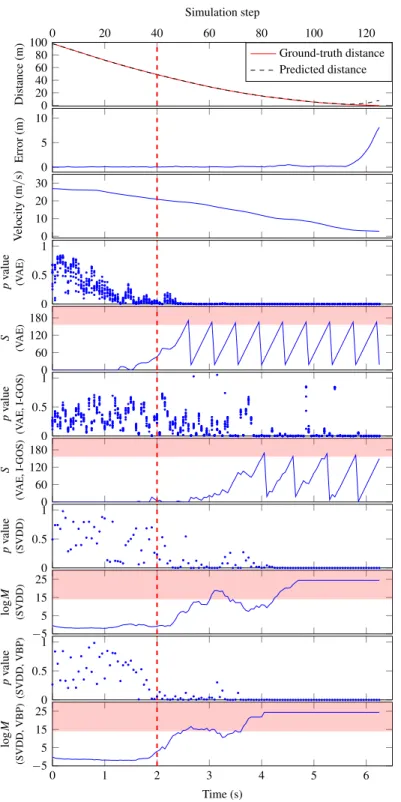
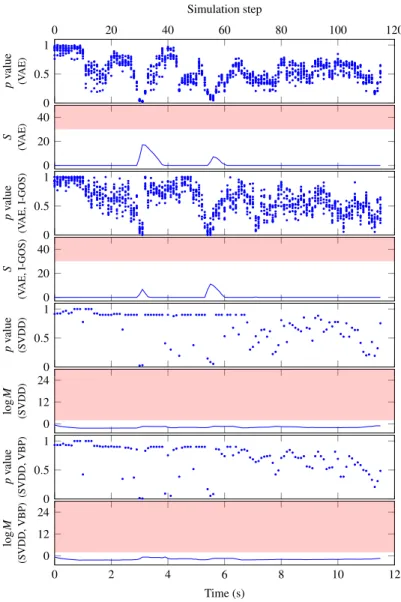
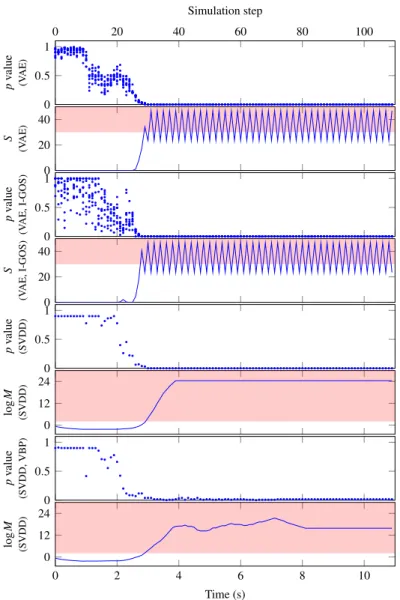
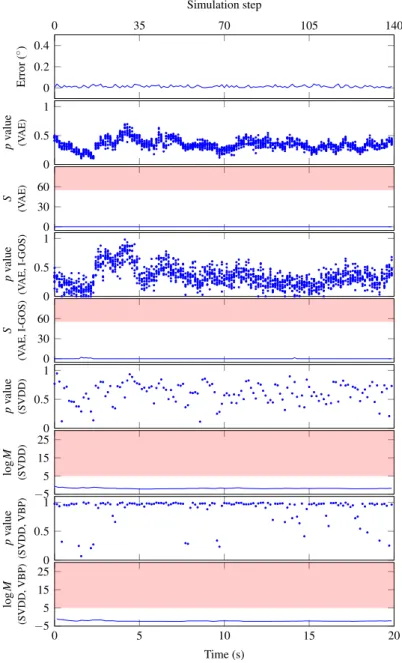
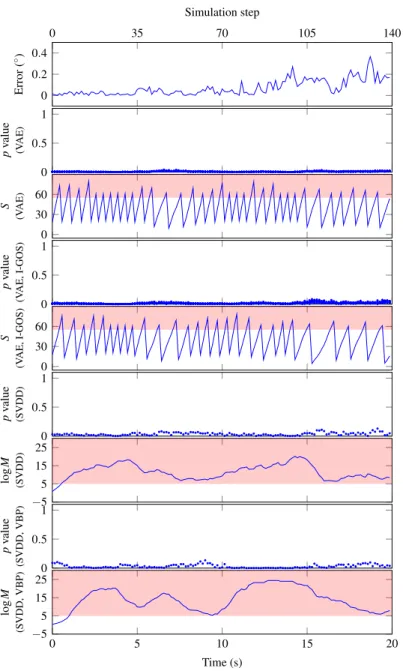
The results of VAE and SVDD based methods with saliency maps are presented similarly. We plot the p-values and detector output of the VAE-based method, the p-values and logarithm of the SVDD-based method.
Conclusion
The first contribution of this chapter is the definitions for different types of OOD data found in learning-enabled CPS. The main contribution of the chapter is an approach to detect a variety of OOD data in learning.
Out-of-distribution Data in Learning-enabled Cyber-physical Systems
Formal Definition of Out-of-distribution Data
- OOD data caused by covariate shift
- OOD data caused by label shift
- OOD data caused by concept shift
- OOD data caused by label concept shift
OOD data caused by label shifting can be defined as the data where the output variable y is not sampled from the training distribution Ptrain(y), while the conditional probability of xgee remains the same, i.e. Ptrain(x|y) =Ptest(x|y). OOD data induced by label concept shifting can be defined as the data where the output variable y is sampled from the same distribution as the training data set Ptrain(y), while giving the conditional probability of x and changing such that Ptrain(x|y)̸=Ptest(x| y).
Examples of OOD Data
- Classification
- Regression
Using the definition for OOD data caused by a concept shift, assume that the input variable x is from the same distribution as the training data setPtrain(x), while the ratio of the input to the output changes, ie. Ptrain(y|x)̸=Ptest (y|x). In this case, the conditional probability P(x|y) changes, and such data can be considered as OOD data caused by a shift in the label concept.
Problem Formulation
In this case, although damage types in the test examples are still the same, the underlying ratio P(x|y) changes due to additional load. In this case, the perception performs LEC regression, and its performance can be degraded in the case of OOD data caused by covariate shift that arises when the environmental conditions for the test data differ from conditions considered during training.
Detection of Out-of-distribution Data in Learning-enabled Cyber-physical Systems
VAE for Classification and Regression
Recently, a calibrated decoder architecture called σ-VAE, which can automatically tune the trade-off and improve the quality of the generated samples, has been developed in [116], The idea of σ-VAE is to add a weighting parameter σ between the reconstruction term and the KL -divergence term. This technique can also be used with the proposed VAE for classification and regression models in a similar way by adding the weighting parameter σ in the reconstruction term in Eq.
Inductive Out-of-distribution Detection
- Nonconformity measures
- Detection method
Therefore, for a test examplexn its predictive label′, the distance of the representation to its corresponding class center can be defined as the distance-based NCM. A martingale can be used to test whether there are many smallp values in the set [69].
Evaluation
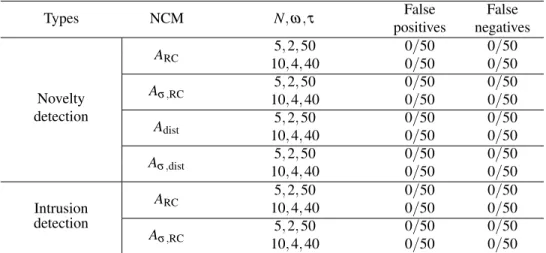
- IoT Network Intrusion
- Experimental setup
- Evaluation metrics
- Novelty detection for unknown classes
- Intrusion detection
- Gearbox Fault Detection
- MNIST Dataset
- Advanced Emergency Braking System
- Autonomous Vehicle Seasonal Dataset
- Experimental setup
- Experimental Results
- Computational Efficiency
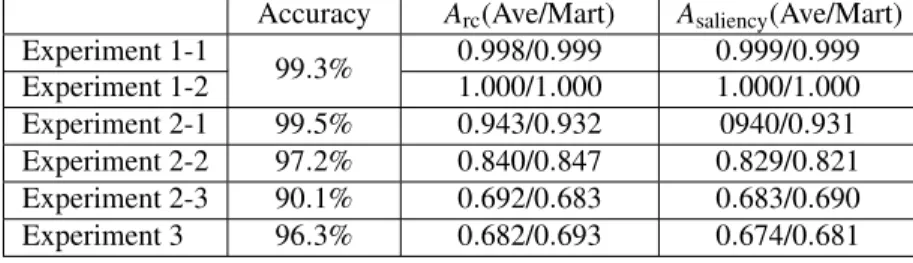
We first train VAE on the classification model on the MNIST dataset to evaluate the approach in detecting OOD data caused by covariate drift. Data from unknown classes can be viewed as OOD data caused by label displacement.
Conclusion
Introduction
By using such an architecture, the joint distribution of the input and output variables on the training data set can be represented. Although multiple examples are considered, our approach focuses on comparing a single test example to the training distribution.
Out-of-distribution Detection in Machine Learning Components for Classification
Problem Formulation
Therefore, the input and output of the machine learning component can be considered in OOD detection. The robustness of the detector can be improved by including more examples in the detection algorithm as in Section 3.
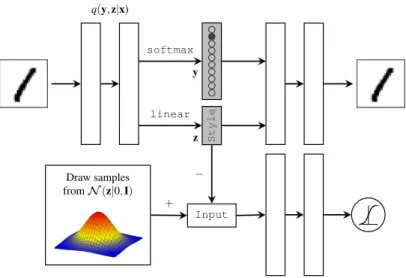
Adversarial Autoencoder and Out-of-distribution Detection
Adversarial Autoencoder
The detection must be performed efficiently and preferably online, which means that the execution time should be comparable to the execution time of the machine learning component. It is a major challenge as machine learning components are increasingly used for tasks involving high-dimensional data.
Inductive Conformal Out-of-distribution Detection
- Nonconformity measures
- Detection method
If x and its predictive label are from the same joint distribution of the training data set, sample x should be reconstructed with a relatively small reconstruction error. A saliency map algorithm aims to quantify the contributions of input features to the predictive output of a machine learning model [92].
Evaluation
- Experiment Implementation
- Neural network architecture
- Evaluation metrics
- Out-of-distribution Data Caused by Covariate Shift
- Out-of-distribution Data Caused by Label Shift
- Out-of-distribution Data Caused by Concept Shift
- Execution Time
Therefore, the proposed method can be used to detect out-of-distribution data caused by covariate drift. Experiment 3: OOD data caused by concept drift is present when the output variable yi is taken from the training data set, but the conditional probability iP(x|y) changes.
Conclusion
Introduction
The evaluation of such an attack validates the effectiveness of the proposed approach for detecting controller integrity attacks using high-dimensional sensor observations. The remainder of the chapter is structured as follows: Section 6.2 presents the system and threat model, and.
Problem Formulation
Inspired by the world model, Section 6.4 introduces a generative model used for attack detection, which is a fundamental component of the proposed approach. At each time step, the purpose of the detection is to quantify how strange the time series up to the current step is compared to the normal system behavior.
World Model
Generative Model for Detection
The goal is to predict the probability distribution of the latent representation in the next time step. To model the probability distribution of the latent representation, a Mixture Density Network (MDD) [136] is connected after the RNN as the output layer as in the training for the world model [134].
Attack Detection
Nonconformity Measure
To overcome this limitation, a generative model is used to predict observations several time steps into the future. The difference between the actual observation and the expected observation, which is predicted from several steps in the past, can be used to monitor long-term dependencies.
Detection Algorithm
- Offline phase
- Online phase
The next step is to calculate the nonconformance scores for the sequences in the calibration set. Again, since the nonconformity scores for the calibration data are sorted in the offline phase, the calculation of p-values can be accelerated by using a binary search algorithm.
Evaluation
Advanced Emergency Braking System
- Experimental setup
- Replay attack I
- Replay attack II
- Stuck sensor attack
The results show that the proposed method can detect such a sensor replay attack with few false alarms and a very short delay. The results show that the approach can detect the slowly changing replay attack with a small false alarm.
Autonomous Car Racing
- Experimental setup
- Experimental results
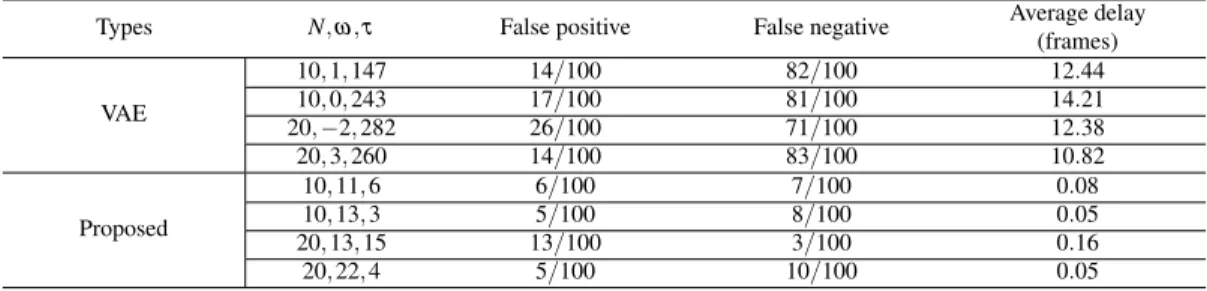
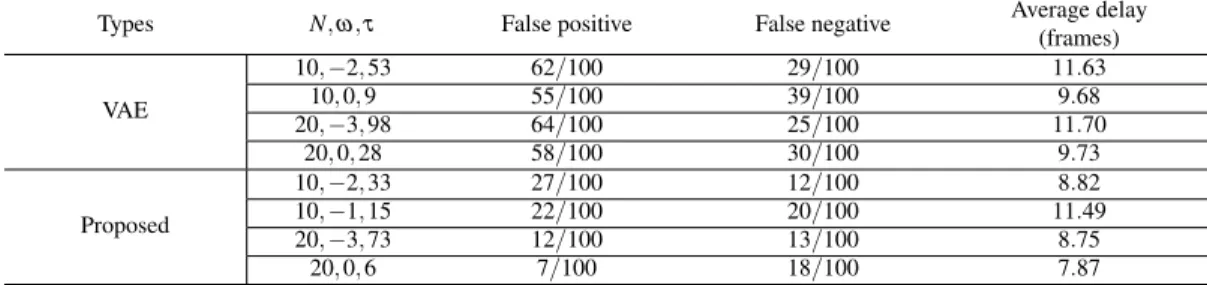
We evaluate the VAE-based method and the proposed method using 100 episodes with normal sequences and 100 episodes with abnormal sequences. In this episode, the attack starts at time step 64 and the car then makes a sharp left turn off the track.
Computational Efficiency
Conclusion
Boult, ‘Towards open set deep networks’, in IEEE Conference on Computer Vision and Pattern Recognition (CVPR), 2016. Dietterich, ‘Deep anomaly detectie with outlier exposure’, in 7th International Conference on Learning Representations (ICLR), 2019.
False alarms and average delay in AEBS
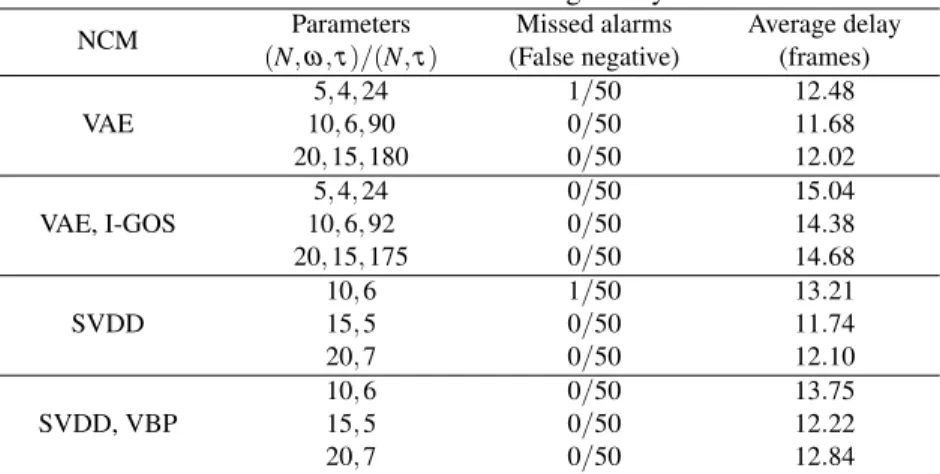
Missed alarms and average delay in AEBS
False alarms and average delay in AVSD
Missed alarms and average delay in AVSD
Execution times of VAE- and SVDD-based detection methods
False alarms for detecting OOD data in N-BaIoT dataset
AURO for detecting OOD data in IoTID20 dataset
Classification accuracy and AUROC for detecting OOD data in gearbox dataset
VAE for classification architecture in MNIST
AUROC for detecting OOD data in MNIST dataset
VAE for regression architecture in AEBS
False alarms for detecting OOD data in AEBS
False alarms for detecting OOD data caused by covariate shift in AVSD
AUROC for inductive out-of-distribution detection
False alarms and detection delay for detecting sensor replay attack I in AEBS
False alarms and detection delay for detecting sensor replay attack II in AEBS
False alarms and detection delay for detecting stuck sensor attack in AEBS
False alarms and detection delay for detecting controller integrity attacks in autonomous
Execution times (ms) for detecting sensor replay attack in AEBS
Simplified CPS control architecture
Summary of related work
Architecture of AEBS
Illustration of AEBS
An episode with in-distribution inputs in AEBS (detector parameter: (1) VAE-based: N =
An episode with OOD inputs in AEBS (detector parameter: (1) VAE-based: N = 10,
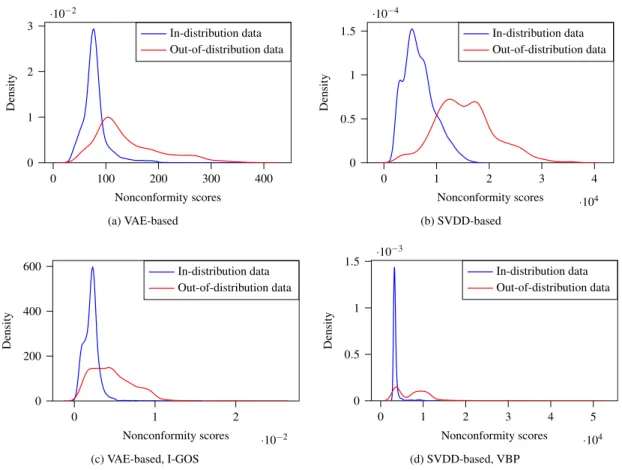
Distributions of the nonconformity scores in AEBS
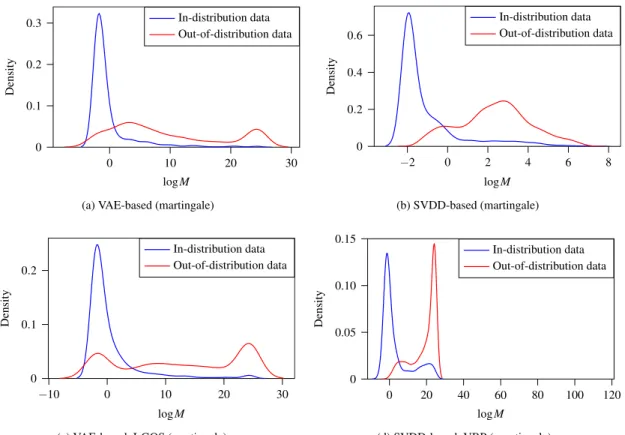
Distributions of the martingales in AEBS
Original image and its saliency maps for AEBS
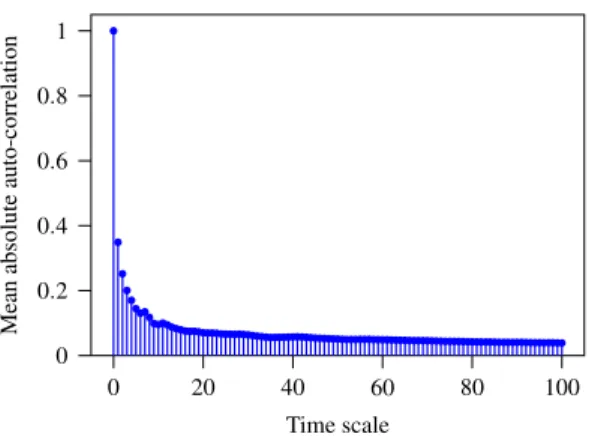
Mean absolute auto-correlation of the nonconformity scores in AEBS
Architecture of SDEC
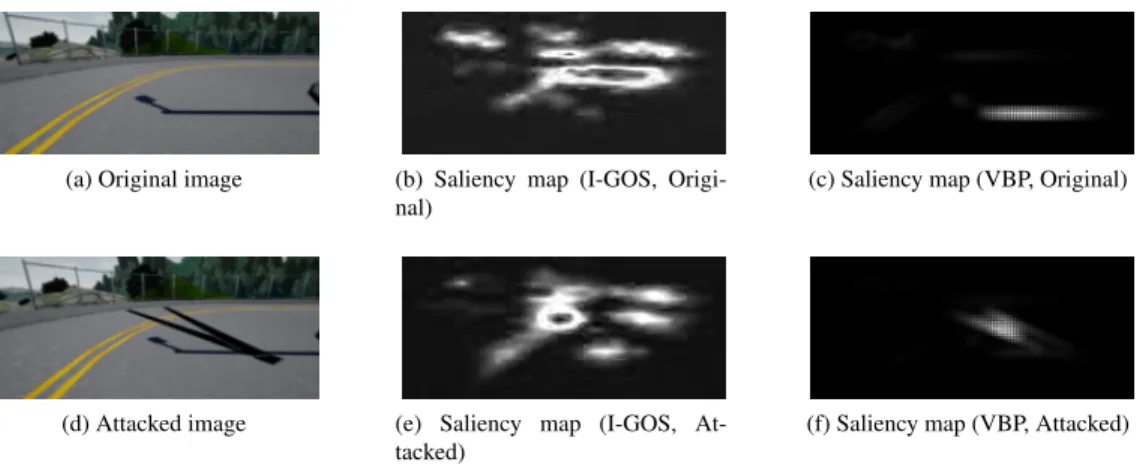
Original image, physical adversarial image and their saliency maps for SDEC
An episode with in-distribution inputs in SDEC (detector parameter: (1) VAE-based: N =
An episode with attacked inputs in SDEC (detector parameter: (1) VAE-based: N = 10,
An episode with in-distribution inputs in AVSD (detector parameter: (1) VAE-based: N =
An episode with OOD inputs in AVSD (detector parameter: (1) VAE-based: N = 10,
In-distribution and OOD images and their saliency maps for AVSD
Variational autoencoder for classification and regression model. Note that ”Predictor” can
Histogram of ground-truth distance in training dataset
Histogram of ground-truth distance of training dataset that excludes data ranging from
An episode with OOD data caused by label shift in AEBS (detector parameter: N = 10,
An episode with OOD data caused by label concept shift in AEBS (detector parameter
Execution times of proposed method
A variant of the adversarial autoencoder model
Execution times of proposed method
A typical CPS architecture
The architecture of the world model
Illustration of 1-step nonconformity measure using the proposed generative model