Thesis by
Matthew Mitchell Coggon
In Partial Fulfillment of the Requirements for the Degree of
Doctor of Philosophy
California Institute of Technology Pasadena, California
2016
(Defended September 18, 2015)
c 2016
Matthew Mitchell Coggon All Rights Reserved
To my siblings, Mark and Kara.
Thank you for teaching me how to overcome hardship.
Acknowledgements
There are many people who have played a role in my success at Caltech. First, I would like to thank my advisor, John Seinfeld, for his scientific guidance. I owe much of my professional growth to the trust and tremendous freedom that I was provided. John gave me many opportunities, and for those I am very grateful.
I would like to thank my co-advisor, Rick Flagan, for his valuable guidance both in and out of lab. I felt very lucky to have a resource whom I could turn to for field, instrument, and kayaking advice. His breadth of experience helped me through countless challenges.
I would like to thank my committee member, Armin Sorooshian, for his mentorship and encour- agement over the past five years. I was fortunate to work with Armin on three field campaigns and soak in his scientific and life advice. His collaboration was crucial towards my success at Caltech.
Thanks, Dutt.
I would also like to thank Paul Wennberg for serving on my committees and teaching me the basics of atmospheric science. He and his group have provided incredibly helpful discussions that have expanded my understanding of atmospheric chemistry.
When I first joined the Seinfeld Group, there were a number of students whose assistance, guidance, and mentorship were essential to setting my scientific groundwork. First, I must give enormous thanks to Jill Craven. In addition to being a phenomenal friend and kayaking buddy, Jill was my AMS mentor and big sib coach. In no way would I have made it through my first few years without her help and I’m looking forward to continued friendship and future paddling sessions in the Northwest and on the Colorado River. Many thanks to Andrew Metcalf, Scott Hersey, Christine Loza, and Lindsay Yee for being fantastic role models in the field and lab. Their wealth of knowledge and experience taught me a lot about how to approach atmospheric science research. Special thanks to Joey Ensberg for keeping the Schlinger office fun and intellectually stimulating. Prince, Michael Jackson, and Whitney Houston will always be in my karaoke repertoire.
I would also like to thank current Seinfeld members for their passionate pursuit of science. Many thanks to chamber folks: Xuan Zhang and Becky Schwantes for their positive attitudes and assistance on chamber studies, Tran Nguyen for her amazing insights into challenging chemistry, Renee McVay for her insights into the processes dictating chamber dynamics, Dandan Huang for her enthusiasm
campaign. Thank you Wilton/Vivasia for keeping it fun on the tarmac and Natasha for being a great model of work/life balance. Many thanks to Kelvin for being an phenomenal successor to the Caltech AMS line – I can’t think of a person more fit to work with that instrument.
I would like to thank the flow tube crew for all the work put into designing and developing our lab’s newest apparatus. Special thanks to Hanna Lignell for enthusiastically jumping into the project and working diligently to build a robust system. I’m incredibly impressed with our team effort and I’m incredibly grateful for her positivity and friendship. Many thanks to Yuanlong Huang, Michael Bauer, and Ran Zhao for taking on the challenge to model the flow tube dynamics and stepping up as the next flow tube users.
There are several collaborators and support staff to whom I extend my biggest thanks. At Caltech, I thank Yvette Grant and Martha Hepworth for their purchasing support, Nora Oshima and Kathy Young for laboratory and office maintenance, Suresh Guptha for instrument assistance, and Nathan Dalleska for detailed chemical analysis and boating discussions. I would like to thank the staff in the Athletics Department, especially John Carter, Betsy Mitchell, and Heather Morgan, for providing the Paddling Club with a space to practice and teach. Finally, I would also like to thank the team at CIRPAS, including Haflidi Jonsson, Roy Woods, Greg Cooper, Marko Jaakkola, Bryce Kujat, and Dennis Hamaker, for their unmatched professionalism and valued assistance in executing aircraft research. It was a pleasure working with them for three campaigns.
For three years, I worked as an Resident Associate in Dabney Hovse. I thank the entire RA group and student affairs office, especially Taso Dimitriadis, Portia Harris, Sue Chiarchiaro, Barbara Green, and Lesley Nye, for assistance during difficult student issues. I would also like to thank select students, including Jesse Salomon, Nick Schiefer, John Pharo, and Jomya Lei, for their incredible hovse leadership and collaboration. Finally, I would like to thank all of Dabney Hovse for providing an enriching experience at Caltech.
In addition to the assistance I’ve gained professionally, there are a number of people whose friendship I’ve valued over the past five years. First and foremost, I extend my biggest thanks to my girlfriend, Anna Chen, for her immense support and encouragement. She has been my greatest source of balance and my best adventure partner. I’m grateful for all she has provided me over the past three years and I thank her for tolerating my endless shenanigans. Thank you, Anna.
Many thanks to Anne Laraia for her outstanding friendship. In no small way, she have been a constant support and I will always look to her as a role model. I’ll miss those early morning hikes up the San Gabriel Mountains, but look forward to hikes elsewhere. I thank Steve Gardner for being one of the most generous people I’ve ever met. I’ve always been impressed with his thoughtfulness, incredible humor, and bomb steak grilling. Steve and Anne make for one hell of a team.
RA madness – those years in Dabney are my most memorable. To Chris and Suzanne, thank you for sharing a year with me in RA retirement. It was the best detox I could ask for.
I thank my classmates, especially Ricardo, Charlie, Carissa, Wendy, and Kat, for all their support during first year classes. I thank my Paddling Club co-founder, Devin Wiley, for the opportunities to paddle in amazing locations. I thank other key Paddling Club members, including Bryan Jadot, Said Bogatyrev, Catie Blunt, Andrew Robbins, David Schuman, and Kelly Mauser, for sharing some great paddling adventures and assisting in club operations. I would like to thank the Kern River Valley for providing respite from LA city life.
Finally, I would like to thank my family and friends at home for their love from abroad. To my great friends, Greg, Adam, Conor, Dubby, Noelle, Caitlin, and Lindsay, thank you for your long-distance calls and visits to California. To my family, thank you for encouraging me to pursue engineering and supporting my decision to head to LA for graduate school. To my mom and dad, thank you for giving me perspective and constant reminders to maintain life balance. To my brother, thank you for serving as a role model of what it takes to overcome hardship and persist despite challenges. Thanks, and I love you.
Abstract
This thesis is the culmination of field and laboratory studies aimed at assessing processes that af- fect the composition and distribution of atmospheric organic aerosol. An emphasis is placed on measurements conducted using compact and high-resolution Aerodyne Aerosol Mass Spectrometers (AMS). The first three chapters summarize results from aircraft campaigns designed to evaluate anthropogenic and biogenic impacts on marine aerosol and clouds off the coast of California. Subse- quent chapters describe laboratory studies intended to evaluate gas and particle-phase mechanisms of organic aerosol oxidation.
The 2013 Nucleation in California Experiment (NiCE) was a campaign designed to study envi- ronments impacted by nucleated and/or freshly formed aerosol particles. Terrestrial biogenic aerosol with>85% organic mass was observed to reside in the free troposphere above marine stratocumu- lus. This biogenic organic aerosol (BOA) originated from the Northwestern United States and was transported to the marine atmosphere during periodic cloud-clearing events. Spectra recorded by a cloud condensation nuclei counter demonstrated that BOA is CCN active. BOA enhancements at latitudes north of San Francisco, CA coincided with enhanced cloud water concentrations of organic species such as acetate and formate.
Airborne measurements conducted during the 2011 Eastern Pacific Emitted Aerosol Cloud Ex- periment (E-PEACE) were aimed at evaluating the contribution of ship emissions to the properties of marine aerosol and clouds off the coast of central California. In one study, analysis of organic aerosol mass spectra during periods of enhanced shipping activity yielded unique tracers indicative of cloud-processed ship emissions (m/z 42 and 99). The variation of their organic fraction (f42and f99) was found to coincide with periods of heavy (f42>0.15;f99>0.04), moderate (0.05<f42<
0.15; 0.01<f99<0.04), and negligible (f42<0.05;f99<0.01) ship influence. Application of these conditions to all measurements conducted during E-PEACE demonstrated that a large fraction of cloud droplet (72%) and dry aerosol mass (12%) sampled in the California coastal study region was heavily or moderately influenced by ship emissions. Another study investigated the chemical and physical evolution of a controlled organic plume emitted from the R/VPoint Sur. Under sunny con- ditions, nucleated particles composed of oxidized organic compounds contributed nearly an order of magnitude more cloud condensation nuclei (CCN) than less oxidized particles formed under cloudy
hr).
Laboratory chamber experiments were also conducted to evaluate particle-phase processes in- fluencing aerosol phase and composition. In one study, ammonium sulfate seed was coated with a layer of secondary organic aerosol (SOA) from toluene oxidation followed by a layer of SOA from α-pinene oxidation. The system exhibited different evaporative properties than ammonium sulfate seed initially coated withα-pinene SOA followed by a layer of toluene SOA. This behavior is consis- tent with a shell-and-core model and suggests limited mixing among different SOA types. Another study investigated the reactive uptake of isoprene epoxy diols (IEPOX) onto non-acidified aerosol.
It was demonstrated that particle acidity has limited influence on organic aerosol formation onto ammonium sulfate seed, and that the chemical system is limited by the availability of nucleophiles such as sulfate.
Flow tube experiments were conducted to examine the role of iron in the reactive uptake and chemical oxidation of glycolaldehyde. Aerosol particles doped with iron and hydrogen peroxide were mixed with gas-phase glycolaldehyde and photochemically aged in a custom-built flow reac- tor. Compared to particles free of iron, iron-doped aerosols significantly enhanced the oxygen to carbon (O/C) ratio of accumulated organic mass. The primary oxidation mechanism is suggested to be a combination of Fenton and photo-Fenton reactions which enhance particle-phase OH radical concentrations.
Contents
Acknowledgements iv
Abstract vii
1 Introduction 1
1.1 References . . . 6
2 Observations of Continental Biogenic Impacts on Marine Aerosol and Clouds off the Coast of California 9 2.1 Introduction . . . 10
2.2 Methodology . . . 11
2.2.1 Flight Descriptions: E-PEACE . . . 11
2.2.2 Flight Descriptions: NiCE 2013 . . . 12
2.2.3 Instrumentation . . . 12
2.2.4 Mass Spectra Deconvolution Using Positive Matrix Factorization . . . 14
2.3 Results and Discussion . . . 14
2.3.1 Organic Aerosol From Continental Sources . . . 14
2.3.2 Biogenic Impact on the Continental Factor . . . 18
2.3.3 The Impact of Continental Aerosol on the Marine Environment . . . 22
2.3.4 The Impact of Biogenic Organic Aerosol on Cloud Water Chemistry . . . 25
2.3.5 The Potential for Biogenic Organic Aerosol to Act as CCN . . . 26
2.4 Conclusions . . . 31
2.5 References . . . 31
3 Ship Impacts on the Marine Atmosphere: Insights into the Contribution of Ship- ping Emissions to the Properties of Marine Aerosol and Clouds 35 3.1 Introduction . . . 36
3.2 Methodology . . . 37
3.2.1 Field mission description . . . 37
3.3.1 Cloud-processed aerosol . . . 41
3.3.2 Cloud water chemistry . . . 42
3.3.3 CCN measurements . . . 44
3.3.4 Relationship between marine aerosol and cloud droplet properties . . . 44
3.3.5 Back-trajectory comparisons . . . 46
3.4 Ship impacts on marine aerosol and clouds . . . 46
3.4.1 Organic aerosol mass spectra . . . 46
3.4.2 Application of m/z 42 and 99 in evaluating ship-impacted airspace . . . 48
3.4.3 High resolution AMS analysis of ions at m/z 42 and 99 . . . 49
3.5 Conclusions . . . 50
3.6 Appendix . . . 51
3.6.1 Physical properties of aerosol and cloud droplets . . . 51
3.6.2 Composition measurements by aerosol mass spectrometry . . . 52
3.6.3 Cloud water chemistry . . . 52
3.7 References . . . 53
4 Hygroscopic Properties of Smoke-generated Organic Aerosol Particles Emitted in the Marine Atmosphere 56 4.1 Introduction . . . 57
4.2 Methods . . . 58
4.2.1 The E-PEACE field campaign . . . 58
4.2.2 Instruments . . . 59
4.2.3 Data processing and quality control . . . 60
4.2.4 Auxiliary data . . . 61
4.2.5 Synoptic conditions . . . 61
4.2.6 Plume tracking . . . 61
4.3 Results . . . 62
4.3.1 Background aerosol . . . 62
4.3.2 Secondary organic aerosol formation in the plume . . . 63
4.3.3 Chemical composition . . . 64
4.3.4 CCN concentrations . . . 66
4.3.5 Hygroscopic growth factors . . . 67
4.4 Conclusions . . . 69
4.5 References . . . 70
5.2 Experimental Section . . . 76
5.3 Results and Discussion . . . 77
5.3.1 Aerosol Size Distribution Evolution . . . 77
5.3.2 Aerosol Chemical Composition . . . 79
5.4 References . . . 81
6 Organic Aerosol Formation from the Reactive Uptake of Isoprene Epoxydiols (IEPOX) onto Non-acidified Inorganic Seeds. 83 6.1 Introduction . . . 84
6.2 Materials and methods . . . 85
6.2.1 Experimental procedures . . . 85
6.2.2 Analytical methods . . . 86
6.2.2.1 Chemical ionization mass spectrometry (CIMS) . . . 86
6.2.2.2 Aerosol mass spectrometry (AMS) . . . 87
6.2.2.3 Particle size and number concentration . . . 87
6.2.2.4 Filter collection and analysis . . . 87
6.3 Results and Discussion . . . 88
6.3.1 Reactive uptake ofcis andtrans β-IEPOX onto ammonium sulfate seeds . . 88
6.3.1.1 Liquid water content of seeds . . . 88
6.3.1.2 Particle acidity . . . 89
6.3.2 Molecular picture of OA formation from IEPOX . . . 91
6.3.2.1 Cation and anion substitutions . . . 91
6.3.2.2 Henry’s Law constant . . . 92
6.3.2.3 Organic composition . . . 92
6.4 Summary and atmospheric implications . . . 93
6.5 References . . . 95
7 Reactive Uptake and Photo-Fenton Oxidation of Glycolaldehyde in Aerosol Liq- uid Water 98 7.1 Introduction . . . 99
7.2 Experimental Section . . . 100
7.3 Results and Discussion . . . 100
7.3.1 Composition Analysis . . . 100
7.3.2 Glycolaldehyde Reactive Uptake . . . 101
7.3.3 Oxidation in Aerosol Liquid Water . . . 102
8 Conclusions and Future Work 109
8.1 Field Studies . . . 109
8.2 Iron Chemistry . . . 110
8.3 Flow Tube . . . 113
8.4 References . . . 116
Appendix 119
List of Figures
Chapter 1 1
1.1 Overview of select processes leading to the formation and consumption of secondary organic aerosol (SOA). . . 5
Chapter 2 9
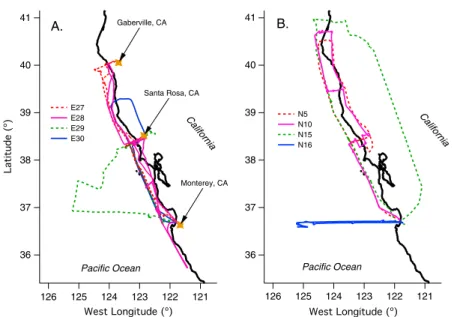
2.1 (a) Flight paths for E27, E28, E29, and E30. Gold makers indicate the locations where the Twin Otter diverted its coastal trajectory to measure aerosol over land. (b) Flight paths for N5, N10, N15, and N16. . . 12 2.2 Summary of aerosol properties for (a) flight E28 from E-PEACE and (b) flight N10
from NiCE. Aerosol above the marine temperature inversion is highly organic (>85%) whereas aerosol below the marine temperature inversion is a diverse mix of organic and inorganic species. Aside from organics, sulfate is the other dominant species measured by AMS. The Org/SO4 ratio is used as a proxy to distinguish between aerosol above and below the marine temperature inversion. . . 15 2.3 Triangle plot [Ng et al., 2010] showing the relative contributions of organic mass at
m/z 44 (f44) and 43 (f43) measured during (a) E-PEACE and (b) NiCE. Markers are colored and sized by the Org/SO4ratio. Red markers indicate Org/SO4≥10; however, measurements as high as Org/SO4 = 50 were observed above the marine temperature inversion. . . 16 2.4 (top) Factors 1 and 2 spectra and time series profiles compared to (bottom) external
traces of sulfate, NaCl, and black carbon. The NaCl trace is defined similarly to that from Allan et al. [2004b] and is the sum of mass at m/z 23 (Na+), 35 (Cl+), 36 (HCl+), and 58 (NaCl+). Note that factor profiles and external tracers presented here are uncorrected for collection efficiency. . . 16 2.5 (top row) Map showing the spatial distribution of Factor 1 during E-PEACE flights.
(bottom row) Temperature profile observed during each flight. Markers are colored and sized by the mass contribution of Factor 1. . . 17
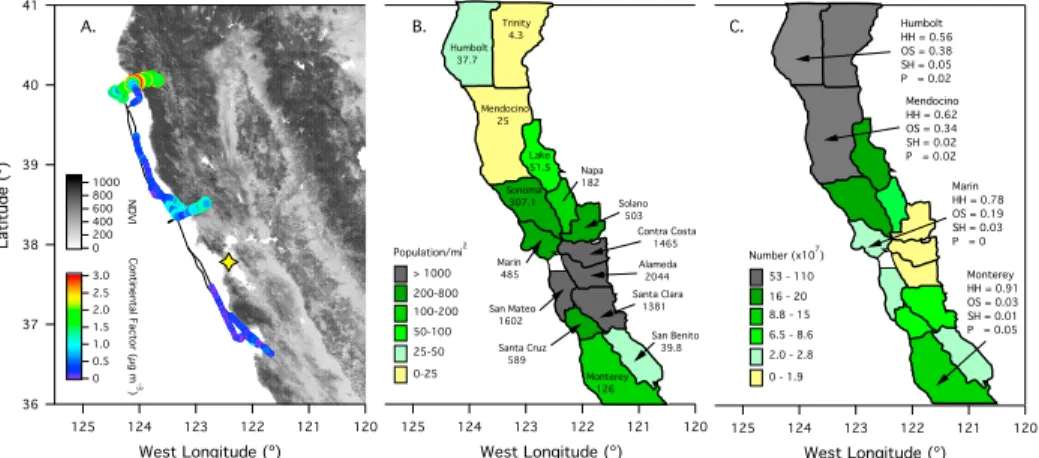
PMF description in supporting information). Markers are colored by the continental factor mass. The flight path overlays a satellite image of California. The map is colored by the normalized difference vegetation index (NDVI), which is a relative measure of the amount of vegetation in an area. Darker colors indicate higher vegetation. NDVI data can be found at http://modis-atmos.gsfc.nasa.gov/NDVI/index.html. The yellow star indicates the location of San Francisco, CA. (b) Map showing the human population density of a given California county. Numbers in each county represent the number of people per square mile as measured during the 2010 census and can be found at http://census.gov. (c) Map showing the total number of trees in a given California county. The composition (HH = hardwood, OS = other softwood, SH = soft hardwood, and P = pine) of the forests for four counties is shown. A breakdown of each category is provided in Table 3. . . 20 2.7 (a) Comparison of average SV-OOA [Ng et al., 2011], anthropogenic SV-OOA measured
in the Los Angeles Basin, CA [Hersey et al., 2011], biogenic organic aerosol measured in Sacramento, CA [Setyan et al., 2012], and biogenic organic aerosol measured in a Japanese boreal forest [Han et al., 2014] to the continental factor resolved in this study.
(b) Comparison of f44/f43 for the continental factor resolved in this study to SV-OOA factors resolved previously [Ng et al., 2011; Hersey et al., 2011; Setyan et al., 2012;
Han et al., 2014]. Note that f43and f44 are calculated with the signal of 39 removed. . 20 2.8 (left column) Satellite image taken at 18:30 UTC showing a dry air plume originating
from the northwest United States. (right column) Expanded view of flight path and altitude profile for flight N5 overlaying the same satellite image (data downloaded at http://www.nrlmry.navy.mil/sat products.html). The dotted line indicates the top of the marine boundary layer, and the yellow star indicates the location of San Francisco, CA. Markers are colored by the Org/SO4 ratio. Data are separated into two regions:
those that were measured within and those that were measured outside of the dry air plume. In general, aerosols with high Org/SO4 are dominant inside the plume.
Likewise, measurements are constrained to altitudes above the marine inversion (500 m), which is consistent with Figures 5 and 9. . . 23
products.html). Markers are colored by the Org/SO4ratio. Data are separated into two regions: those that were measured south (low latitude) and those that were measured north (high latitude) of Santa Rosa, CA. In general, aerosols with high Org/SO4 are dominant north of Santa Rosa, CA; however particles in both regions exhibit higher Org/SO4 than those of typical marine aerosol (Org/SO4∼1). Likewise, particles are constrained to altitudes above the marine inversion (500 m), similar to the results shown in Figure 5. . . 23 2.10 Summary of meteorological conditions from N10. Vertical profiles of (a) water mixing
ratio, (b) particle number, (c) temperature, and (d) horizontal wind speed. Figure 10d summarizes the locations of each profile corresponding to the spirals (S) performed outside (blue) and inside (red) the plume. Figures 10c and 10d show individual spirals whereas Figures 10a and 10b show bulk vertical profiles segregated based on dry plume influence. . . 24 2.11 Flight path and altitude profile for flight N16 overlaying a satellite image showing cloud
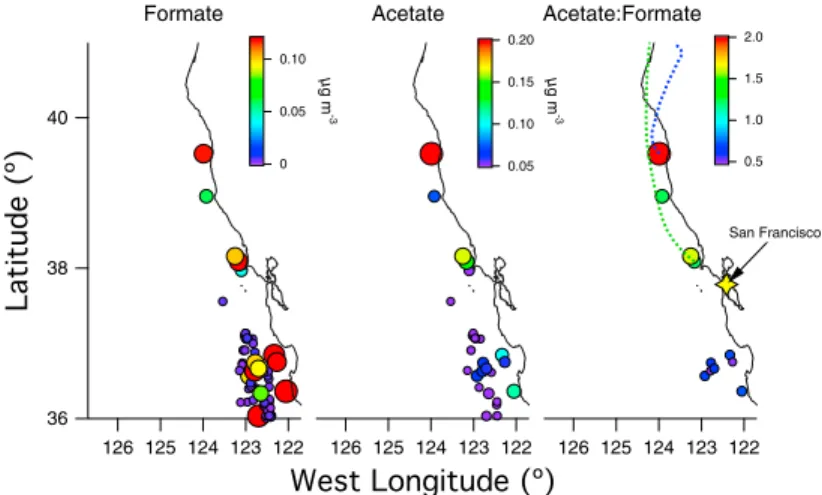
coverage at 21:00 UTC (data downloaded at http://www.nrlmry.navy.mil/sat prod- ucts.html). Measurements of biomass burning organic aerosol (BBOA) from Oregon fires were measured over marine stratocumulus. Markers are colored by the mass of organic at m/z 60, which is a typical tracer for BBOA. Markers are sized by the total organic loading, with the largest markers representing loadings of 150 μg m–3. The red trace is a back trajectory ending at the location where the highest concentration of BBOA was measured. The back trajectory shows that measurements originated from a region impacted by Oregon fires (red stars). The yellow star indicates the location of San Francisco, CA. . . 25 2.12 Spatial maps of cloud water species measured during the E-PEACE campaign. Markers
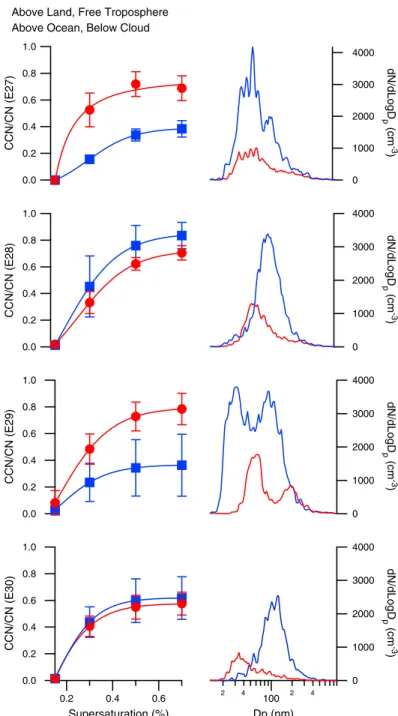
are colored and sized by the air equivalent concentration, which is a concentration mea- sure normalized by the cloud liquid water content. Dotted lines over the acetate:formate map are back trajectories for air masses above cloud during flight E28. . . 26 2.13 CCN spectra and SMPS distributions for aerosol measured over land (40◦ latitude)
in the free troposphere (blue squares) and those measured over the ocean at 30 m (red circles). Error bars are the standard deviation in the measurement. The 100 nm mode observed in the free troposphere is consistent with that of biogenic aerosol. The appearance of a nucleation mode (∼30 nm) likely results from fresh emissions. In the absence of chemical composition below 60 nm, we propose that this smaller mode is biogenic organic aerosol that has yet to grow to 100 nm. . . 27
distribution peak are shown. . . 28 2.15 Time lapse showing the evolution of marine stratocumulus during flight N15 (26 July
2013). The time (UTC) above each panel indicates when the satellite image was recorded. The red trace is the Twin Otter flight path, and the labels S1, S2, and S3 indicate the location of a vertical spiral designed to sample a localized profile of marine aerosol. The area void of clouds (referred to as a plume of dry air) originated from the continent and moved south as time elapsed. Point T was a period where the Twin Otter briefly sampled aerosol above cloud top within the plume. The dotted yellow lines are 24 h back trajectories ending at the location of each spiral. . . 29 2.16 Summary of data from N15 corresponding to the flight path shown in Figure 15. (row
a) Size distributions from each spiral (S1, S2, and S3). (row b)) Altitude and liquid water content (LWC). (row c) PCASP and ultrafine CPC (UFCPC) measurements.
(row d) AMS measurements summarizing aerosol composition. Regions colored red, orange, and green correspond to S1, S2, and S3, respectively. PCASP concentrations apply to aerosol with diameters≥100 nm, whereas UFCPC concentrations apply to aerosol with diameters≥2 nm; thus, enhancements in UFCPC relative to PCASP are indications of enhanced concentrations of sub-100 nm small particles. . . 30
Chapter 3 35
3.1 Twin Otter flight paths for RF 1-26 during the E-PEACE mission. Inset shows a typical sampling pattern when encountering a ship exhaust plume. The color bar indicates the total aerosol number concentration as measured by the Twin Otter CPC. . . 39 3.2 Bulk AMS species measured in cloud drop residuals (top panel) and dry, below-cloud
aerosol (bottom panel) over the course of the study. Only organic and sulfate vary significantly each day (variance of organic =0.04, sulfate =0.6 in below-cloud aerosol).
Ammonium and nitrate exhibit variances that are at most 0.5%of the variance of sulfate. 41 3.3 Marine aerosol number size distributions of below-cloud aerosol measured during clean
and perturbed flights (top and middle panels). Aerosol size distributions for the exhaust of three ships (bottom panel). Lines are log-normal fits. . . 42
however, we note that variation increased with altitude. Average LWC is presented to illustrate the study-averaged, below-cloud top liquid water profile and show that cloud processing was prevalent at all altitudes. The campaign-average cloud base is shown with bars depicting the range of cloud bases and tops observed during the campaign.
Cloud base altitudes were measured during aircraft soundings. . . 42 3.5 Summary of major seawater species measured in marine cloud water. Data are pre-
sented analogously to those reported by Straub et al. [2007] and Benedict et al. [2012].
In the present study, we assume that seawater species measured by ICP-MS (e.g., Na, K, Mg, Ca) reflect aqueous phase ions. The solid lines indicate the ion ratio typically observed in seawater. Each point represents a single cloud water measurement. Clean flights (RF 5-8) are colored in blue while perturbed flights (RF 14-18) are colored in red. The remainder of the flights are shown as brown circles. . . 43 3.6 CCN spectra showing the activation of particles at various supersaturations. The top
panel is CCN data from a perturbed flight (red markers, RF 15) and clean flight (blue markers, RF 20) fitted to a sigmoidal curve of the form CCN/CN=a0/(1+(x/a1)-a2 ) where a0, a1, and a2 are fitted parameters. The error bars represent the measurement standard deviation. The bottom panel shows all CCN measurements made over the course of the campaign at 0.15, 0.3, 0.5, and 0.7%supersaturation. . . 44 3.7 Trends in below cloud sulfate vs. air equivalent H+, cloud droplet number concentration
(Nd), air equivalent V and air equivalent Fe. Iron and vanadium were measured in cloud water samples using ICP-MS. Hydronium concentrations were calculated based on cloud water sample pH. Air equivalent units are calculated as the product of the concentration of a species in a bulk cloud water sample and the average liquid water content measured during the cloud water collection period. Each point represents a single flight. Clean flights (RF 5-8) are colored blue while perturbed flights (RF 14-18) are colored red. Error bars show the standard deviation of each measurement. The remainder of the flights are shown as brown circles. . . 45 3.8 (Top) - variation in air equivalent vanadium with respect to air equivalent hydronium
concentrations for cloud water samples. Hydronium concentrations were calculated based on cloud water sample pH. (Bottom) - trend in manganese and iron concentra- tions in cloud water for measurements made during clean (blue) and perturbed (red) days, respectively. . . 46
model (available at: http://www.arl.noaa.gov/ready/hysplit4.html). Simulations were initialized with trajectories ending at the time, location, and altitude of cloud water sampling. Inset shows a closer perspective of the California coast. The green traces are the ship tracks of 15 cargo and tanker ships probed during the campaign and illustrate the general location of the shipping lanes north of Long Beach, CA. . . 46 3.10 Aerosol mass spectra comparing the organic signature of aerosol below and within
cloud for a clean flight (RF 9) and perturbed flight (RF 15). To the right of the dotted line is a comparison of a ship track in cloud observed during RF 9 to the unperturbed, in-cloud background organics. The bottom row illustrates normalized difference spectra, which are the differences in the normalized (m/z mass/total mass) mass spectra of measurements presented in the top and middle rows. Positive values indicate a relative enhancement in masses observed in the top row spectra, whereas negative values indicate a relative enhancement in masses observed in the middle row spectra. . . 47 3.11 Time series of organic, sulfate, organic m/z 99, LWC and altitude for research flights
RF 9 (moderately clean, clouds), RF 16 (perturbed, clouds), and two additional flights that were performed outside the sampling region defined in Fig. 1, RF 27 (moderately clean, no clouds) and RF 28 (moderately clean, clouds). The top row of normalized aerosol number distributions (dN/dlogDp/(integrated loading)) show the distribution of marine aerosol below cloud for each flight. The dotted boxes show periods when samples were collected through the CVI inlet. . . 48 3.12 Path of additional flights RF 27 (red) and RF 28 (blue) compared to the path of all
other flights in the present study (grey). Dotted lines are back-trajectories (24 h) for air masses measured during the middle of each flight. RF 27 and RF 28 were coastal gradient flights conducted on clear (RF 27) and cloudy (RF 28) days. . . 48 3.13 Variation of the organic fraction of m/z 42 and m/z 99 (f42, f99) in the organic spectra
of cloud water droplet residuals and dry aerosol. Markers are colored by sulfate loading to illustrate the potential impact of ships on each measurement. . . 49
Chapter 4 56
4.1 Smoke generation on the R/V Point Sur (photo taken from CIRPAS Twin Otter).
Insert: General area of the E-PEACE field campaign off the coast of California. The ship’s course is shown for the days that are the focus of this study. . . 59
optic conditions are apparent: back trajectories pertaining to Regime 1 (blue, green), Transition (orange), and Regime 2 (red). . . 61 4.3 Submicrometer volume distributions (SEMS), total number concentrations < 6000
cm–3 (CPC), black carbon concentrations < 5 ng m–3 (SP2), chemical composition (AMS and PILS), and hygroscopic growth factors (HTDMA) for a dry particle size of 150 nm (indicated in the volume distribution (top panel) by the red line) and four different RHs as a function of time over the entire research cruise. Green shading:
plume; yellow shading: ship stack exhaust; no shading: Regime 1; dark-gray shading:
Transition; light-gray shading: Regime 2. Mass concentrations for AMS and PILS in green or yellow shading (plumes) pertain to the right y axis. Refer to Sect. 3.1 for more details. . . 63 4.4 R/VPoint Sur ship trace during plume sampling on 17 July (a) and 18 July (b). The
plume location is identified by values of organic : sulfate>5 (green markers). Black borders indicate high particle number concentrations. A1, A2, and A3 designate the three plume ages described in Sect. 2.6. . . 64 4.5 Number (a, b) and volume (c, d) size distributions (SEMS and APS/OPS) of the plume
particles on 17 July (a, c) and 18 July (b, d). A particle formation and growth event is observed on 17 July, which contributes substantial aerosol mass to the plume. Only large plume particles were detected on 18 July. . . 65 4.6 Plume chemical composition measured by AMS for the three plume ages (A1, A2, A3)
and marine background aerosol on 17 July (a) and 18 July (b). Light-gray shading designates plume ages A2 and A3, and dark-gray shading represents the fresh plume (A1). The ratios O:C and WSOM:Org increase with plume age both days, and an absolute increase of WSOM is observed on 17 July. . . 65 4.7 FTIR spectra of the plume for a filter sample over ages A1 and A2 (“A1+A2”), and
a sample for age A3 (upper panel) and their difference (middle panel). Spectra of the pure ship stack emissions (sampled on 22 July) as well as the smoke oil and the ship diesel fuel are shown for comparison (lower panel). Hydroxyl functional groups are detected in the aged smoke plume, but much less so in the fresh smoke and the laboratory samples. . . 66 4.8 Size-resolved concentrations of AMS organic, and the organic markers m/z 57 and m/z
43 for 17 July (a) and 18 July (b). The small particle mode is clearly visible on 17 July. The marker m/z 57 only appears in the large particle mode, the marker m/z 43 in both modes. . . 66
and 18 July (b). The large-mode volume concentration decreases with plume age on both days. On 17 July, the volume concentration in the small mode increases as the plume ages, while on 18 July, no such dramatic increase is observed. C2H3O+covaries with the small particle mode on 17 July, while C3H+7 covaries with the large particle volume on both days. . . 67 4.10 Hygroscopic growth factors for 30 and 150 nm dry size at 92%RH, and time series
of CCN concentrations and activation ratios at three supersaturations: 0.07 < S <
0.08% (red, low), 0.24 <S < 0.26% (green, medium), and 0.87 <S <0.88% (yellow, high) for the plume sampling events on 17 July (a) and 18 July (b). Dark-gray shading represents plume age A1, and light-gray shading plume ages A2 and A3. Refer to Sect.
3.4 for more details. . . 68
Chapter 5 74
5.1 Evolution of the suspended particle size distribution of single-precursor SOA during heating of the chamber enclosure. The data shown are averaged over 1-h intervals.
Abbreviations correspond to toluene (tol.) andα-pinene (α-pin.). The final aerosol size distribution for Experiment 2 is not reported due to inadvertent chamber irradiation (see Table 1). The inset in panel b shows the change in particle size distribution for pure wall loss observed in Experiment 7 (Table 1). The initial size distribution after dilution is in gray, and the final size distribution after 9 h is in black. . . 77 5.2 Experiment profile for SOA formation and evaporation whenα-pinene and toluene were
injected sequentially (Experiment 4). The suspended particle volume concentration, α-pinene (α-pin.), toluene (tol.), and cyclohexane (cyc.) concentrations (when above the limit of detection), and the chamber temperature are shown. Periods of irradia- tion, dilution, and heating are highlighted, and the toluene injection is denoted by the vertical, black line. . . 78 5.3 Evolution of the suspended particle size distribution of SOA from sequentially or si-
multaneously injected precursors during heating of the chamber enclosure. The data shown are averaged over 1-h intervals. Abbreviations correspond to toluene (tol.) and α-pinene (α-pin.). . . 79
from those for H:C and O:C, 10% and 31%, respectively, at the end of the formation period. The rate of change of OSCas a function of temperature for each experiment is listed in panel b. Abbreviations correspond to toluene (tol.) andα-pinene (α-pin.). . . 80
Chapter 6 83
6.1 Typical uptake experiment results as a function of time, shown for trans isomer, at dry (top) and humid (bottom) conditions with the corresponding percent of liquid water content (LWC). The solid black line indicates when IEPOX injection stopped and the mixture was allowed to equilibrate. Double y axes correspond to traces of the same color. 88 6.2 Reactive partitioning coefficients (φOA/IEPOX) during the gas-phase IEPOX injection
phase for the trans and cis isomers as a function of the particle liquid water concentra- tion. Error bars indicate experimental uncertainty as described in the text. . . 89 6.3 φOA/IEPOX for the trans-IEPOX isomer as a function of the modeled particle pH. . 90 6.4 Ratio of organic aerosol produced to gas-phase trans-IEPOX injected for seeds of var-
ious compositions (RH 60-85 %). . . 91 6.5 ToF-AMS normalized difference spectra (composition at peak OA growth minus com-
position during seed injection), showing the organic composition of the OA produced by reactive uptake of the trans and cis isomers. Select nominal mass ions previously suggested to be IEPOX-derived OA tracers are labeled. . . 92 6.6 ToF-AMS difference spectra (open minus closed chopper) showing organic nitrogen
(amine) fragments from the reactive uptake of trans-IEPOX onto AS vs. Na2SO4 seeds. Similar fragments were observed for cis-IEPOX using NH+4 -based seeds and not observed in Na+-based seeds. . . 93
Chapter 7 98
7.1 Electron impact mass spectra of (a) glycolaldehyde from the NIST mass spectral database, and the AMS difference mass spectra between (b) exp i and particle blank, (c) exp ii and exp i, (d) exp iii and exp ii, (e) exp iv and particle blank, (f) exp v and exp iv, and (g) exp vi and exp v, as listed in Table 1. “Org” = gas-phase injection of glycolaldehyde. Note: the CHO+and CH4O+peaks were omitted in this work due to strong air interferences (Figure S6). . . 101 7.2 Time profile of the uptake of glycolaldehyde onto dry and hydrated seed particles,
monitored by AMS (a) tracer mass fragment CH3O+(m/z 31, not calibrated to wt %) and (b) total organic mass. . . 101
AS + org + H2O2+ hν; (iv) AS + Fe(II) + org; (v) AS + Fe(II) + org + H2O2; and (vi) AS + Fe(II) + org + H2O2+ hν, where “org” = gas-phase injection of glycolaldehyde.
Experimental data correspond to time scales greater than 30 min. . . 101 7.4 High-resolution AMS (a) fCO+
2
vs fC
2H3O+ plot of particulate organics from glycolalde- hyde uptake and oxidation at RH = 80%, superimposed on the ambient triangle space from Ng et al. and (b) Van Krevelen diagram with slopes corresponding to formation of carboxylic acids and ketones/aldehydes. Photo-induced oxidation was significantly enhanced in the presence of Fe(II). No trends were observed in dry experiments, shown in Figure S8. . . 102 7.5 Proposed scheme of reactions occurring in the glycolaldehyde uptake and aqueous pho-
tooxidation onto hydrated AS seeds. . . 103
Chapter 8 109
8.1 Proposed iron-carboxylate chemistry based on a review of known reactions. The mech- anism for glycolaldehyde oxidation by OH is described by Perri et al. (2009); the mechanism for H2O2 production is described by Zuo and Hoigne (1992). . . 115 8.2 Schematic of the Caltech Photooxidation Tube . . . 116
List of Tables
Chapter 2 9
2.1 Summary of E-PEACE 2011 and NiCE 2013 flight objectives . . . 13 2.2 Results of emission factor analysis using yields and BC, gasoline, and diesel emission
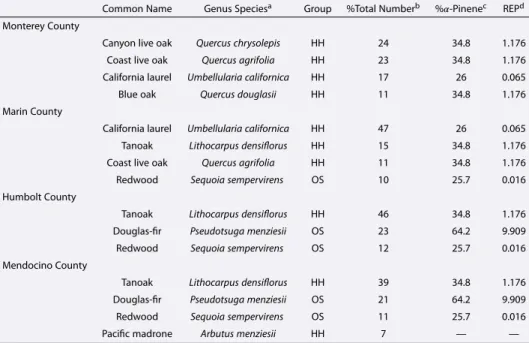
factors from Gentner et al. [2012] . . . 19 2.3 Major species (>5%of total number) in the tree subgroups (HH = Hard Hardwood,
OS = Other Softwood) shown in Figure 6 . . . 21
Chapter 3 35
3.1 Previous studies on the properties of marine aerosol over the Northeastern Pacific Ocean. Footnotes define instrument abbreviations. . . 38 3.2 Instruments onboard the Twin Otter aircraft and R/VPoint Sur. . . 39 3.3 Summary of average aerosol and cloud properties over the course of the E-PEACE
campaign. Bottom table summarizes key aerosol properties from previous studies of marine aerosol and cloud droplets off the coast of Central California. Values in brackets represent standard deviations of the average. Values in parenthesis list the range of measurements. Values below detection limit (DL) are noted. . . 40 3.4 Fraction of each ion at m/z 42 and m/z 99 over the entire R/VPoint Sur cruise (top)
and during periods of high sulfate loading (bottom). Values in parenthesis are the variance in the measurement. . . 50
Chapter 4 56
4.1 Instruments on the R/VPoint Sur. . . 60 4.2 Hygroscopic growth factors (150 nm dry diameter) averaged over the two meteorological
regimes. For the bold values, the difference of the means between Regime 1 and Regime 2 is statistically significant (95%confidence level). “σ” denotes standard deviations. . 63
correlation is statistically significant at the 99%level. C3H+7 correlates with the large mode on both days; C2H3O+ correlates with the small mode on 17 July. . . 68
Chapter 5 74
5.1 Experimental Details . . . 77
Chapter 6 83
6.1 Summary of results from representative reactive uptake experiments onto ammonium sulfate seeds. Mean results from Lin et al. (2012) are shown for comparison. . . 89
Chapter 7 98
7.1 Average weight percent and elemental ratios for aerosol organics, from the uptake of 80 (±10) ppb gas-phase glycolaldehyde (“org”) onto 5-25μg m–3of hydrated inorganic seeds . . . 102
Chapter 1
Introduction
Aerosols are ubiquitous in Earth’s atmosphere and significantly impact global climate and human health. In the context of climate science, aerosols strongly influence the global energy balance via the absorption/ reflection of solar radiation and modulation of cloud properties. These solar in- teractions, known as the direct and indirect effects, are the most uncertain of all anthropogenic forcings contributing to global climate change (IPCC 2014). In terms of human health, high concen- trations of atmospheric particles, particularly in urban settings, are linked to pulmonary, cardiac, and other degenerative diseases (P¨oloch 2005). Such issues extend far beyond the source; pollution from industrialized nations is known to impact countries downwind (e.g., Kwon et al. 2002, Lin et al. 2014). For example, one modeling study estimated that, at most, 12-24% of sulfate pollution over the Western United States can be attributed to emissions originating from Chinese production of exportable goods (Lin et al. 2014). Consequently, investigations into the formation, distribution, and fate of atmospheric aerosols are critical to assess anthropogenic impacts on regional and global scales.
Of the constituents that compose atmospheric aerosols, organic compounds, such as function- alized hydrocarbons, are the most diverse and typically contribute up to 50% of total particulate mass (Jimenez et al. 2009). Organic aerosol may be emitted directly from a source (referred to as
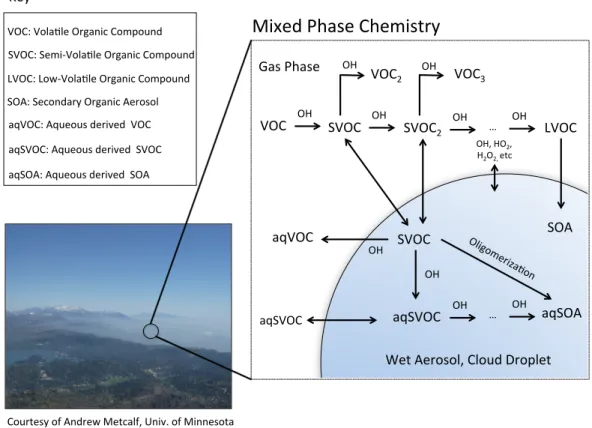
“primary” emissions) or result from the atmospheric processing of a parent compound (referred to as a “secondary” source). The latter, also known as secondary organic aerosol (SOA), is particularly challenging to understand because of the number of processes and components contributing to its formation. Figure 1.1 demonstrates this complexity with respect to organic reactions with the OH radical. In general, a volatile organic compound (VOC) undergoes reaction to form an oxidized species. This species may also be volatile, or, because of functionalization, have the propensity to partition to the condensed phase. These semi-volatile compounds (SVOC) may contribute to secondary organic aerosol, or continue to undergo gas-phase reactions with additional oxidation species. As gas-phase reactions proceed, the original carbon backbone of the parent VOC may fragment, thus forming higher volatility products. Alternatively, continued functionalization may
In concert with this complex gas-phase chemistry, SOA is also formed from reactions occurring within the liquid fraction of the particle (Ervens et al. 2011). This aqueous-derived SOA (aqSOA) may undergo an additional suite of oxidation reactions to form new products, some of which partition out of the particle completely (aqueous-derived VOCs, aqVOC) and some that partition between the gas and particle phases (aqueous-derived SVOC, aqSVOC). Unlike gas-phase chemistry, which is primarily a means of SOA formation, particle-phase chemistry may act as both a source and sink of SOA depending on the oxidation pathway (Ervens et al. 2011, Sorooshian et al. 2013).
The chemical processes described above tend to generate oxidized organic species, which af- fects key physical properties such as particle hygroscopicity. For example, Lambe et al. (2011a) demonstrated that the organic hygroscopic parameter of laboratory-generated aerosol, κorg, could be linearly parameterized to the elemental O/C ratio. Likewise, Wonasch¨utz et al. (2013) demon- strated that emissions of hydrophobic organics undergoing atmospheric processing in the marine atmosphere could generate cloud condensation nuclei (CCN) active particles. The number of CCN grew as the degree of organic oxidation increased. These studies demonstrate that the presence of organic aerosol affects a particle’s chemio-physical state. Understanding the nature of these pro- cesses is especially important in order to gain better predictions of aerosol modifications to cloud microphysics (i.e., the indirect effect).
The following chapters outline a number of studies aimed at investigating the composition, dis- tribution, and transformation of organic aerosol in field and laboratory settings. Central to these studies is the characterization of aerosol composition using the Aerodyne aerosol mass spectrom- eter (AMS). The AMS measures bulk aerosol mass spectra with fast time resolution. From these measurements, one can map out a particle’s organic fingerprint and deduce properties about the particle. For example, the high-resolution AMS described by DeCarlo et al. (2006) employs technol- ogy capable of resolving the chemical formula of organic fragments, thus allowing one to calculate bulk elemental composition such as O/C, H/C, and N/C ratios.
Chapters 2-4 summarize results from the 2011 Eastern Pacific Emitted Aerosol Cloud Exper- iment (E-PEACE) and 2013 Nucleation in California Experiment (NiCE) field campaigns. These campaigns were based out of the Center for Interdisciplinary Remotely-Piloted Aircraft Studies (CIRPAS) in Marina, CA. E-PEACE was a multi-institutional effort to investigate aerosol-cloud in- teractions in the marine atmosphere while NiCE was designed to understand new particle formation in marine, urban, and agricultural regions. We refer readers to Russell et al. (2013) for details about the E-PEACE and NiCE platforms.
The studies described in Chapter 2-4 focus on measurements conducted in the marine atmosphere off the coast of California. This region is a compelling setting to study aerosol and clouds due to the
budget (and consequently, bulk aerosol properties) is controlled by a soup of natural and anthro- pogenic emissions; however, the extent to which each of these sources impact the marine atmosphere remains uncertain. In Chapter 2, we present measurements conducted during E-PEACE and NiCE to demonstrate the mechanism by which continental biogenic emissions are transported into the free troposphere above marine stratocumulus. Periodically during the summer months, the North Pacific High ridges against the continental U.S. and induces offshore flow (Kloesel 1992, Crosbie et al. 2015). Consequently, emissions originating from heavily forested regions of the Northwestern U.S. are transported to the free troposphere immediately above the marine stratocumulus deck.
In regions with the highest impact from continental sources, cloud water samples exhibit elevated concentrations of organic acids commonly found in biogenic emissions. These observations suggest that biogenic aerosol originating from the Northwestern U.S. has a noticeable influence on marine aerosol and cloud properties during periods of offshore flow.
Studies described in Chapters 3 and 4 focus exclusively on measurements conducted during E- PEACE. Unique to E-PEACE was the use of the R/V Point Sur to purposely emit aerosol into the marine stratocumulus deck. The CIRPAS Twin Otter aircraft probed these emissions, as well as those emitted from passing cargo ships, to characterize the impact of these sources on cloud microphysics. Utilizing AMS measurements, it is demonstrated that particles emitted into the marine atmosphere undergo extensive chemical evolution that affects both compositional markers and aerosol physical properties. In Chapter 3, we show that ship emissions that are subjected to aqueous processing yield a mass spectral fingerprint that is significantly different from the spectra of freshly emitted particles. This fingerprint was present in over 70% of cloud droplets and 12% of dry, background aerosol, whereas the fingerprint for freshly emitted emissions was primarily constrained to the immediate vicinity of the ship (consistent with measurements performed by Murphy et al.
2009). These results suggest that 1) ships have a strong influence on aerosol properties in the California shipping lanes and 2) fresh ship emissions quickly undergo atmospheric processing. In Chapter 4, we discuss measurements of organic aerosol plumes emitted from the R/V Point Sur.
Under sunny conditions, new particles formed within an hour of atmospheric processing and led to a drastic increase in the number of CCN. Under cloudy conditions, no new particles were formed and CCN concentrations were lower by an order of magnitude. These two chapters demonstrate that atmospheric processing plays a major role in dictating aerosol properties in the marine atmosphere.
The remaining chapters describe laboratory studies aimed at understanding the properties and chemical transformation of organic aerosol under controlled, but atmospherically-relevant condi- tions. We conduct this research using two experimental platforms: the environmental chamber and the flow tube reactor. The environmental chamber is primarily used to study the time-dependent
mospheric processing (e.g., Zhang et al. 2014). The flow tube reactor is operated at steady-state, and therefore product distributions measured in the effluent of the reactor reflect those of a single oxidant exposure time. Oxidant exposure times may be varied via changes in the residence time or oxidant concentration; as a result, flow reactors can simulate atmospheric processing on multi-day to week-long timescales (e.g., Kang et al. 2007, Lambe et al. 2011b, 2015, Li et al. 2015). Flow reactors are also more easily maintained due to a smaller surface area than typical environmental chambers; therefore, one can utilize a flow reactor to study chemical systems that would contaminate a teflon chamber.
Chapters 5 and 6 summarize SOA studies conducted using the environmental chamber. In Chap- ter 5, we study the evaporative properties of SOA formed byα-pinene and toluene photooxidation.
In each experiment, SOA was generated via reaction with the OH radical. In mixed SOA experi- ments, SOA formed from one precursor was coated with a layer of SOA from the other precursor.
After several hours of photochemical processing, SOA was heated under dark conditions to 42◦ C and changes in the particle size distribution and elemental composition were monitored. It was found that SOA produced by α-pinene oxidation was more volatile than that produced by toluene chemistry. In mixed SOA systems, the evaporative properties most resembled that of the second coating, suggesting that particles were structured with a core-and-shell morphology. These results suggest that multi-phase systems may influence key heterogeneous processes such as gas uptake and diffusion within the particle.
Chapter 6 is concerned with the formation of SOA resulting from the reactive uptake of isoprene epoxydiols (IEPOX). IEPOX is a product of isoprene photooxidation and is believed to significantly contribute to organic aerosol mass via heterogeneous chemistry (e.g. Froyd et al. 2010, McNeil et al.
2012). In this study, IEPOX was mixed with inorganic aerosol of different compositions under dry and humid conditions. IEPOX uptake was greatest in ammonium sulfate seed at high RH (60-85%), moderate for NH4Cl, and substantially reduced for other seed compositions (NaCl and Na2SO4).
Furthermore, IEPOX uptake into ammonium sulfate was independent of pH, indicating that the influence of pH may be weak due to the ability of NH+4 to act as a ring-opening catalyst. The enhancement in ammonium sulfate relative to NH4Cl indicates that organic aerosol mass is likely limited by the availability of nucleophiles capable of generating low-volatility compounds (such as the reaction with SO–24 to form organosulfates). These results present a possible explanation for the weak correlation between pH and IEPOX-derived organic aerosol observed in field studies.
The final chapter describes a flow reactor study aimed at investigating the heterogeneous chem- istry associated with particle-phase iron. Iron undergoes reactions involving H2O2, known col- lectively as the Fenton and photo-Fenton reactions, that are capable of substantially raising OH
nium sulfate particles doped with iron + H2O2and compare the resulting SOA properties with those of experiments conducted with pure ammonium sulfate + H2O2. Glycolaldehyde is a water-soluble organic shown previously to form SOA in OH-driven aqueous systems (Perri et al. 2009, 2010); thus, we utilize AMS measurements to investigate aerosol composition as a result of OH oxidation. It is demonstrated that for a 45 minute plug-flow residence time, the systems containing iron exhibited substantially higher O/C ratios than systems only containing H2O2. The resulting SOA exhibits carboxylic acid functionalization, which is consistent with the OH mechanism proposed by Perri et al. (2009). These results suggest that iron chemistry may enhance aqueous OH levels and signifi- cantly contribute to SOA oxidation in atmospheric particles.
Courtesy of Andrew Metcalf, Univ. of Minnesota
VOC OH SVOC OH SVOC2 OH … OH LVOC
OH VOC3
OH
VOC2
SVOC SOA
OH, HO2, H2O2, etc
OH
aqSVOC OH … OH aqSVOC
aqVOC
OH
aqSOA
Mixed Phase Chemistry
VOC: Vola-le Organic Compound SVOC: Semi-‐Vola-le Organic Compound LVOC: Low-‐Vola-le Organic Compound SOA: Secondary Organic Aerosol
Key
aqSOA: Aqueous derived SOA aqSVOC: Aqueous derived SVOC aqVOC: Aqueous derived VOC
Gas Phase
Wet Aerosol, Cloud Droplet
Figure 1.1: Overview of select processes leading to the formation and consumption of secondary organic aerosol (SOA).
Zeng, X., Jonsson, H.H., Woods, R.K., Flagan, R.C., and Seinfeld, J.H. (2015). Stratocumu- lus cloud clearings and notable thermodynamic and aerosol contrasts across the clear-cloudy interface. J. Atmos. Sci.. accepted.
2. Chaung, C.C., Penner, J.E., Prospero, J.M., Grand, K.E., Rau, G.H., Kawamoto, K. (2002).
Cloud susceptibility and the first aerosol indirect forcing: Sensitivity to black carbon and aerosol concentrations. J. Geophys. Res. 107, D21. DOI: 10.1029/2000JD000215.
3. DeCarlo, P.F., Kimmel, J.R., Trimborn, A., Northway, M.J., Jayne., J.T., Aiken, A.C., Gonin, M., Fuhrer, K., Horvath, T., Docherty, K.S., Worsnop, D.R., and Jimenez, J.L. (2006). Anal.
Chem. 78, 8281-8280. DOI: 10.1021/ac061249n.
4. Intergovernmental Panel on Climate Change (2014). Climate Change 2014: Synthesis Report.
Contribution of Working Groups I, II and III to the Fifth Assessment Report of the Inter- governmental Panel on Climate Change [Core Writing Team, R.K. Pachauri and L.A. Meyer (eds.)]. IPCC, Geneva, Switzerland, 151 pp.
5. Ervens, B., Turpin, B.J., and Weber, R.J. (2011). Secondary organic aerosol formation in cloud droplets and aqueous particles (aqSOA): a review of laboratory, field and model studies.
Atmos. Chem. Phys. 11, 11069-11102. DOI: 10.5194/acp-11-11069-2011.
6. Faust, B.C. and Zepp, R.G. (1993). Photochemistry of aqueous iron(III)-polycarboxylate complexes: the chemistry of atmospheric and surface waters. Environ. Sci. Technol. 27, 2517-2522.
7. Froyd, K.D., Murphy, S.M., Murphy, D.M., de Gouw, J.A., Eddingsaas, N.C., and Wennberg, P.O. (2010). Contribution of isoprene-derived organosulfates to free tropospheric aerosol mass.
Proc. Natl. Acad. Sci. 107, 21360-21365. DOI:10.1073/pnas.1012561107.
8. Hegg, D.A., Covert, D.S., and Jonsson, H.H. (2008). Measurements of size-resolved hygroscop- icity in the California coastal zone. Atmos. Chem. Phys. 8, 7193-7203. DOI: 10.5194/acp-8- 7193-2008.
9. Hegg, D.A., Covert, D.S., Jonsson, H.H., and Woods, R. (2009). Differentiating natural and anthropogenic cloud condensation nuclei in the California coastal zone. Tellus. 61B, 669-676.
DOI:10.1111/j.1600-0889.2009.00435.x
Atmos. Chem. Phys. 10, 7341-7351. DOI: 10.5194/acp-10-7341-2010.
11. Jimenez, J.L et al. (2009). Evolution of organic aerosols in the atmosphere. Science. 326 (5959), 1525-1529. DOI: 10.1126/science.1180353.
12. Kloesel, K. A. (1992). Marine stratocumlus cloud clearing episodes observed during FIRE.
Mon. Weather Rev. 120, 565-578.
13. Kwon, H., Cho, S., Chun, Y., Lagarde, F., and Pershagen, G. (2002). Effects of the Asian dust events on daily mortality in Seoul, Korea. Environ. Res. A.90, 1-5. DOI: 10.1006/enrs.2002.4377.
14. Lambe, A.T., Onasch, T.B., Massoli, P., Croasdale, D.R., Wright, J.P., Ahern, A.T., Williams, L.R., Worsnop, D.R., Brune, W.H., and Davidovits, P. (2011a). Laboratory studies of the chemical composition and cloud condensation nuclei (CCN) activity of secondary organic aerosol (SOA) and oxidized primary organic aerosol (OPOA). Atmos. Chem. Phys. 11, 8913-892. DOI:10.5194/acp-11-8913-2011.
15. Lambe, A.T., Ahern, A.T., Williams, L.R., Slowik, J.G., Wong, J.P.S., Abbatt, J.P.D., Brune, W.H., Ng, N.L., Wright, J.P., Croasdale, D.R., Worsnop, D.R., Davidovits, P., and Onasch, T.B. (2011b). Characterization of aerosol photooxidation flow reactors: Heterogeneous oxi- dation, secondary organic aerosol formation and cloud condensation nucleus (CCN) activity measurements. Atmos. Meas. Tech. 4, 445-461. DOI:10.5194/amt-4-445-2011
16. Lambe, A.T., Chhabra, P.S., Onasch, T.B., Brune, W.H., Hunter, J.F., Kroll, J.H., Cum- mings, M.J., Brogan, J.F., Parmar, Y., Worsnop, D.R., Kolb, C.E., and Davidovits, P. (2015).
Effect of oxidant concentration, exposure time, and seed particles on secondary organic aerosol chemical composition and yield. Atmos. Chem. Phys. 15, 3063-3075. DOI:10.5194/acp-15- 3063-2015
17. Lin, J., Pan, D., Davis, S.J., Zhang, Q., He, K., Wang, C., Streets, D.G., Wuebbles, D.J., and Guan, D. (2014) China’s international trade and air pollution in the United States. PNAS, 11 (5), 1736-1741. DOI:10.1073/pnas.1312860111.
18. Li, R., Palm, B.B., Ortega, A.M., Hlywiak, J., Hu, W., Peng, Z., Day, D.D., Knote, C., Brune, W.H., de Gouw, J.A., and Jimenez, J.L. (2015). Modeling the radical chemistry in an oxidation flow reactor: Radical formation and recycling, sensitivities, and OH exposure estimation equation. J. Phys. Chem. A.119, 4418-4432. DOI:10.1021/jp509534k.
spheric aerosols: A modeling study. Environ. Sci. Technol46, 8075-8081. DOI:10.1021/es3002986 20. Murphy, S.M., Agrawal, H., Sorooshian, A., Padro, L.T., Gates, H., Herset, S., Welch, W.A.,
Jung, H., Miller, J.W., Cocker III, D.R., Nenes, A., Jonsson, H.H., Flagan, R.C., and Seinfeld, J.H. (2009). Comprehensive Simultaneous shipboard and airborne characterization of exhaust from a modern container ship at sea. Environ. Sci. Technol.. 43 (13), 4626-4640. DOI:
10.1021/es802413j.
21. Perri, M.J., Seitzinger, S., and Turpin, B.J. (2009). Secondary organic aerosol production from aqueous photooxidation of glycolaldehyde: Laboratory experiments. Atmos. Environ.
43, 1487-1497. DOI:10.1016/j.atmosenv.2008.11.037
22. Perri, M.J., Lim, Y.B., Seitzinger, S.P, and Turpin, B.J. (2010). Organosulfates from glyco- laldehyde in aqueous aerosols and clouds: Laboratory studies. Atmos. Environ. 44, 2658-2664.
DOI:10.1016/j.atmosenv.2010.03.031
23. P¨oschl, U. (2005). Atmospheric aerosols: composition, transformation, climate and health effects. Angew. Chem. Int. Ed. 44, 7520-7540. DOI: 10.1002/anie.200501122.
24. Russell, L.M. et al. (2013). Eastern Pacific Emitted Aerosol Cloud Experiment (E-PEACE).
B. Am. Meterol. Soc. 94, 709-729. DOI: 10.1175/BAMS-D-12-00015.
25. Siefert, R.L., Pehkonen, S.O., Erel, Y., and Hoffman, M.R. (1994). Iron photochemistry of aqueous suspensions of ambient aerosol with added organic acids. Geochim. Cosmochim. Acta 58 (15), 3271-3279.
26. Sorooshian, A., Wang, Z., Coggon, M.M., Haflidi, J., Erven, B. (2013). Observations of Sharp Oxalate Reductions in Stratocumulus Clouds at Variable Altitudes: Organic Acid and Metal Measurements During the 2011 E-PEACE Campaign. Environ. Sci. Technol. 47, 14, 77477756. DOI: 10.1021/es4012383.
27. Wonasch¨utz,A. , Coggon, M.M., Sorooshian, A., Modini, R., Frossard, A., Ahlm, L., Mul- menstadt, J., Roberts G. C., Russell, L.M., Dey, S., Brechtel, F.J., Seinfeld, J.H. (2013).
Hygroscopic properties of organic aerosol particles emitted in the marine atmosphere. Atmos.
Chem. Phys. 13, 11919-11969. DOI:10.5194/acpd-13-11919-2013
28. Zhang, X., Schwantes, R., Coggon, M.M., Loza, C., Schilling, K., Flagan, R.C., Seinfeld, J.H.
(2013). Role of ozone in SOA formation from alkane photooxidation. Atmos. Chem. Phys., 14, 1,733-1,753, DOI:10.5194/acp-14-1733-2014.
Chapter 2
Observations of Continental Biogenic Impacts on Marine
Aerosol and Clouds off the Coast of California
This chapter is reproduced with permission from ”Observations of Continental Biogenic Impacts on Marine Aerosol and Clouds off the Coast of California” by Matthew M. Coggon, Armin Sorooshian, Zhen Wang, Jill S. Craven, Andrew R. Metcalf, Jack J. Lin, Athanasios Nenes, Haflidi H. Jonsson, Richard C. Flagan, and John H. Seinfeld,Journal of
Journal of Geophysical Research: Atmospheres
RESEARCH ARTICLE
10.1002/2013JD021228
Key Points:
• BOA is measured above marine stratocumulus off the coast of California
• BOA was observed to entrain into the marine boundary layer
• BOA has a wide area of impact off the coast of California
Supporting Information:
• Readme
• Supporting Information
• Figure S1
• Figure S2
• Figure S3
• Figure S4
• Figure S5
• Figure S6
• Figure S7
• Figure S8
• Figure S9
• Movie S1
Correspondence to:
J. H. Seinfeld, [email protected]
Citation:
Coggon, M. M., A. Sorooshian, Z. Wang, J. S. Craven, A. R. Metcalf, J. J. Lin, A. Nenes, H. H. Jonsson, R. C. Flagan, and J. H. Seinfeld (2014), Obser- vations of continental biogenic impacts on marine aerosol and clouds off the coast of California,J. Geo- phys. Res. Atmos.,119, 6724–6748, doi:10.1002/2013JD021228.
Received 21 NOV 2013 Accepted 16 MAY 2014
Accepted article online 21 MAY 2014 Published online 11 JUN 2014
Observations of continental biogenic impacts on marine aerosol and clouds off the coast of California
M. M. Coggon1, A. Sorooshian2,3, Z. Wang3, J. S. Craven1, A. R. Metcalf4, J. J. Lin5, A. Nenes5,6, H. H. Jonsson7, R. C. Flagan1,8, and J. H. Seinfeld1,8
1Division of Chemistry and Chemical Engineering, California Institute of Technology, Pasadena, California, USA, 2Department of Chemical and Environmental Engineering, University of Arizona, Tucson, Arizona, USA,3Department of Atmospheric Sciences, University of Arizona, Tucson, Arizona, USA,4Department of Mechanical Engineering, University of Minnesota, Minneapolis, Minnesota, USA,5School of Earth and Atmospheric Sciences, Georgia Institute of Technology, Atlanta, Georgia, USA,6School of Chemical and Biomolecular Engineering, Georgia Institute of Technology, Atlanta, Georgia, USA,7Center for Interdisciplinary Remotely Piloted Aircraft Studies, Naval Postgraduate School, Monterey, California, USA,8Department of Environmental Science and Engineering, California Institute of Technology, Pasadena, California, USA
Abstract During the 2011 Eastern Pacific Emitted Aerosol Cloud Experiment (E-PEACE) and 2013 Nucleation in California Experiment (NiCE) field campaigns, a predominantly organic aerosol (>85%
by mass) was observed in the free troposphere over marine stratocumulus off the coast of California.
These particles originated from a densely forested region in the Northwestern United States. The organic mass spectrum resolved by positive matrix factorization is consistent with the mass spectra of previously measured biogenic organic aerosol. Particulate organic mass exhibits a latitudinal gradient that corresponds to the geographical distribution of vegetation density and composition, with the highest concentration over regions impacted by densely populated monoterpene sources. Due to meteorological conditions during summer months, cloud-clearing events transport aerosol from the Northwestern United States into the free troposphere above marine stratocumulus. Based on the variation of meteorological variables with altitude, dry air containing enhanced biogenic organic aerosol is shown to entrain into the marine boundary layer.
Fresh impacts on cloud water composition are observed north of San Francisco, CA which is consistent with fresh continental impacts on the marine atmosphere at higher latitudes. Continental aerosol size distributions are bimodal. Particles in the 100 nm mode are impacted by biogenic sources, while particles in the∼30 nm mode may originate from fresh biogenic emissions. Continental aerosol in the 100 nm mode is cloud condensation nuclei active and may play a role in modulating marine stratocumulus microphysics.
1. Introduction
Marine aerosol particles play an important role in modulating cloud microphysical properties, transmission of solar radiation, visibility, and the thermodynamic structure of the marine boundary layer. These effects are governed to a large extent by the physical, chemical, and optical properties of aerosol residing over the ocean surface. The eastern Pacific off the western coast of the United States is one of the world’s major subtropical subsidence regions that exhibits persistent decks of stratocumulus, especially during summer months, making it an ideal location to study aerosol-cloud interactions. In addition to marine aerosol such as those resulting from sea spray, this region is heavily influenced by ship emissions, ocean biota, and trans- ported and entrained air masses from both distant regions and coastal areas. The variety of these sources has the potential to result in strong spatial and temporal gradients in aerosol physicochemical properties.
Aerosol and clouds off the central coast of California have been studied in numerous field experiments [Frick and Hoppel, 2000;Durkee et al., 2000;Hudson et al., 2000;Straub et al., 2007;Lu et al., 2009;Hegg et al., 2009, 2010;Moore et al., 2012;Benedict et al., 2012;Coggon et al., 2012;Russell et al., 2013]. One topic that has received considerable attention is the cloud condensation nuclei (CCN) properties of marine aerosol [Roberts et al., 2006;Sorooshian et al., 2009;Hegg et al., 2009, 2010;Langley et al., 2010;Moore et al., 2012;Coggon et al., 2012].Hegg et al.[2009, 2010] apportioned CCN off the coast of California to anthropogenic and natural sources and determined that about 67% of CCN by number could be attributed to human activities, which included continental sources such as biomass burning.Roberts et al.[2006] found that continen- tal sources from Asia and North America can modulate CCN properties over the eastern Pacific Ocean.
Ship emissions exert a strong influence on marine aerosol in regions of active ship traffic [Langley et al., 2010]; in one study,Coggon et al.[2012] demonstrated that 72% of cloud droplet residuals measured in the California shipping lanes showed evidence of ship emissions.
Biogenic-derived compounds make up a significant fraction of volatile organic carbon and organic aerosol in forested regions of California [Cahill et al., 2006;Worton et al., 2011;Setyan et al.

![Figure 7. (a) Comparison of average SV-OOA [Ng et al., 2011], anthropogenic SV-OOA measured in the Los Angeles Basin, CA [Hersey et al., 2011], biogenic organic aerosol measured in Sacramento, CA [Setyan et al., 2012], and biogenic organic aerosol measured](https://thumb-ap.123doks.com/thumbv2/123dok/11762412.0/44.918.326.773.630.955/comparison-anthropogenic-measured-angeles-biogenic-measured-sacramento-biogenic.webp)