ContentslistsavailableatScienceDirect
Journal of Financial Economics
journalhomepage:www.elsevier.com/locate/jfec
Fintech, regulatory arbitrage, and the rise of shadow banks R
Greg Buchak
a, Gregor Matvos
b, Tomasz Piskorski
c, Amit Seru
d,∗aUniversity of Chicago, United States
bMcCombs School of Business, University of Texas at Austin, United States
cColumbia Graduate School of Business, United States
dStanford GSB and the Hoover Institution, United States
a r t i c l e i n f o
Article history:
Received 18 September 2017 Revised 19 February 2018 Accepted 28 March 2018 Available online 4 September 2018
JEL classification:
G2 L5 Keywords:
Fintech Shadow banks Regulatory arbitrage Lending
Mortgages FHA
a b s t r a c t
Shadowbankmarketshareinresidentialmortgageoriginationnearlydoubledfrom2007 to2015,withparticularlydramaticgrowthamongonline“fintech” lenders.Westudyhow twoforces,regulatorydifferencesandtechnologicaladvantages,contributedtothisgrowth.
Differenceindifferencetestsexploitinggeographicalheterogeneityinducedbyfourspecific increasesinregulatoryburden–capitalrequirements,mortgageservicingrights,mortgage- relatedlawsuits,andthemovementofsupervisiontoOfficeofComptrollerand Currency followingclosureoftheOfficeofThriftSupervision–allrevealthattraditionalbankscon- tractedinmarketswheretheyfacedmoreregulatoryconstraints;shadowbankspartially filledthesegaps.Relativetoothershadowbanks,fintechlendersservemorecreditworthy borrowersand aremoreactive intherefinancingmarket.Fintech lenderschargeapre- miumof14–16basispointsandappeartoprovideconveniencerather thancostsavings toborrowers.Theyseemtousedifferentinformationtosetinterestratesrelativetoother lenders.Aquantitativemodel ofmortgagelending suggeststhatregulationaccountsfor roughly60%ofshadowbankgrowth,whiletechnologyaccountsforroughly30%.
© 2018ElsevierB.V.Allrightsreserved.
R We thank Sumit Agarwal, Mark Carey, Michael Cembalest, Stijn Claessens, John Cochrane, Darrell Duffie, Douglas Diamond, Andreas Fuster, Radha Gopalan, Holger Mueller, Chris Palmer, Thomas Philippon, Raghuram Rajan, Philipp Schnabl, John Sedunov, Hyun Shin, Johannes Stroebel, Stijn Van Nieuwerburgh, Nancy Wallace, Toni Whited (the edi- tor), Ariel Zetlin-Jones, Luigi Zingales and seminar participants at Baruch College, Bank for International Settlements, Chicago Fed, Cleveland Fed, Consumer Financial Protection Bureau, Hong Kong Monetary Authority, Housing Finance Policy Center, New York University, Rutgers, Stanford University, University of Wisconsin and conference participants at Con- ference for Empirical Legal Studies, CFAR and JFI Conference, ECB confer- ence on monetary policy and financial intermediation, FDIC 17th Annual Fall Research Conference, Kellogg Fintech Conference, NBER Summer Insti- tute, NBER Financial Market Regulation, OFR FRBC Financial Stability and FINTech Conference, Philadelphia Fed Fintech Conference: The Impact on Consumers, Banking, and Regulatory Policy, and SITE conference on Finan- cial Regulation for helpful comments. We thank Monica Clodius and Sam Liu for outstanding research assistance.
∗ Corresponding author at: Stanford GSB and the Hoover Institution, United States.
E-mail addresses: [email protected] (G. Buchak), [email protected] (G. Matvos),[email protected]
(T. Piskorski),[email protected] (A. Seru).
1. Introduction
In the last decade, the consumer finance market has undergone a dramatic change. Intermediationhas shifted from traditional banks to shadow banks: non-depository institutionsfallingoutsidethescopeoftraditionalbanking regulation.1 Thischange has coincided with a shift away from “brick and mortar” originators to online intermedi- aries.2 Despite the scarcity of systematic evidence, regu- lators,policymakers, andacademicshavebeenengagedin anintensedebateoverthepotentialconsequencesofthese
1We use the term “shadow bank” to refer to nonbank (nondepository) lenders, consistent with the definition of the Financial Stability Board (FSB), whose members cover G20 national regulators, the International Monetary Fund, the World Bank, and the Bank of International Settle- ments. See also Adrian and Ashcraft (2016) .
2Goldman Sachs Report, March 3, 2015: “The future of finance: the rise of the new shadow bank.”
https://doi.org/10.1016/j.jfineco.2018.03.011 0304-405X/© 2018 Elsevier B.V. All rights reserved.
(a) All loans (b) Conforming loans
(c) FHA loans
$0
$200
$400
$600
$800
$1,000
$1,200
$1,400
$1,600
$1,800
$2,000
$2,200
$2,400
2007 2008 2009 2010 2011 2012 2013 2014 2015
$0 $100 $200 $300 $400 $500 $600 $700 $800 $900
2007 2008 2009 2010 2011 2012 2013 2014 2015
$- $50 $100 $150 $200 $250 $300 $350 $400
2007 2008 2009 2010 2011 2012 2013 2014 2015
Fig. 1. Total residential mortgage originations. Panel A shows total dollars in billions originated between 2007 and 2015 as reported by HMDA. Panel B shows the total dollar value of originated conforming mortgages, where a mortgage is conforming if it is conventional and reported as sold to Fannie Mae or Freddie Mac in HMDA. Note that if the mortgage is sold to Fannie Mae or Freddie Mac more than a year after origination it is not reported as sold and hence not counted in Panel B. Panel C shows total dollars of FHA originations.
developments.3 In this paper, we undertake a systematic examination of the evolution of shadow banking in the largest consumer loan market in the US, the ten trillion dollarconsumermortgagemarket.Weseektoexplorethe economic forces that could explain the drastic change in thenatureofintermediation.
We show that shadow banks’ market share in mort- gage origination hasnearly doubled fromroughly 30% in 2007to50%in2015(seeFigs.1–3).Thisgrowthhasbeen particularly robust in the Federal HousingAdministration (FHA) market, which serves less creditworthy borrowers, with shadow banks holding 75% market share in 2015.
An important segment of growth in shadow banks were fintech lenders that primarily originate mortgages online.
Theselendersexpandedrapidlysince2007andaccounted foraquarterofshadowbankoriginationin2015.
Two broad hypotheses have attempted to explain the declineintraditionalbanking:increasedregulatoryburden on traditionalbanksanddisruptivetechnology. The regu- lationhypothesiscontendsthatfollowingthefinancialcri- sis,traditionalbankshavebeensubjecttoincreasinglegal
3Bank of International Settlements, 2017: “FinTech credit. Market struc- ture, business models and financial stability implications.”http://www.
bis.org/publ/cgfs _ fsb1.pdf .
and regulatory burdens. These burdens have raised costs and limited the scope of products that traditional banks can provide, reducing lending. Shadow banks, which do notfacetheseburdens,havegainedmarketsharebystep- pingintothegapsleftbytraditionalbanks.
The technology hypothesis contends that improving lendingtechnology,particularlyamong newshadowbank entrants,hasdriventheshiftawayfromtraditionalbanks.
Fintech shadowbanks havegained market share because their technologyallows them to lend morecheaply or to provide better products. Forexample, Quicken Loans, the third largest mortgage lender in 2015, offers the “Rocket Mortgage” product, whose application is almost entirely onlineandinvolvesnohumanloanofficer.Thisinnovation saveslaborandofficespacecostsandissignificantlymore convenient according to consumer reviews.4 Additionally, fintech lenders may be better able to screen potential borrowers, leveraging alternative sources of information andthebigdataapproachesinherentintechnology-based lending.
Our paper tests both explanations and then digs more deeply to understand the specific regulatory and
4https://www.nerdwallet.com/blog/mortgages/
quickenloansandrocketmortgagereview/ [accessed on 11/8/2016].
(a) All loans (b) Conforming loans
(c) FHA loans 0%
10%
20%
30%
40%
50%
60%
2007 2008 2009 2010 2011 2012 2013 2014 2015 0%
10%
20%
30%
40%
50%
60%
2007 2008 2009 2010 2011 2012 2013 2014 2015
0%
10%
20%
30%
40%
50%
60%
70%
80%
90%
2007 2008 2009 2010 2011 2012 2013 2014 2015
Fig. 2. Shadow bank origination shares. Panel A shows shadow bank origination shares as a fraction of total originations for all mortgages in HMDA between 2007 and 2015. Panel B shows shadow bank origination shares among conforming mortgages. Panel C shows the shadow bank origination share among FHA mortgages.
technologyforcesatwork.Ourfirstapproachtoexamining whetheran increasedregulatoryburdenisadrivingforce behindthe decline of traditional mortgage banking is to compare lendingof banksto all shadowbanks, irrespec- tiveoftheir fintechaffiliation.Wefindthatshadowbanks are more likely to serve riskier, less creditworthy FHA borrowers and areas with larger minority populations.
Given that several enforcement actions and lawsuits had specificallytargetedbanks’ treatmentoflesscreditworthy andminority borrowers, this evidence is consistent with shadow banks expanding in segments where regulatory burdenhasrisensubstantially.
Shadow banks and traditional banks also differ dra- matically in mortgage financing. While traditional banks continue to hold between 30% and 50% of their orig- inated loans on balance sheet, shadow banks finance their originations almost entirely through securitiza- tion and the originate-to-distribute model. While the private securitization market dried up following the crisis, government-sponsored enterprises (GSEs) like Fannie Mae and Freddie Mac have come to play a dominant role in guaranteeing shadow bank origi- nations. These implicit government guarantees that shadowbanksoverwhelminglyrelyonisanotherexample though which regulatory activity has advantaged shadow banks.
With respect to loan pricing, we find negligible dif- ferences in traditional and shadow bank interest rates.
Thisfindinghidesimportantheterogeneitywithin shadow banks, with non-fintech shadow banks offering slightly lower interest rates and fintech shadow banks offering substantiallyhigherinterestrates.Weexplorethishetero- geneity whenstudyingtechnology butconcludethat that whilenon-fintechshadowbankspasssomeregulatorycost savingstoborrowers,giventheconcurrentincreaseinmar- ket shareof fintechshadow banks, costadvantagesalone cannotexplainshadowbankgrowth.
Finally, to link regulation and shadow bank growth more explicitly, we study the impact of four specific increases in regulatory burden: capital requirements, mortgage servicing rights (MSRs), mortgage-related law- suits, and the movement of supervision to Office of Comptroller andCurrency (OCC)following closureof the Office of Thrift Supervision (OTS), widely considered to be a lax regulator(Agarwal etal.,2014;Granja andLeuz, 2018). To avoid confounds related to credit demand dif- ferences across counties, such as differencesin economic fundamentals, we exploit changes in the regulatory bur- den within a differences in differences framework. Our tests reveal that shadow banksgained market share and expanded lending in counties whose banks were more exposed toincreasesinregulatoryburdens.Moreover,the
(a) All loans (b) Conforming loans
(c) FHA loans 0%
5%
10%
15%
20%
25%
30%
2007 2008 2009 2010 2011 2012 2013 2014 2015 0%
5%
10%
15%
20%
25%
30%
35%
40%
2007 2008 2009 2010 2011 2012 2013 2014 2015
0%
5%
10%
15%
20%
25%
2007 2008 2009 2010 2011 2012 2013 2014 2015
Fig. 3. Fintech origination shares of shadow bank originations. Panel A of this figure shows fintech originations as a share of shadow bank originations for all mortgages in HMDA between 2007 and 2015. Panel B shows fintech bank origination shares among shadow bank conforming originations. Panel C shows fintech share among shadow bank FHA originations (based on HMDA).
timing of specific regulatory changes is closely linked to theriseofshadowbanksinexposedcounties.
Concerning technology, fintech firms accounted for roughly a quarter of shadow bank loan originations in 2015. This aggregate fact suggeststhat onlineorigination technologymayhaveplayedan importantrole inthede- cline of traditional banks during the last decade. To as- sess the role of this technology, we focus on technology differences between shadow banks, which allows us to holdregulatorydifferencesbetweenlendersfixed.Wefirst show that fintechlendersserve differentsegments ofthe mortgage market than non-fintechshadow banks:fintech lenders’originationactivityoverwhelminglyfocusesonre- financing,whichwe speculateisa comparativeadvantage ofonlineorigination.Additionally,fintechlendersare less likelytoservelesscreditworthyFHAborrowersandhigher unemploymentgeographies.
Importantly,we findthatfintechshadowbankscharge significantly higher interest rates than both non-fintech shadow banks and traditional banks. The combination of high interest rates and growing market shares sug- gestsan increasing consumerdemand forfintechservices as the technology improves. These results suggest that fintech entry in this market is not only driven by cost saving technology. We also find significant differencesin information used to set mortgage interest rates between fintech and non-fintech lenders. Standard variables for
predicting interest rates, such as FICO and loan-to-value ratio(LTV), explain substantially lessvariation in interest rates of fintech lenders relative to non-fintech lenders.
In other words, technology-based lending uses different information,potentially based on big data,in addition to standardpricingvariables.
Takentogether,ourresultssuggestthat bothincreased regulatory burdens andtechnological improvements have contributed to the decline of traditional banks’ market share.To decompose their relative contributions, we cal- ibrate a simple quantitative model of mortgage origina- tion.In the model,traditional banks, non-fintech shadow banks, and fintech shadow banks compete for borrow- ers. Tocapture the conventional factsthat we document, theselenders differon three dimensions: regulatory bur- den,convenience, andcosts ofmakingloans.Pricing,firm entry,andmarkupsaredeterminedendogenouslyforeach typeoflender.Weinterpretthevariationinmortgagerates andmarketsharesusingthemodeltoidentifytherelative importanceofdifferentfactorsinthedeclineoftraditional banking.
Our estimates imply that traditional banks have slightlylower shadowcostof fundingandprovidehigher qualityproductsthanshadowbanks.Despitetheseadvan- tages, they lose market share duringthis period because of increasing regulatory burdens after 2010. This pe- riod coincides with the adoption of a number of new
regulatoryinitiativesconcerningbankcapitalrequirements andstricterregulatory oversight.We alsoestimate asub- stantialincrease inperceivedquality ofonlineorigination platformsbyborrowersoccurringbetween2009and2012.
Putting these effects together, we find that increasing regulatory burden can account for about 60% of shadow bank growth during 2008–2015 period, advancement in onlinelendingtechnologyaccountingforanother30%,and thebalancecomingfromothersources.
2. Relatedliterature
Ourpaper tiestogether separate strands ofthe litera- turerelatingtoresidential mortgagelending,bankingreg- ulation,andthegrowingroleoffinancialtechnology.
2.1. Thestructureoftheresidentialmortgagemarket
Many papers have studied the structure of the mort- gage origination chain, with particular attention paid to the originate-to-distribute model and the costs and benefits thereof (e.g., Berndt and Gupta, 2009; Piskorski et al., 2010;Keys et al., 2010, 2013; Purnanandam, 2011).
Thefocushasprimarilybeenontherun-uptothefinancial crisis ratherthanon theimmediateaftermathandrecov- eryfollowingthecrisis.
Bank-like activities taking place outside of traditional deposit-taking institutions have attracted considerable attention in the literature and at federal banking regu- lators (see Adrian and Ashcraft, 2016 for an exhaustive summary).The literature(e.g.,BordandSantos,2012)has primarily focused on the maturity transformation role of banks taking place outside of banks. Our paper instead focuseson mortgage origination takingplace outside the traditional banking system and its accompanying regula- torystructure. In thisregard ourpaper is alsorelated to the recent literature investigating the industrial organi- zation of the residential mortgage market (e.g., Stanton etal.,2014,2018).
2.2.BankingregulationandGSEs
Our paper relates to a large literature examining the roleofgovernmentprogramsundertakenduringthefinan- cialcrisis (e.g.,Mayeretal., 2014;Haughwoutetal.,2016;
Agarwaletal.,2015,2017).LikeAgarwaletal.(2014),Lucca et al.(2014), Granja et al. (2017), Piskorski et al. (2015), Fligstein and Roehrkasse (2016), Granja and Leuz (2018), we studylawsuits arising out of the financial crisis, cap- italconstraints,andthe closureofthe OTS.We makeuse ofgeographicalheterogeneityinregulatoryburdentoshow thatshadowbanks,facingrelativelylowerregulatorypres- sureinheavilyregulatedmarkets,gainmarketshare.
Because shadow banks rely heavily on GSEs and FHA guarantees, our paper relates to literature studying GSEs andtheir roleinmortgagelending.GSEswereestablished topromotehousingownership,particularlyinunderserved areas, anda number of papers (e.g., Elenevet al., 2016; Hurstetal., 2016;Acharya etal., 2011)havestudiedtheir roleinincomeredistributionandhouseownership,finding mixedresults.Ourpapersuggeststhatincreasedregulatory
burdenoftraditionalbankscombinedwithGSEsandFHA guaranteesmayhavecontributedgreatlytotheriseofthe shadowbankingsector.
2.3. Financialtechnology
Ourpaperconnectstothe growingliteratureonfinan- cialtechnology,e.g.,Philippon(2015,2016)andGreenwood andScharfstein(2013).Toourknowledge,ours isthefirst paper that performs a detailed analysis on fintech and non-fintech firms operating within the residential mort- gage industry in an effort to explore what technological advantagesfintechlendershaveovernon-fintechones.Us- inga methodologysimilar toRajanetal.(2015),weshow that fintech lenders appear to use substantially different methodsto setinterest rates.Philippon(2015) showsthat advances infinancialtechnology havefailedtoreduce in- termediationcosts. Inthat spirit,ourpapershowsfintech lendersinfactofferhigherinterestratesthannon-fintech lenders.However,consumers’willingnesstousemoreex- pensive fintech lenders mayalso reflect moreconvenient services offered by these lenders. In this regard, Fuster et al. (2018) study how technology impacts frictions in themortgage originationprocess,suchasslowprocessing times, capacity constraints, and refinancing. They show that fintech lenders process mortgage applications faster and adjust supply more elastically than other lenders in response to mortgage demand shocks, which suggests that technologicalinnovationmayhaveimprovedtheeffi- ciencyoffinancialintermediationinthemortgagemarket.
Bartlett et al. (2018) study the role of fintech lenders in alleviating discrimination in mortgage markets. Theyfind evidence that suggeststhat such lenders make themort- gagelendingmarketsmoreaccessibletoAfricanAmerican andHispanicborrowersandprovidetheseborrowerswith fairerpricing.
Finally,Philippon(2016)proposesthatfintechcanoffer a way toward structuralchange in the financial industry, becausepoliticaleconomyconsiderationscanstiflechange inthetraditionalpartofthesector.Ourpaperadvisescau- tion:whilefintechlendersdoentertohelpfillthegapleft by the banks, they havedone so by having reliedalmost exclusivelyonexplicitandimplicitgovernmentguarantees ascustomers.
3. Dataandlenderclassification 3.1. Descriptionofdatasets
We combine and use the following data sets in our paper.
HMDA:Weusemortgageapplicationdatacollectedun- der the Home Mortgage Disclosure Act (HMDA) to ex- amine loan-level and area-level lending patterns. HMDA records the vast majority of home mortgage applications and approved loans in the United States. The data pro- vides, among other things, the application outcome, the loan type andpurpose,the borrower’s race,income, loan amount, year, census tract, and importantly for our pur- pose, the originator’sidentity. Due to mergers and name changes, theidentificationofHMDA lenderschangesover
time,andtoovercomethislimitation,we manuallylinked lenders across years. HMDA further records whether the originator retains the loan on balance sheet or sells the loanwithin one yeartoa thirdparty,includingto aGSE.
Iftheoriginatorretainsaloanthroughtheendofthecal- endar year before selling it, we would observe this as a nonsale.
FannieMaeandFreddieMacsingle-familyloanperfor- mance data: The Fannie Mae and Freddie Mac data sets provide origination andperformance data on a subset of these GSEs’30-year,fully amortizing, full documentation, single-family,conformingfixed-ratemortgagesthatarethe predominant conforming contract type in the US.5 This loan-levelmonthlypaneldatahasdetailedinformationon a rich array of loan, property, and borrower characteris- tics(e.g.,interestrates,location ofthe property,borrower credit scores, LTV ratios) and monthly payment history (e.g., delinquent or not, prepaid). The loans in our data wereacquiredbetweenJanuary1,2000,andOctober2015.
The monthly performance data runs through June 2016.
CombiningtheFannieMaeandFreddieMacdatasetsgives uscoverageofthemajorityofconformingloansissuedin theUnitedSatesduringtheperiodofourstudy.
TheFHAdataset:ThisdataprovidedbytheUSDepart- ment ofHousingandUrbanDevelopment(HUD) contains single-family portfolio snapshots of loans insured by the FHA.The FHAprogramis intendedto aidborrowerswith particularly low credit scoreswho mayotherwise be un- abletoborrowfromconventionallenders.Thedatabegins inFebruary2010andisupdatedmonthlythroughDecem- ber 2016. The FHA data recordsproduct type (adjustable orfixed-rate),loanpurpose(purchaseorrefinance), inter- estrate, state, county,metropolitan statisticalarea(MSA), and importantly for our purposes, the originating mort- gagee. Notably absent from the FHA data are borrower FICO scores; so whileby the nature ofthe program,FHA borrowershavelow credit scores,andwe cannot directly controlforborrowercreditscorewithin theFHAdata.For this reason, when studying loan interest rates and out- comes,we focusouranalysisprimarily ontheloans from FannieMaeandFreddieMacdatabases.
USCensusdata:Weusecounty-leveldemographicdata fromtheUSCensusandAmericanCommunity Surveybe- tween 2006 and2015. We collect population, population density,racialandethniccharacteristics,education,income andpoverty,andhomeownershipstatistics.
Regulatory burden of depository institution data: In studying the market share of shadow banks we investi- gatewhethershadowbanksarelikelytoenterareaswhere thetraditionalbankingsystemfacesheightenedregulatory scrutiny.Wedrawonanumberofdatasourcestomeasure
5The data set does not include adjustable-rate mortgage loans, balloon mortgage loans, interest-only mortgage loans, mortgage loans with pre- payment penalties, government-insured mortgage loans, Home Affordable Refinance Program (HARP) mortgage loans, Refi Plus TM mortgage loans, and nonstandard mortgage loans. Also excluded are loans that do not reflect current underwriting guidelines, such as loans with originating LTVs over 97% and mortgage loans subject to long-term standby com- mitments, those sold with lender recourse or subject to other third-party risk-sharing arrangements, or were acquired by Fannie Mae on a negoti- ated bulk basis.
theseregulatoryburdensbetween2006and2015.Inpar- ticular,weusebankbalancesheetdatafromthebankcall reports,fromwhichwecalculatebankcapitalization.
Lawsuit settlements data: Finally, following Piskorski etal.(2015) andFligstein andRoehrkasse (2016),we col- lect lawsuit settlements arising out of the financial cri- sisbroughtagainstbanks,lenders,andmortgageservicers.
We construct a timeline of settlements and settlement amounts by year and bank by aggregating data from a number of sources. From Law360,6 a news service that coversall aspects oflitigation,we collect dataon lawsuit settlements associated with residential mortgage-backed securities(RMBS), mortgage foreclosures, fraud, deceptive lending, securitization, refinancing, androbo-signing. The Law360data spans 2008 through 2016. From the Securi- tiesand ExchangeCommission (SEC), we collectedall le- galactionstakenbytheSECregardingmisconductthatled toor arosefrom thefinancial crisis.7 TheSEC data spans 2009through2016.FromSNLFinancial,nowapartofS&P Global Intelligence, we collect a timeline of major bank settlementsarisingoutofthefinancialcrisisbetween2011 and2015.8
3.2.Lenderclassification
Central to this paper is the classification of mortgage lenders as banks or shadow banks and within shadow banksasfintechornon-fintech.Weperformthisclassifica- tionmanually.TheFannieMae,FreddieMac,andFHAdata identifyeachloan’soriginatoriftheoriginatorwasamong thetop50originatorsinthereportingperiod.HMDAiden- tifies all originators. We classify the identified lenders in theFannie Mae, Freddie Mac,andFHA data.Additionally, weclassifythelargestlendersinHMDAthatarenotiden- tifiedintheFannie,Freddie,orFHAdatasothatourclas- sifiedsamplecovers 80% of totaloriginations by value in 2010. Robustness with respect to lender classification is discussedinSection10.
Alender isa “bank” if it isa depositoryinstitution; a lenderisa“shadowbank” otherwise.Thisdefinitioncom- mands broad regulatory agreement: it is consistent with the definition of the FSB, which defines banks as “[a]ll deposit-takingcorporations” and shadowbanksas“credit intermediationinvolving entities and activities outside of theregular banking system.”9 Because our focusis mort- gageorigination,ourmeasurementofshadowbankingfalls squarelywithintheFSBdefinition.FSBmemberscomprise both national regulators of G20 countries, as well as in- ternationalfinancialinstitutions,such astheInternational Monetary Fund, the World Bank, and the Bank of Inter- national Settlements, as well as international standard- settingandother bodies such astheBaselCommittee on BankingSupervision.
The classification of fintech and non-fintech is more subjective:weclassifyalenderasafintechlenderifithas
6https://www.law360.com/faq .
7https://www.sec.gov/spotlight/enf- actions- fc.shtml .
8https://www.snl.com/InteractiveX/Article.aspx?id=33431645 .
9http://www.fsb.org/wp- content/uploads/global- shadow- banking- monitoring-report-2015.pdf .
astrongonlinepresenceandifnearlyall ofthemortgage applicationprocesstakesplace onlinewithno humanin- volvement from the lender.For example, an applicant to QuickenLoans,the prototypicalfintech lender,canbeap- proved for a loan with a locked-in interest rate with no human interaction; the borrower meets a Quicken Loans loanofficer for the first time only atclosing (see Online AppendixA.4). Anapplicant atanon-fintech firm,on the otherhand,interactswithahumanloanofficermuchear- lier inthe process, evenif theprocess begins online.For instance,aborrowermayinputhernameandlocationon- lineandthenbe directed tophonea localloanofficer to continue.
Whileweconsiderthepossibilityof“fintechtraditional banks,” we find no banks fitting our criteria among the nation’s largest bank lenders. More details on this are discussed in OnlineAppendix A.7, where we additionally confirm the historical accuracy of our classifications us- ing the “Wayback Machine” to view archived webpages.
Conversations with senior bankers confirm our finds and suggest a hesitancy to adopt automated lending technol- ogy,duetotheexistenceoflegacysystemsandprocesses, and,inlinewiththethemesofthispaper,aconcernover regulatoryscrutinyinthewakeofrobo-signingscandals.10 OnlineAppendix A.1showsthelistofmain lendersin each of thesethree categories. OnlineAppendix A.7 pro- videsmoredetailsontheclassificationprocess.
4. Institutionalbackground
This section provides an overview of the institutional detailsandhistoryofshadowbankingbeforeandafterthe financialcrisis.
4.1. Historyofshadowbankingintheretailmortgagemarket
While this paper focuses on shadow bank mortgage originationafter the crisis, we note that shadowbanks a large market sharebefore the crisis. Goldman Sachsesti- matesthatamongthetop20lenders,shadowbanksorig- inatedroughly 30% of all mortgagesforthe years 2004—
2006.Theshadowbanklendingwasheavilyconcentrated:
CountrywideFinancialaloneaccountedformorethanhalf oftheshadowbankoriginations.11
Shadow bank originators rely almost exclusively on making loans that are originatedfor sale to third parties Theidentity ofthethird party dependson theoriginated product: Fannie Mae and Freddie Mac buy conforming loans; Ginnie Mae buys loans by the FHA or Veterans Administration (VA). Private securitizers bought noncon- formingjumboorsubprimemortgages.
Precrisisshadowbankswereparticularlyactiveinthese nonagencymarkets,whichessentiallyvanishedduringthe
10 See, for example, https://diginomica.com/2017/10/12/fintech-risk- aversion-culture-shock/ , https://letstalkpayments.com/why-banks- should- not- be- held- responsible- for- slow- innovation- adoption/ https:
//www.americanbanker.com/opinion/regulatory-ambiguity-is-slowing- bank- adoption- of- cloud- services https://thefinancialbrand.com/65069/
america- us- banking- digital- innovation- trends/ .
11 GS Report, pg. 51.
crisis. Because shadow banksare so relianton secondary markets for their originations, shadow bank lenders like Countrywide and New Century found themselves unable to secure additional financing when the secondary mar- ketfornonconformingsubprimeandjumboloansdriedup in 2007.Asa result, manyshadowbank lendersdeclared bankruptcy or were sold to traditional banks.12 Conse- quently,duringthefinancialcrisisandthefollowingreces- sion, shadow bank mortgage origination fell significantly.
Inthedepthsoftherecession,shadowbankmarketshare amongthe50largestlendersfelltoroughly15%.(SeeOn- line Appendix A.6). Even including smaller lenders, the shadowbankmarketsharefelltolessthan30%in2008.
4.2. Regulatorychanges
Following the financial crisis, a number of regulatory changes have hada directinfluence ontraditional banks’
mortgage origination activity. Weakened bank balance sheetscombinedwithnewcapitalrulesunderBaselIIIled to tightened regulatory capital constraints. In particular, Basel III changed risk-weighted capital requirements and placed limits on banks counting MSRs toward their reg- ulatory capital requirement.13 The MSR rule change was proposed, finalized, and implemented between 2010 and 2015.14 At the same time, lawsuits arising from conduct prior andduringtothecrisisfell heavilyonthesurviving lenders, which were overwhelmingly banks. Additionally, the OTS, which hadoverseen failedlenders likeCountry- wide and Washington Mutual and had a reputation for lax oversight, was closed, and its duties folded into the OCC,FederalDepositInsuranceCorporation(FDIC),Federal Reserve, andnewly formedConsumerFinancial Protection Bureau(CFPB).
5. Theriseofshadowbanksandfintech
Webeginouranalysisbyshowingtherapiddeclineof traditionalbanksinresidentialmortgagelendingintheUS during2007–2015period,followingthe startoftheGreat Recession.
5.1. Aggregatefacts
Residential lendingvolume fluctuated significantly be- tween 2007 and2015. Fig.1,Panel Ashowsthe value of newUSresidentialmortgagesasreportedinHMDAbyyear oftheir origination.In2007theoriginations reachedover
$2 trillion; in 2008 it declined to less than $1.4 trillion, onlyto peakatalmost$2.2trillionin2012beforedeclin- ingagain.Fig.1,PanelBshowsthelendingvolumeincon- forming mortgages,the most popularresidential loansin
12http://www.charlotteobserver.com/news/business/banking/
article9151889.html , accessed April 15, 2017.
13GS Report, pg 54.
14See https://deepblue.lib.umich.edu/bitstream/handle/2027.42/110908/
1213 _ Shakespeare _ March2016.pdf .
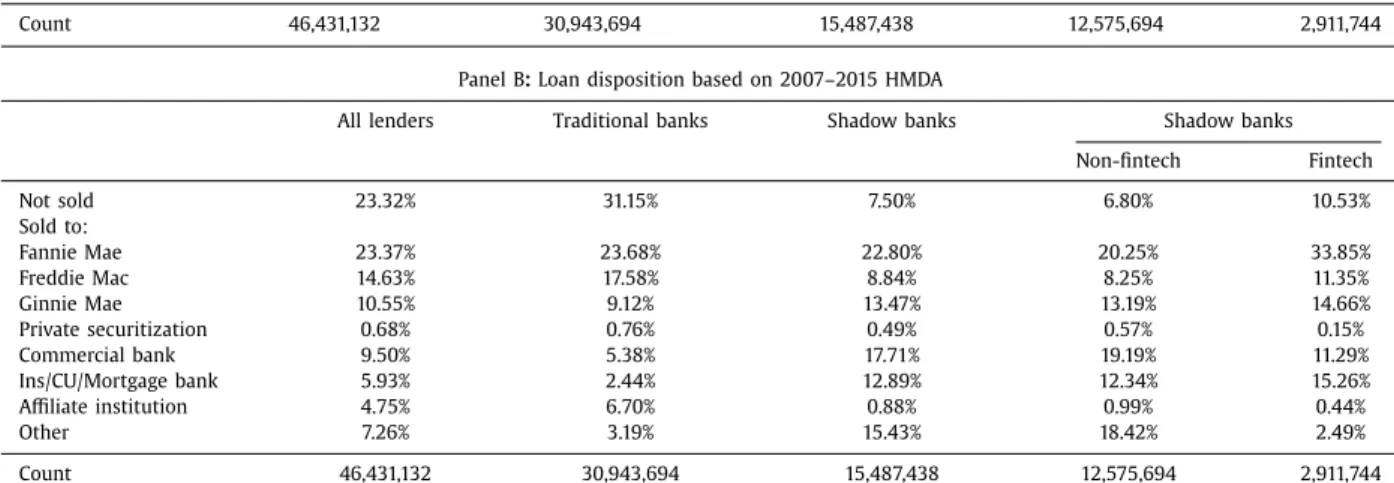
Table 1
Residential mortgage lending: traditional versus shadow banks.
Table 1 provides shows loan type and disposition by lender type. Panel A reports the types of loans types made by different lenders between 2007 and 2015. Loan types are Conventional, FHA, or Other, which includes VA and FSA/RHS (Farm Service Agency and Rural Housing Service) loans. Conventional loans are all loans that are not FHA or VA/FSA/RHS loans. Column (1) reports the composition of loans made by all lenders; Column (2) reports those made by traditional banks; Column (3) reports those made by shadow banks. Column (4) reports those made by non-fintech shadow banks, and Column (5) reports those made by fintech shadow banks. Panel B reports to which type of entity the originating entity sold the loan. Loans not sold within one year are Not sold. Columns are the same as in Panel A.
Panel A : loan types based on 2007–2015 HMDA
All lenders Traditional banks Shadow banks Shadow banks
Non-fintech Fintech
% Conventional 76.9% 83.2% 64.31% 62.0% 74.3%
% FHA 15.8% 11.0% 25.33% 26.9% 18.7%
% Other 7.3% 5.8% 10.36% 11.1% 7.0%
Count 46,431,132 30,943,694 15,487,438 12,575,694 2,911,744
Panel B : Loan disposition based on 2007–2015 HMDA
All lenders Traditional banks Shadow banks Shadow banks
Non-fintech Fintech
Not sold 23.32% 31.15% 7.50% 6.80% 10.53%
Sold to:
Fannie Mae 23.37% 23.68% 22.80% 20.25% 33.85%
Freddie Mac 14.63% 17.58% 8.84% 8.25% 11.35%
Ginnie Mae 10.55% 9.12% 13.47% 13.19% 14.66%
Private securitization 0.68% 0.76% 0.49% 0.57% 0.15%
Commercial bank 9.50% 5.38% 17.71% 19.19% 11.29%
Ins/CU/Mortgage bank 5.93% 2.44% 12.89% 12.34% 15.26%
Affiliate institution 4.75% 6.70% 0.88% 0.99% 0.44%
Other 7.26% 3.19% 15.43% 18.42% 2.49%
Count 46,431,132 30,943,694 15,487,438 12,575,694 2,911,744
theUS.15Overthistimeperiod,almosthalfofloanswere loanssoldtoGSEswithintheyear.16
Fig.1,Panel Cpresentsvolumesof FHA-insuredloans.
FHA loans allow lower income and less creditworthy households to borrow money, often at below-private- marketrates,forthepurchaseofahome thatthey would not otherwise be able to afford.FHA borrowers typically make only a 3.5% down payment, withthe FHA loan fi- nancing the balance. These loans account for approxi- mately15%ofoursample(Table1,PanelA,Column1)and are the second mostpopular loansegment in theUnited States. Aggregate trends in FHA loanvolumes differ sub- stantially fromconformingmortgage trends.The issuance segment rose from $70 billion in 2007 to peak in 2009 atover$340billion.Thisdramaticgrowthreflectsthedis- appearanceoftheprivatesubprimelendingmarket,which wastheclosestsubstituteformanyFHAloans.
Despite these large fluctuations in the aggregate amount of residential mortgage originations, the share of shadow bankshas been steadily increasing over time.
Fig. 2 shows that the share of mortgages originated by
15Prior to the Great Recession, private nonconforming (nonagency) loans had an important market share but virtually disappeared after 2007.
The exception is the jumbo loan segment catering to high creditworthy borrowers buying expensive homes (see Keys et al., 2013 ).
16The HMDA data only allows a loan to be classified as conforming if it was sold to the GSEs in the same year as the year of loan origination.
As a result, the estimate of conforming loans based on HMDA understates the overall market share of conforming loans in the United States.
shadowbanksacrossdifferentmarkets.PanelAshowsthat amongall loansreportedin theHMDAdata, theshareof shadowbankshasincreasedfromroughly 30%in2007to 50%in2015,withthemajorityofthegrowthtakingplace after2011.
This growth in shadow banks was not confined to a specificsegment oftheresidential market.Panel Bshows thatamongconformingloans,theshadowbankshareap- proximatelydoubledfrom25%in2007to50%in2015with the majorityof the growthoccurring after 2011.Panel C, showsthatamongFHAloans,theshadowbankorigination sharegrewfromabout45%in2007to aboutan astound- ing75%in2015.Theshareofshadowbanksgrewbothin theperiodofrisingvolumesfrom2007to2009aswellas decliningvolumesfrom2010to2014.Theseaggregatedata suggesta structuralshifthastakenplace inwholendsin thismarket.17
The rise in shadow banks has coincided with a shift awayfrombrick-and-mortaroriginatorstoonlineinterme- diaries.Here,we show theextentofthisshiftinthe res- idential mortgage market. Fintech originations accounted for roughly 3% of residential loans and grew to 12% by 2015.Fig. 3,whichshowsfintech shadowbanks’ shareof
17 Online Appendix A.7 presents results for top 50 largest lenders. The difference in the samples reflects a relatively large market share of small shadow banks early in the sample that declined over time relative to large shadow banks. The decline in the share of shadow bank loans sold to affiliates ( Fig. 4 , Panel B) suggests that some of these small shadow banks sold loans to traditional banks.
(a) Traditional banks (b) Shadow banks
(c) Fintech lenders 0%
10%
20%
30%
40%
50%
60%
70%
80%
90%
100%
2007 2008 2009 2010 2011 2012 2013 2014 2015 2016 Not sold / affiliate GSE Private securizaon Bank Insurer Other
0%
10%
20%
30%
40%
50%
60%
70%
80%
90%
100%
2007 2008 2009 2010 2011 2012 2013 2014 2015 2016 Not sold / affiliate GSE Private securizaon Bank Insurer Other
0%
10%
20%
30%
40%
50%
60%
70%
80%
90%
100%
2007 2008 2009 2010 2011 2012 2013 2014 2015 2016 Not sold / affiliate GSE Private securizaon Bank Insurer Other
Fig. 4. Disposition of loans among traditional banks, shadow banks, and fintech lenders. Fig. 4 shows the percentage of originated loans by originator type sold to various entities within the calendar year of origination (including loans not sold). Panel A shows the buyer composition of traditional bank origi- nations; Panel B shows the buyer composition of all shadow bank originations; Panel C shows the buyer composition of fintech shadow bank originations.
Loans categorized as “unsold” are not sold within the calendar year of origination, although they may be sold some time later. The GSE category pools Fannie Mae, Freddie Mac, Ginnie Mae, and Farmer Mac. Calculations are based on HMDA data.
shadow bank lending, reveals that fintech shadow banks accountforasubstantialpartoftheexpansionofshadow bank lending. Fig. 3,Panel A showsthat fintech share of shadowbanklendinggrewespeciallyin2009–2013period.
Thisgrowthisinboththe conformingandFHAsegments (Fig.3,PanelsBandC).
5.2.Financingofshadowbanks
Accompanying these market share changes have been shifts in the source of traditional and shadow bank fi- nancing. Table 1, Panel B shows that between 2007 and 2015,traditional bankshaveheld morethan 30% oforig- inated mortgages, while shadow banks retain, at most, 7.5%.18 In addition to these level differences, traditional banksandshadowbanks’ financingpatterns evolvedvery differentlyovertime.Fig.4showsthetimetrendsofloan
18 The share of loans retained on the balance sheets is likely smaller.
HMDA loans not sold within the calendar year of origination are recorded as not sold. Therefore, some of “not sold” loans are likely sold in the next calendar year. In the Fannie Mae and Freddie Mac data set (which records both date of origination and date of sale), roughly 9% of shadow bank loans are sold in a year that is different from their origination year. If this
financingamongtraditionalbanks,shadowbanks,andfin- tech lenders,respectively. While private securitizationac- counted for the bulk of shadow bank purchasers precri- sis, thismarket collapsed prior tothe start ofour period of interest. At the start of our study, neither traditional nor shadowbankshadaccess tothissource offinancing.
Panel A showsthat the shareof bankloans held on bal- ance sheet hasbeen roughly stable, fluctuating from50%
in 2007 to 30% in 2012, before increasing again to 40%.
This contrasts significantly with changes in shadowbank financing.AsPanelBshows,shadowbankshavegrownin- creasinglyreliantonGSEs:in2007,only30%oftheirfund- ing camefromGSEs.By2015,nearly 50%ofshadowbank loansweresoldtoGSEsafterorigination.19
Significantchangesarealsoapparentforfintechshadow banks.AsPanelCshows,before2010,fintechlenderssold most of their mortgages to insurance companies. From 2010 onward, fintech lenders started shifting their sales
pattern holds in HMDA, this fully explains the 7.5% of not sold shadow bank originations.
19The patterns are even more striking if we focus only on the largest lenders (Online Appendix A.7).
Table 2
Time between origination and sale.
Table 2 shows the results of the time-to-sale regression for quarters between origination and sale, using Fannie Mae and Freddie Mac origination data from 2010 to 2015. Columns (1) and (2) compare shadow banks to traditional banks for the entire sample of lenders. Columns (3) and (4) compare present the results with shadow banks broken out by fintech and non-fintech lenders. Columns (5) and (6) compare fintech shadow banks to non-fintech shadow banks among the shadow bank sample only. Columns (1), (3), and (5) have quarter fixed effects and no other controls. Columns (2), (4), and (6) have borrower and loan controls and zip-quarter fixed effects. The left-hand-side variable is in quarters since origination. Its mean among all lenders is 0.46, or approximately 41 days; its mean among shadow bank lenders is 0.40, or approximately 36 days. Standard errors are clustered at the zip-quarter level; t -statistics in parentheses; ∗p < 0.05, ∗∗p < 0.01, ∗∗∗p < 0.001.
(1) (2) (3) (4) (5) (6)
Qtrs to sale Qtrs to sale Qtrs to sale Qtrs to sale Qtrs to sale Qtrs to sale
Sample All lenders Shadow banks only
Shadow bank −0.103 ∗∗∗ −0.100 ∗∗∗ – – – –
( −52.77) ( −52.67) – – – –
Non-fintech shadow bank – – −0.0812 ∗∗∗ −0.0803 ∗∗∗ – –
– – ( −39.12) ( −39.37) – –
Fintech shadow bank – – −0.180 ∗∗∗ −0.173 ∗∗∗ −0.0846 ∗∗∗ −0.0842 ∗∗∗
– – ( −63.17) ( −60.18) ( −28.21) ( −26.84)
Borrower and loan controls No Yes No Yes No Yes
Zip x Quarter FE No Yes No Yes No Yes
Quarter FE Yes No Yes No Yes No
N 4,075,985 40,71,465 4,075,985 4,071,465 1,187,390 1,185,846
R 2 0.0349 0.0491 0.0368 0.0507 0.0603 0.0931
towardGSEs,andby 2015, nearly80% ofloans originated byfintechlenderswereloansfinancedbysomeunderlying government guarantee.Overall, these results suggest that shadow banks, and fintech shadow banks in particular, grewincreasinglyreliantongovernmentguaranteesinthe form of GSEs and FHA insurance relative to traditional banks, which instead rely on government-guaranteed depositsforfunding.
In addition to differences between traditional banks andshadowbanksinhow their originatedmortgagesare ultimately financed,we alsoshow significant variation in financingpatterns,evenconditional onthemortgagesbe- ingsold.Inparticular,amongconformingloanssoldtothe GSEs,westudythelengthoftimethemortgageisheldon the originator’s balance sheet. We define Time_to_Salei jzt of borrower i of lender type j at location z at time t (in theunitofquarters)as
Time_to_Salei jzt=QuartersBetween
(
Sale,Origination)
(1) The meanTime_to_Saleis roughly40 days.Toinvesti- gate howthisvariesacrosslender types,weestimate the followingregression:Time_to_Salei jzt=
β
Typej+Xi+
δ
zt+∈i jzt, (2)whereTypej isbank,shadowbank,fintech,ornon-fintech.
Xi is a vector of loancontrols, and
δ
zt are zip-time fixed effects. The resultsin Table 2show that the time-to-sale forshadowbanksbyroughly0.10quarters(9days)shorter than time-to-sale of traditional banks. Within shadow banks, non-fintech shadowbanks’ time-to-sale is roughly 0.08 quarters (7 days) faster than traditional banks, and fintechshadowbanks’time-to-saleisroughly0.17quarters (16 days), faster than traditional banks. These results are consistent withshadowbankshavinga morelimitedbal- ance sheetcapacity than traditional banks, which resultsin a faster sale. Without additional data, it is hard to assesswhetherfintech lender’sevenfastertime is driven by technological advantages, or greater balance sheet constraints, ora combinationof both. These findings are certainlyconsistentwithFusteretal.(2018)whofindthat fintechlendersprocessmortgageapplicationsfaster.
6. Loan-leveldifferencesbetweentraditionalbanks, shadowbanks,andfintech
This section shows differences in loans and borrower characteristicsamonglendertypes.Wefirstexaminechar- acteristics ofloans andborrowerswithin andacross geo- graphic markets. Wethen study pricingandperformance differences across lender types. These facts will provide suggestiveevidenceontheroleofregulationandtechnol- ogy in the decline of traditional banks that we study in greaterdetailinfollowingsections.
6.1. Thecharacteristicsofnon-fintechandfintechshadow bankborrowersandloans
Ourfirstcutsofthedataarebasedontheideathatwe should observethe largestdecline oftraditional banksin regionswheretheirrelativedisadvantagetoshadowbanks ishighest.Sinceregulationisthemaindifferentiatingfac- tor between shadow and traditional banks, such results suggestthatthesearesectorsinwhichtheadditionalreg- ulatoryburdenofbanksishighest.
6.1.1. Descriptivestatistics
We begin our descriptive analysis by examining dif- ferencesbetweentraditional bank borrowersandshadow bank borrowers in the HMDA data. We display these differences during the expansion period, 2007–2015, as wellasthefinalyearinourdata,2015,atwhichpointthe shadowbank lending hadalready substantially expanded
(Table 3, Panel A). Compared with traditional banks, shadowbankborrowershaveapproximately$4,000lower annualincomes onaverage. This differencebecame more pronounced in the recent period, growing to $9,000 by 2015.Among shadowbankborrowers,those usingfintech firmsreportslightlyhigherincomes.
We do not observe dramatic racial differences. Rela- tivetotraditionalbanks,non-fintechshadowbankshavea roughlyequal proportionofborrowersreportingaswhite andaslightlylarger proportionofborrowersreportingto beAfricanAmerican(in2015).Racialdifferencesaremore striking between fintech and other lender types: fintech borrowersare muchmorelikely toreport“other” or“un- known” race;in2015,approximatelyonequarteroffintech borrowersdidnotreporttheirrace.Presumably,somebor- rowersmaychoosenot toreport theirrace whenlenders cannot easily observe it, especially in the context of on- linelending. The lack of reportedrace also suggeststhat anyresultsontheracialcompositionoftheborrowerpool havetobeinterpretedwithcare.
6.1.2. Borrowerandloancharacteristics
We nowframe ouranalysis withthe observationthat ifshadowbanksareengaginginregulatoryarbitrage,they should be mostactive among borrowersandgeographies where traditional banksface the greatest regulatory bur- dens. Moreover, to the extent that fintech shadow banks are exploiting technological advantages, they should be most active among those best able to use the technol- ogyandthoseforwhomthetechnologyoffersthegreatest benefits.
We analyze both individual loan-level differences within agivenmarketaswell differencesinmarket share atthegeographicallevel.Ontheindividual level,weesti- matethefollowinglinearprobabilityspecification:
Lender_Typeict=Xi
+
δ
ct+∈ict. (3) Eachobservationisaresidentialmortgageiincountyc originatedintime t.We firstestimate theregressionfirst onthesampleofallresidentialloans,whereLender_Typeict is an indicator variable takingthe value 100 if the orig- inator is a shadow bank, and 0 otherwise, meaning the coefficients are in units of percentage points. We next estimate theregressiononlyamongshadowbankloansin whichcaseLender_Typeict isan indicatortakingthevalue 100 iftheoriginatorisafintechshadowbank,and0oth- erwise.Xiisavectorofborrowerandloancharacteristics, suchasborrowerincome,race,loanpurpose,orloantype.Bothspecificationsincludecounty xtime fixedeffects
δ
cttocompareborrowerswithinamarketatthesametime.
We estimate these specifications separately using HMDA data and Fannie Mae and Freddie Mac data. The broaderHMDAdatagivesinsightintotheoverallmortgage market over certain characteristics such asborrower race andloanfinancing.ThenarrowerFannie andFreddiedata are limitedtoFRMloansbutcontainmoredetailedcredit informationandloanterminformation.
Whiletheabovespecificationprovidesinsightatthein- dividuallevelwithinagivenmarket,wealsostudymarket- level differences at the county level. Fig. 5 shows sig- nificant heterogeneity in the county-level shadow bank penetration in2015, ranging from lessthan 10% to more than 80%.Itisthesedifferencesthat thissection seeksto
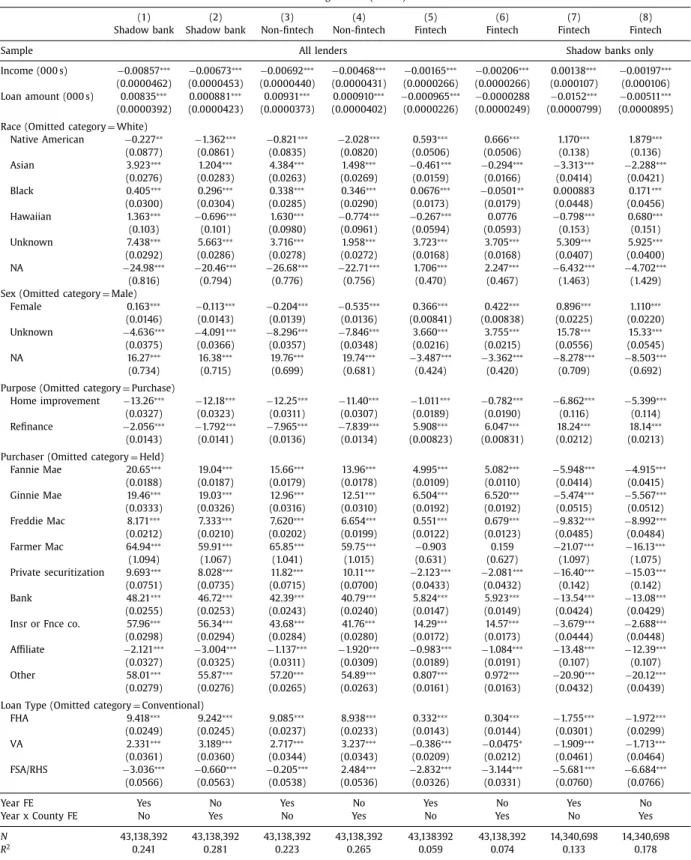
Table 3
Shadow bank, fintech presence, and the borrower and loan characteristics: all loans.
Table 3 presents descriptive statistics for borrowers and loans by lender type. Panel A summarizes differences in borrower demographics in accepted mortgage applications as reported in the HMDA data. Columns (1)–(4) compare cover the period 2007–2015. Columns (5)–(8) cover the 2015. Columns (1) and (2) and (5) and (6) compare traditional and shadow banks; Columns (3) and (4) and (7) and (8) compare non-fintech and fintech shadow banks. Panel B shows the result of Eq. (3) , a linear probability model regressing whether the lender is a shadow bank, Columns (1) and (2); a non-fintech shadow bank, Columns (3) and (4); a fintech lender among all lenders, Columns (5) and (6); or a fintech lender among shadow banks, Columns (7) and (8), on borrower characteristics over the period 2007–2015. Odd columns include year fixed effects. Even columns include year-county fixed effects. For race dummies, the base category is White; for sex dummies, the base is Male. For loan purpose dummies, the base is Purchase. For purchaser dummies, the base is Not sold.
For type dummies, the base is Conventional. Coefficients are in percent. Standard errors (in parentheses) are clustered at the county-year level; t -statistics in parentheses; ∗p < 0.05, ∗∗p < 0.01, ∗∗∗p < 0.001.
Panel A : summary statistics based on (HMDA)
2007–2015 2015
Traditional banks Shadow banks Shadow banks Traditional banks Shadow banks Shadow banks
Non-fintech Fintech Non-fintech Fintech
Count 30,943,694 15,487,438 12,575,694 2,911,744 2,300,721 2,182,654 1,670,680 511,974 Median income $83,0 0 0 $79,0 0 0 $78,0 0 0 $82,0 0 0 $89,0 0 0 $80,0 0 0 $79,0 0 0 $82,0 0 0
Male 66.98% 67.61% 68.94% 61.87% 65.64% 65.94% 69.01% 55.92%
Race
Native American 0.52% 0.50% 0.50% 0.50% 0.59% 0.57% 0.56% 0.62%
Asian 5.21% 5.79% 6.09% 4.50% 5.63% 5.50% 5.79% 4.55%
African American 4.72% 5.59% 5.85% 4.48% 4.83% 6.34% 6.80% 4.86%
Native Hawaiian 0.36% 0.42% 0.43% 0.34% 0.36% 0.45% 0.49% 0.33%
White 78.04% 76.47% 77.76% 70.90% 77.10% 74.93% 78.17% 64.38%
Other/Unknown 11.15% 11.23% 9.36% 19.27% 11.49% 12.19% 8.19% 25.26%
Loan purpose
Home improvement 6.34% 0.68% 0.78% 0.22% 9.80% 1.14% 1.35% 0.47%
Refinancing 60.40% 52.69% 47.26% 76.13% 44.67% 47.44% 40.87% 68.88%
(continued on next page)
Table 3 (continued)
Panel B : regressions (HMDA)
(1) (2) (3) (4) (5) (6) (7) (8)
Shadow bank Shadow bank Non-fintech Non-fintech Fintech Fintech Fintech Fintech
Sample All lenders Shadow banks only
Income (0 0 0 s) −0.00857 ∗∗∗ −0.00673 ∗∗∗ −0.00692 ∗∗∗ −0.00468 ∗∗∗ −0.00165 ∗∗∗ −0.00206 ∗∗∗ 0.00138 ∗∗∗ −0.00197 ∗∗∗
(0.0 0 0 0462) (0.0 0 0 0453) (0.0 0 0 0440) (0.0 0 0 0431) (0.0 0 0 0266) (0.0 0 0 0266) (0.0 0 0107) (0.0 0 0106) Loan amount (0 0 0 s) 0.00835 ∗∗∗ 0.0 0 0881 ∗∗∗ 0.00931 ∗∗∗ 0.0 0 0910 ∗∗∗ −0.0 0 0965 ∗∗∗ −0.0 0 0 0288 −0.0152 ∗∗∗ −0.00511 ∗∗∗
(0.0 0 0 0392) (0.0 0 0 0423) (0.0 0 0 0373) (0.0 0 0 0402) (0.0 0 0 0226) (0.0 0 0 0249) (0.0 0 0 0799) (0.0 0 0 0895) Race (Omitted category = White)
Native American −0.227 ∗∗ −1.362 ∗∗∗ −0.821 ∗∗∗ −2.028 ∗∗∗ 0.593 ∗∗∗ 0.666 ∗∗∗ 1.170 ∗∗∗ 1.879 ∗∗∗
(0.0877) (0.0861) (0.0835) (0.0820) (0.0506) (0.0506) (0.138) (0.136) Asian 3.923 ∗∗∗ 1.204 ∗∗∗ 4.384 ∗∗∗ 1.498 ∗∗∗ −0.461 ∗∗∗ −0.294 ∗∗∗ −3.313 ∗∗∗ −2.288 ∗∗∗
(0.0276) (0.0283) (0.0263) (0.0269) (0.0159) (0.0166) (0.0414) (0.0421) Black 0.405 ∗∗∗ 0.296 ∗∗∗ 0.338 ∗∗∗ 0.346 ∗∗∗ 0.0676 ∗∗∗ −0.0501 ∗∗ 0.0 0 0883 0.171 ∗∗∗
(0.0300) (0.0304) (0.0285) (0.0290) (0.0173) (0.0179) (0.0448) (0.0456) Hawaiian 1.363 ∗∗∗ −0.696 ∗∗∗ 1.630 ∗∗∗ −0.774 ∗∗∗ −0.267 ∗∗∗ 0.0776 −0.798 ∗∗∗ 0.680 ∗∗∗
(0.103) (0.101) (0.0980) (0.0961) (0.0594) (0.0593) (0.153) (0.151) Unknown 7.438 ∗∗∗ 5.663 ∗∗∗ 3.716 ∗∗∗ 1.958 ∗∗∗ 3.723 ∗∗∗ 3.705 ∗∗∗ 5.309 ∗∗∗ 5.925 ∗∗∗
(0.0292) (0.0286) (0.0278) (0.0272) (0.0168) (0.0168) (0.0407) (0.0400)
NA −24.98 ∗∗∗ −20.46 ∗∗∗ −26.68 ∗∗∗ −22.71