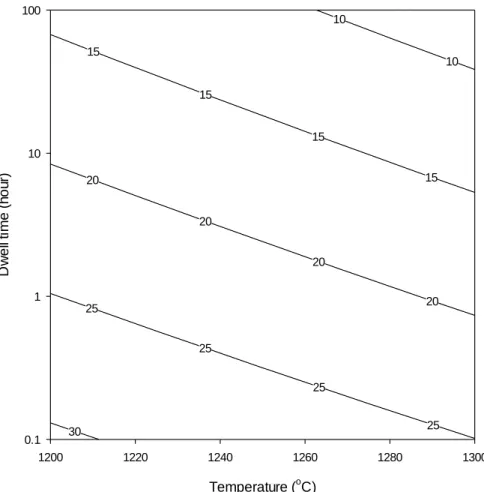
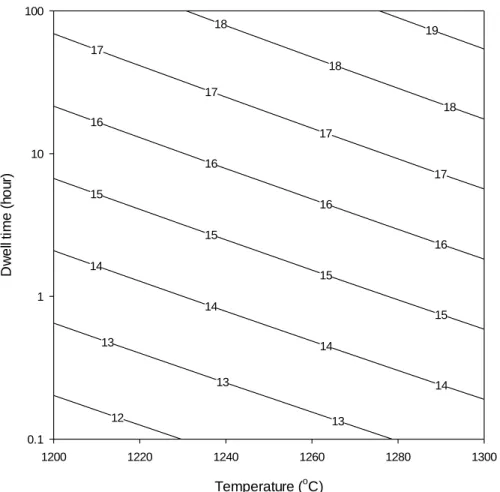
The quartz dissolution kinetics as a function of temperature, log-dwell time, (a) average value regardless of the effect of the heating rate, (b) shows the scattered data as a function of the heating rate. The regression equations are shown in Table VI). Silica level in the glass phase (UMF) of porcelain samples fired at different temperatures, residence times and heating rates. The regression equations are shown in Table VII). Apparent bulk density as a function of heating rate for residence times of (A) 0.1 h and (B) 3.2 h.
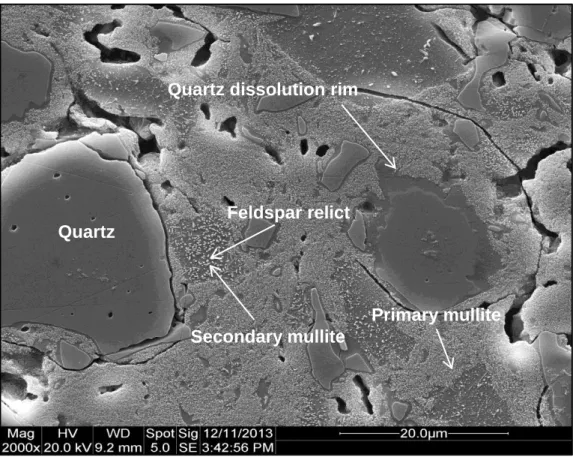
The amount of glass content as a function of temperature and residence time (regardless of heating rate). SEM micrographs showing the microstructure of sintered porcelain body for quartz particles (left) and mullite needles (right). The heating conditions are indicated below the figures.).
INTRODUCTION
To determine the variable of temperature, residence time and heating rate, on compaction and mineralogy, an extensive experimental matrix was implemented. The results clearly indicate that rapid fire behavior is consistent with conventional fire if evaluated using a log-time perspective. The aim of this work is to measure the densification behavior and mineralogical evolution of a commercial porcelain body over a wide range of temperatures, residence times and heating rates spanning both conventional and "rapid fire" cycles by measuring the apparent bulk density. , true density and mineralogy.
LITERATURE REVIEW
- Whiteware
- Mineralogy
- Mullite formation
- Quartz dissolution
- Glass formation boundary
- Porcelain glass chemistry
- Densification in porcelain
- Development of fast firing schedule
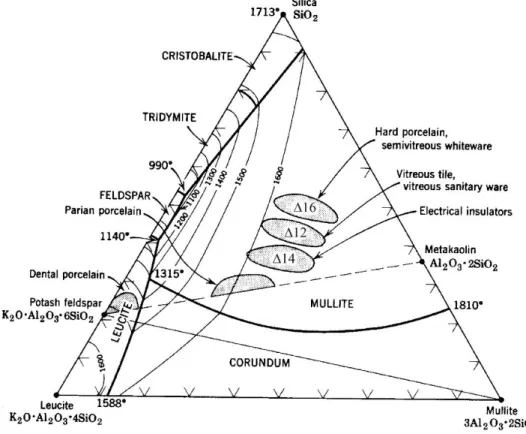
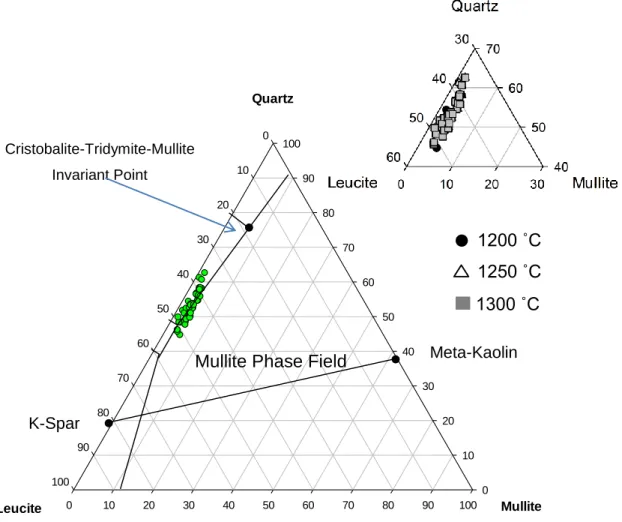
Furthermore, it has been proposed that the compositions of the glassy phase are located at "the glass formation boundary" in the flux-alumina-silica system over the temperature ranges of C.16, 21 The amount of alumina dissolved in the glass phase can be precisely determined by the amount flux presented in the porcelain body. However, the glass chemistry changes with quartz dissolution with increased silica in the glass phase. Other works have suggested that the interactions with raw materials, in the rapid firing process, are significantly reduced by an increased heating rate.
47, 48 The viscosity of the glass phase in a porcelain body is quite high, negating the contribution of surface tension and that surface tension can be considered constant due to the relatively small change in glass chemistry during firing. The rapid firing process has been used in the tile industry for over 30 years.
EXPERIMENTAL PROCEDURE
- Green samples preparation
- Rapid firing apparatus
- Fired samples characterization
- Microstructure analysis
- Mullite crystallite size calculated by Debye-Scherrer's equation
Dissolution kinetics of quartz as a function of temperature, residence time, (a) average value regardless of heating rate effect, (b) showing scatterplot as a function of heating rate. The regression equations are presented in Table V). Steps involved in the silica level in calculating the glass phase of the porcelain sample* Fired at 1200°C, 3.2 h residence time regardless of heating rate. In other words, the increase in glass content is a function of quartz dissolution (ie, increasing the level of silica in the glass phase), but without increased densification.
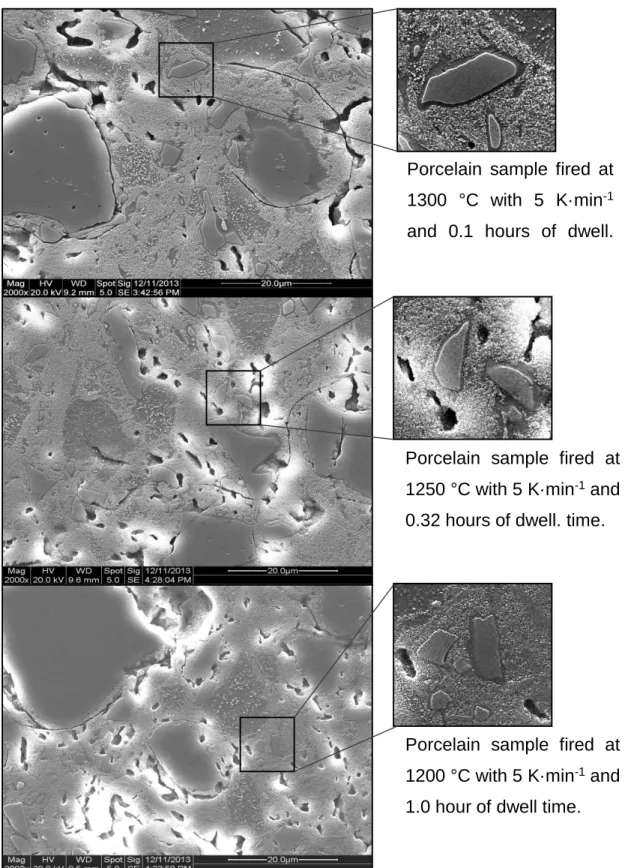
It is clear that the quartz dissolution rim thicknesses of the three samples are very similar. The result was consistent with the level of undissolved quartz being independent of heating rate.).
RESULTS AND DISCUSSION
Mineralogy
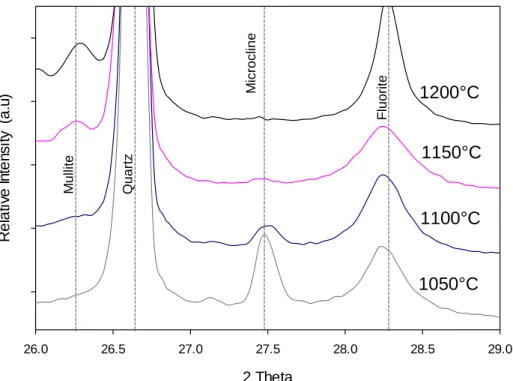
- Feldspar reaction
- Mullite formation
- Mullite crystallite size
- Quartz dissolution
- Silica level in the glass phase
- Mullite crystallite coarsening versus glass chemistry
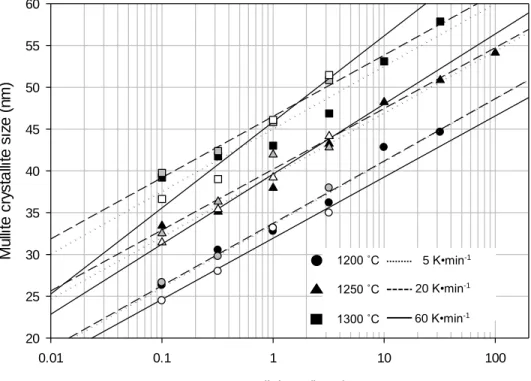
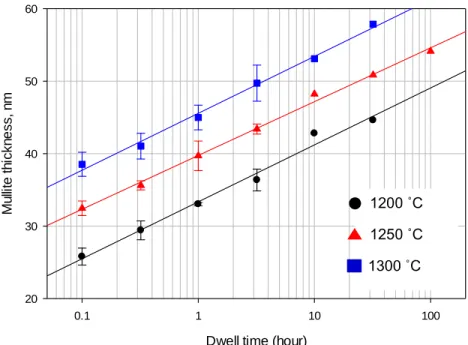
The amount of mullite expected to form based on the glass formation limit is therefore the measured values are within the range of the predicted levels. A previous study was conducted by Juthapakdeepasert who suggested that mullite crystallite oriented in the [110] plane coarsened as a function of temperature and residence time.4 However, it was not reported whether the mullite crystallite size coarsened as a result of the effect of heating rate. , this study investigated the effect of the temperature, residence time and heating rate on mullite crystallite enlargement. Temperature and residence time were observed to be the major contributors to the mullite crystallite size increase compared to the heating rate.
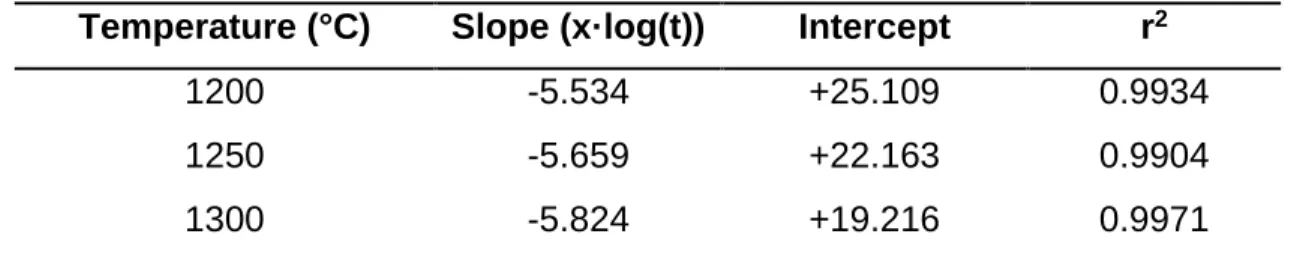
Statistical analysis was performed to confirm the effect of temperature, residence time, and heating rate. Mullite crystallite size as a function of temperature and residence time Temperature (°C) Slope (x·log(t)) Section r2. It can be seen that the glass formation limit is independent of temperature, residence time and heating rate in the temperature range C.
In addition, the density of the glass phase with the quartz solution data can be calculated by comparing the calculated density with the true density data. Apparent bulk density as a function of residence time showing a strong dependence on residence temperature and a slight but measurable dependence on heating rate. It is suggested that increasing temperature and residence time results in an increase in the glass content within the porcelain matrix (Figure 30a).
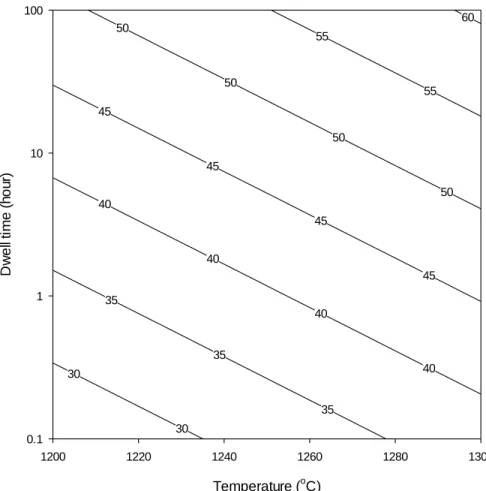
Plot of dissolution rim thickness as a function of heating rate (Samples fired at 1300 °C, 3.2 h dwell). A summary of the three-factor univariate general linear model comparison (p<0.05), (a) quartz dissolution, (b) mullite formation, and (c) mullite crystallite thickening. Calculation of mullite crystallite size as a function of temperature and residence time at a heating rate of 5 K·min-1.
Calculation of mullite crystallite size as a function of temperature and residence time at a heating rate of 20 K·min-1. Calculation of mullite crystallite size as a function of temperature and residence time at a heating rate of 60 K·min-1.
Validation of glass formation boundary
Densification
- Skeletal or "True" Density
- Calculated Density Based on Mineralogy
- Measured Apparent Bulk Density by Immersion
- Glass Content on Porcelain Body Densification
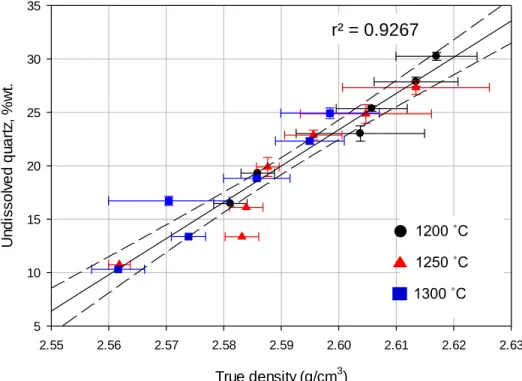
Since the amount of mullite is constant, the true density decreases slightly with increasing temperature and time due to the dissolution of quartz into the glass phase due to the density difference between quartz and glass. Previous work reported a glass density of g·cm-3.69 Once the feldspar reaction and mullite formation is complete, observed in this study to be above 1200°C, the true density is expected to be nearly constant but decrease with quartz dissolution. Statistical analysis supports the conclusion that true density is independent of heating rate in the range of this study.
The actual density decreased with increasing quartz solution (via residence temperature and time, regardless of heating rate). The glass phase density as a function of residence time for all heat treatment conditions, calculated by comparing the measured mineralogy with the measured true density via the rule of mixtures. The data points were grouped by baking temperature and residence time for the three heating rates (grouped) and the range is reflected in the error bars on the x-axis.
From these data it is clear that the true density can be reasonably predicted from the mineralogy, potentially eliminating the need for true density measurements in the future. Higher sand density values are observed in samples with higher undissolved quartz levels (ie, generally lower residence temperatures and shorter residence times). Apparent bulk density, measured using an immersion technique, is shown in Figure 26 as a function of residence time for the various heat treatment conditions.
Although the glass content increased, the apparent bulk density/true density ratio remained constant, indicating a constant level of closed porosity (Figures 29 and 30a). This result is consistent with the previous study showing the glass content required to achieve the maximum apparent bulk density. The standard deviation of the required glass content is calculated based on samples showing complete densification.
Microstructural Analysis
SEM micrographs of porcelain samples fired at different heating rates, residence times, and temperatures to demonstrate the similarity of the quartz solution edge thickness.
CONCLUSIONS
It has been suggested that rapid calcination is limited by the heating rate due to heat transfer, but this was not observed in this study, as mullite formation and quartz dissolution are independent of heating rate. In contrast, densification shows a heating rate-dependent phenomenon consistent with a viscous deformation model for densification. Therefore, in this study, it can be concluded that flash firing processes are not limited by heat transfer due to the discrepancy of the three results.
These results provide a new matrix for the design of porcelain bodies that allows prediction of the mullite, glass and residual quartz levels to potentially tailor the fired porcelain properties. A porcelain body can be fired over a wide range of temperatures and residence times and the firing cycle optimized to achieve the desired mineralogy and the glass level required for densification.
FUTURE WORK
Furthermore, the MSC model has been successfully applied to many of the ceramic oxides, such as ZnO,73, 74 Al2O3,73 and Al2O3+5% ZrO2.73 However, little attention has been paid to the studies on the formulation of MSC for porcelain.
Carty, "Glass Phase Composition in Porcelains and Correlation with Firing Temperature," in Proceedings of the 106th Annual Meeting and Exposition of the Ceramic Society of America, April Indianapolis, Indiana, USA, 2004. Mörtel, "Effect of Processing Parameters on the Properties of Rapidly Fired Porcelain," Materials Science Research, Vol. 34; The influence of talc and chlorite on the sintering and technological behavior of porcelain ceramic tiles," Silic.
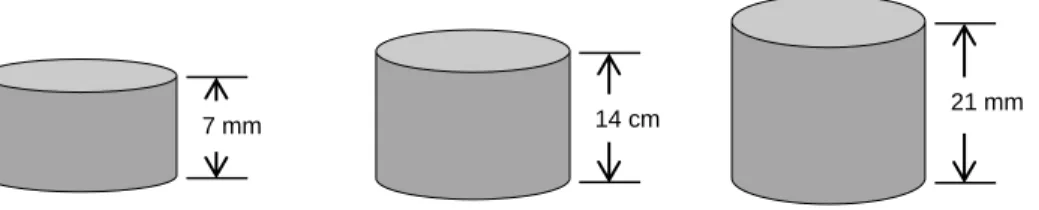
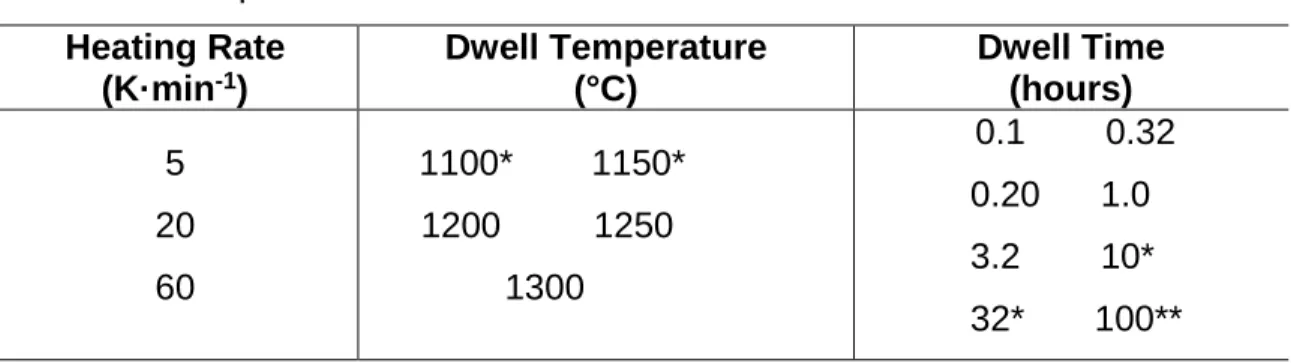
Guarini, "The effect of soda-lime glass on the sintering and technological properties of porcelain stoneware tiles." The different firing conditions were selected to study thermal equilibration, including peak temperatures of 1,200 and 1,250 ˚C, 0.1 h residence time, and 5, 20, and 60 K·min-1 heating rates. These firing conditions represent the most critical conditions that can lead to thermal gradient in the samples.
The result of the ink test revealed that the optimum thickness of the samples was 7 mm. Due to the complex interaction of the experimental procedure, a statistical analysis of the normally distributed data sets using a three-way General Linear Model (GLM)†† with a significance level of p<0.05 was performed to identify significant factor effects and interactions between factors on quartz dissolution and mullite formation. In this study, all data sets were assumed to follow a normal distribution (data sets were tested for normality using the Anderson-Darling test) and the three factors of the general linear model used a 95% significance level, as summarized in Table XII.
The analysis of the general linear model showed that the dissolution of quartz was significantly influenced by the factors of residence time (p=0.000) and temperature (p=0.000), but insignificantly by the factor of the heating rate (p=0.517). In contrast, the result of mullite formation showed that there was no statistical correlation between mullite level, temperature, residence time and heating rate at a p-value of 0.05 with r2 = 0.00. This statistical result supports previous studies showing that mullite is independent of temperature, holding time, and heating rate when the holding temperature is above 1200 °C.
Summary of three-factor univariate overall linear model comparison (p<0.05) of density versus true density. SEM micrographs showing that the quartz dissolution margin is independent of particle size and heating rate for similar quartz dissolution rates.