Acetylcholine Receptors
Thesis by Crystal N. Dilworth
In Partial Fulfillment of the Requirements for the degree of
Doctor of Philosophy
CALIFORNIA INSTITUTE OF TECHNOLOGY Pasadena, California
2014
(Defended Nov. 21st 2013)
2014 Crystal N. Dilworth All Rights Reserved
To the many people who contributed to the creation of this thesis,
Thank you. Thank you for your love, support, compassion, and understanding. So many of you were there to encourage me along this path, and without you I might have lost my way. It is said that “it takes a village to raise a child”, and it truly has taken a whole community of caring people to make this thesis possible. All of you, possibly
unknowingly, were instrumental in this achievement.
Thank you for helping me to become myself.
Neuronal nicotinic acetylcholine receptors (nAChRs) are pentameric ligand gated ion channels abundantly expressed in the central nervous system. Changes in the
assembly and trafficking of nAChRs are pertinent to disease states including nicotine dependence, autosomal dominant nocturnal frontal lobe epilepsy (ADNFLE) and Parkinson’s disease (PD). Here we investigate the application of high resolution fluorescence techniques for the study of nAChR assembly and trafficking. We also describe the construction and validation of a fluorescent α5 subunit and subsequent experiments to elucidate the cellular mechanisms through which α5 subunits are
expressed, assembled into mature receptors, and trafficked to the cell surface. The effects of a known single nucleotide polymorphism, D398N, in the intracellular loop of α5 are also examined
Additionally, this report describes the development of a combined total internal reflection fluorescence (TIRF) and lifetime imaging (FLIM) technique and the first application of this methodology for elucidation of stochiometric composition of nAChRs.
Many distinct subunit combinations can form functional receptors. Receptor composition and stochiometry confers unique biophysical and pharmacological properties to each receptor sub-type. Understanding the nature of assembly and expression of each receptor subtype yields important information about the molecular processes that may underlie the mechanisms through which nAChR contribute to disease and addiction states.
Acknowledgements ... iii
Abstract ... iv
Table of Contents ... v
Introduction ... 1
Chapter I: Construction of a Fluorescent α5 Subunit ... 4
Chapter II: Investigation into miR-346 Regulation of the nAChR α5 Subunit ... 15
Chapter III: Expression of α5-mEGFP in Mouse Cortical Neurons ... 22
Chapter IV: Determination of nAChR stoichiometry using NFRET ... 31
Chapter V: TIRF-FLIM-FRET: Engineering a Technique for High Resolution Detection of nAChR of nAChR Composition and Stoichiometry ... 43
Chapter IV: Conclusions ... 57
Appendix i: Plasmid maps ... 61
PCR Protocols ... 62
Appendix ii: Transfection Protocols ... 63
N2a Cells for Fluorescence Imaging (Expressfect) ... 63
N2a Cells for Differentiation and HEK293-T (Lipofectamine 2000) .... 64
Neuronal Transfection Non-optimized ... 65
Neuronal Transfection Optimized ... 66
Maintenance of Neuronal Cultures ... 67
Imaging Settings ... 69
Appendix iii: Image work-up for NFRET Experiments ... 70
Statistical Analysis: t-test α4 vs. α4β2 Total NFRET Pixels ... 72
Statistical Analysis: t-test α5α4 vs. α5α4β2 Total NFRET Pixels ... 73
Statistical Analysis: t-test α5α4 vs. α5α4β2 Mean Cell Values ... 74
Bibliography ... 75
A B
Introduction
Nicotinic Acetylcholine Receptors (nAChRs) are ligand gated ion channels found in both the peripheral and central nervous systems. These receptors can be activated by nicotine as well as their native ligand acetylcholine and have been associated with several health-related phenomena. Nicotine is the major addictive component of tobacco, and chronic tobacco use (smoking) has been implicated in many types of cancer as well as heart disease. Other related phenomena include an inverse correlation between smoking and Parkinson's disease and the observation that patients with autosomal dominant nocturnal frontal lobe epilepsy (ADNFLE) who smoke have fewer seizures [1].
Nicotinic acetylcholine receptors belong to the Cys-loop family of ionotropic receptors.
Individual subunits consist of an extracellular domain (ECD), four α-helical transmembrane domains, and an intracellular loop between the M3 and M4 transmembrane domains. Agonists such as acetylcholine and nicotine bind to the ECD; as a result, the pore opens and cations flow according to their electrochemical gradient.
Figure 1 [2]
A. View of an assembled nAChR from the extracellular surface.
Individual subunits are indicated by shading: α4 and β2. The auxiliary position can be occupied by α5.
B. Side view of the receptor.
E and I designate extracellular and intracellular regions respectively. The I regions vary markedly in size and sequence among subunits, and in this view are only partially resolved.
nAChRs found in muscle are composed of two α and one β, γ (or ε) and δ subunits [2- 3]. Neuronal nAChRs are composed of α2-α11 and β2-β4 subunits and assemble in α and β or α only pentamers. The neuronal α4β2 receptor subtype is one of the two most abundant nAChRs in the central nervous system (CNS). Two α4β2 pentameric stoichiometries are reported: (α4)3(β2)2 and (α4)2(β2)3 [4-5]. The latter stoichiometry displays a higher sensitivity to nicotine than most other neuronal nAChRs. The subunit stoichiometry of nAChRs is important in determining its pharmacology, stability, and subcellular location.
Perturbations to these properties contribute to the development of disease or dependence states. ADNFLE is a very rare monogenic disease of α4β2 nAChRs. The study of ADNFLE has yielded important information about nAChR stoichiometry. Point mutations associated with ADNFLE shift α4β2 stoichiometry to (α4)3(β2)2 [6]. This apparently affects the trafficking and pharmacology of the receptor by shifting localization to the plasma membrane (PM) and decreasing sensitivity to ACh. Nicotine use leads to reduced seizures in ADNFLE patients [1]. We know that in mammalian cells nicotine acts as a pharmacological chaperone to overcome the point mutation bias and shift stoichiometry towards (α4)2(β2)3. Thus, ADNFLE provides a relatively simple model of how changes in α4β2 stoichiometry and trafficking contribute to disease [6].
Nicotine dependence is more complex than ADNFLE, although selective upregulation of (α4)2(β2)3 receptors is certainly involved. Several brain regions express α4, α5 and β2 subunits and assemble α4β2α5 receptors including the substantia nigra pars compacta, subthalamic nucleus, medial habenula, prefrontal cortex, and hippocampus [7]. Receptors containing α5 also play a part in nicotine self-administration and nicotine withdrawal [8- 9]. These receptors are also important for dopamine release and attention tasks [7, 10-11].
The α5α4β2 receptors are more permeable to Ca2+ than α4β2 receptors and have a higher sensitivity to nicotine [12]. Relative to (α4)3(β2)2, the α5α4β2 receptor exhibits a higher sensitivity to acetylcholine (ACh), has increased Ca2+ permeability and may be resistant to upregulation by nicotine [13-14]. The α5 subunit does not participate in functional agonist binding sites, and it may serve as an auxiliary subunit that modulates nAChR function when coassembled with other α and β subunit isoforms (see figure 1).
nAChRs containing the α5 subunit are especially interesting because genome wide association studies and candidate gene studies have identified polymorphisms in the α5 gene that are linked to an increased risk for nicotine dependence, lung cancer, and/or alcohol addiction [15-17]. We have chosen to examine the only known coding-region polymorphism. The single nucleotide polymorphism (SNP), rs16969968, encodes an aspartic acid to asparagine mutation at position 398 in the flexible, intracellular loop that connects two transmembrane domains (the M3-M4 loop) of the human α5 protein. This mutation, α5D398N, is of interest because of its association with increased risk for nicotine dependence [18]. It was hypothesized that the M3-M4 loop localization of the D398N mutation may contribute to changes in intracellular trafficking or localization of the mutant protein. Live-cell high resolution fluorescence microscopy techniques have been used to study changes to α4β2 receptor stoichiometry, trafficking and pharmacology. We proposed to use similar techniques to examine behavior of this receptor after inclusion of an α5 or α5D398N subunit.
Chapter One
Construction of a Fluorescent α5 Subunit
The significance of the α5 containing nAChR receptor (α5* receptor) has been a challenging question for researchers since its characterization by Role et al. in 1996 [19].
Elucidation of the unique contribution of the α5 subunit is complicated by several factors including the lack of α5 specific pharmacological agents. As an accessory subunit, α5 does not participate in ligand binding, making it difficult to selectively activate or block α5*
receptors. This challenge, combined with the similarity in EC50 and dose response to agonist of α5* receptors to its parent receptors α4β2or α3β4,and the lack of a reliably α5- specific antibody, increases the difficulty in isolating a pure population of α5* receptors for detailed analysis [7, 13, 20]. Lester et al. has demonstrated that individual nAChR subunits can be labeled with fluorescent proteins for detection of individual subunit expression using live cell, fluorescence microscopy [21]. Using a combination of fluorescence confocal microscopy, total internal reflection fluorescence (TIRF) microscopy and advanced fluorescence techniques, such as Försters resonance energy transfer (FRET), it is possible to detect changes in membrane expression, trafficking, and receptor complex formation of fluorescent nAChRs [6, 22-23]. We hypothesized that selective labeling of an α5 subunit would be possible for detection and observation of α5* receptor populations.
The mouse Chrna5 gene with partial 5’ and 3’ untranslated regions (UTR), as well as the mouse Chrna5 genes with D/N mutation and partial 5’ and 3’ UTRs were generously provided by Dr. Jerry Stitzel at the University of Colorado Boulder. These genes were subcloned into pcDNA3.1(+) mammalian expression vectors. Chrna5 is heavily enriched
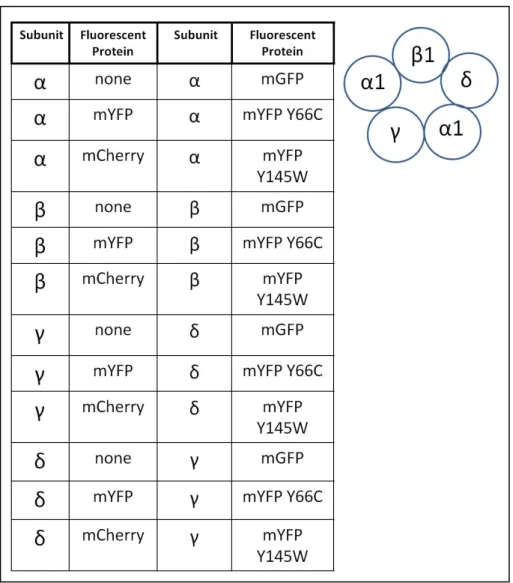
for guanine and cytosine nucleotides in the 5’ region, making polymerase chain reaction (PCR) extension of the entire gene difficult. Many efforts were made to optimize the PCR protocol for efficient and consistent extension of the entire gene. Those optimized methods are reported in appendix i. Several pcDNA3.1(+) constructs containing variations of the Chrna5 gene with and without UTRs were constructed and are listed in table 1.
The nAChR M3-M4 loop is a preferred location for insertion of fluorescent protein (FP) tags [21-22]. It has been inferred from studies of other nAChR subunits that M3-M4 loop localized FP labels do not interfere with formation of the receptor complex, intracellular trafficking, or function of nAChRs [21]. Sequence alignment of mouse nAChR M3-M4 loops revealed that α5 contains the shortest loop (50 amino acids), and concerns were raised that the insertion of a ~ 200 amino acid fluorescent protein such as GFP would produce steric interference, preventing efficient incorporation of the labeled subunit into a receptor complex or the proper trafficking of an α5*-FP receptor to the plasma membrane. Consequently, several variants of α5-FP fusion products were constructed (see table 1).
Building on previous work by Lester et al., monomeric enhanced green fluorescent protein (mEGFP) was selected as the FP for insertion into the α5 gene. mEGFP exhibits enhanced fluorescence over wild-type GFP (wtGFP) and also contains an alanine-to-lysine mutation at position 206 that prevents multimerization of GFP molecules [24-25]. These modifications make mEGFP more compatible with biological imaging experiments and FRET analysis. Two intrasubunit locations for mEGFP were selected within the α5 M3-M4 loop.
Table 1
These locations were chosen due to their distance from the position of the identified SNP (amino acid 397 in the mouse protein, 398 in the human) and from identified trafficking motifs (see figure 1.1) [23, 26]. A flexible linker of alanine and glycine (A-G-A or G-A-G) was included with the inserted mEGFP sequence. Other α5-mEGFP fusion constructs with the mEGFP sequence fused to the c-terminal region of the α5 sequence
were also constructed using overlap PCR. Table 2 comprehensively displays all of the α5- mEGFP variants that have been used experimentally throughout the duration of this project.
Figure 1.1
Schematic of the nAChR α5 subunit.
1.1A shows the amino acid sequence of the α5 M3-M4 loop. Asterisk indicates position 358, one of the two intracellular loop locations for mEGFP insertion.
1.1B Shows an alternative view of the α5 subunit, showing helical transmembrane domains and mEGFP barrel in the M3-M4 loop region (not to scale).
Table 2
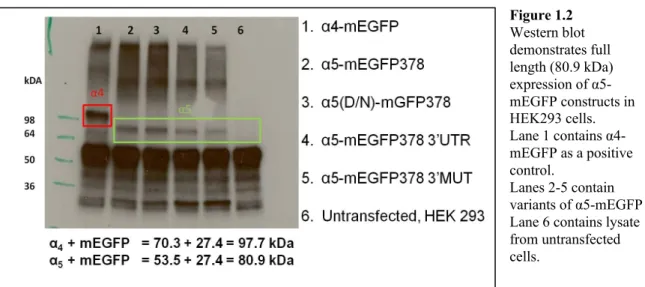
Full length expression of the α5-mEGFP fusion constructs was verified using Western blot. α5-mEGFP constructs were expressed in either HEK293 or HEK293-T cells and immunoprecipitated using a mouse anti-GFP antibody. Extracts were then separated by gel electrophoresis and blotted with a rabbit anti-GFP primary and goat anti-GFP-HRP secondary antibodies for visualization. Resultant bands were then compared to an expressed α4-mEGFP control (see figure 1.2).
Figure 1.2 Western blot demonstrates full length (80.9 kDa) expression of α5- mEGFP constructs in HEK293 cells.
Lane 1 contains α4- mEGFP as a positive control.
Lanes 2-5 contain variants of α5-mEGFP Lane 6 contains lysate from untransfected cells.
Next, α5-mEGFP constructs were assayed for fluorescence (see figure 1.3). Many of the fusion proteins were expressed in both N2a and HEK293 cell lines. N2a or HEK293 cells were transiently transfected with α5-mEGFP, α4, and β2 subunits and assayed for fluorescence using confocal microscopy. Fluorescence levels for all of the α5-mEGFP constructs were consistently low when compared to α4-mEGFP and β3-mYFP controls.
This lack of expression was a consistent challenge moving forward with investigations using these constructs. However, α5-mEGFP387, a DNA construct lacking the 5’ and 3’
UTR regions, with A-G-A and G-A-G flanking linker sequences, and with the mEGFP inserted at position 378 was ultimately chosen as the optimum construct for use in future experiments.
Figure 1.3A
Images of N2a cells expressing fluorescent nAChR constructs and a red fluorescent plasma membrane marker PM-mCherry. Images were taken 24 h post-transfection with a scanning confocal microscope after sample excitation with 488 nm laser. Images 1, 2, and 10 display images of HEK293 cell expressing α4-mEGFP or β3-mYFP as positive controls for relative expression. Images 3 – 9 show the low relative fluorescence of the α5-mEGFP constructs.
Figure 1.3B
Images of HEK293 cells expressing fluorescent nAChR constructs and a red fluorescent plasma membrane marker PM-mCherry. Images were taken 24 h post-transfection with a scanning confocal microscope after sample excitation with 488 nm laser. Images 1, 2, and 10 display images cells expressing α4-mEGFP or β3- mYFP as positive controls for relative expression. Images 3 – 9 show the low relative fluorescence of the α5- mEGFP constructs.
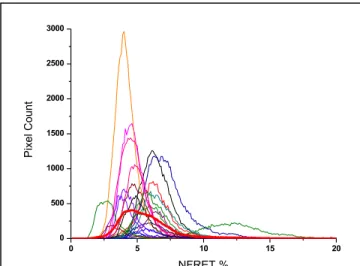
Intracellular assembly of α5-mEGFP378 (α5-mEGFP) with α4 and β2 subunits to form an α4β2α5-mEGFP receptor was evaluated using normalized Försters resonance energy transfer (NFRET). NFRET uses the distance dependence of energy transfer between a donor and acceptor fluorophore to measure interactions between proteins. Attention is paid to the theory of FRET and NFRET in chapter 4. FP labeled α4 and/or β2 subunits were co-expressed in N2a cells, and NFRET measurements were performed. In this case the α5-mEGFP acted as the FRET donor, and a red fluorescent protein, mCherry, labeling the α4 subunit, functioned as the FRET acceptor (see chapter 4) [6, 23, 26]. Low incidence of expression of the α5-mEGFP (15%) made finding cells expressing both α5-mEGFP and α4-mCherry at levels sufficient for FRET signal detection challenging, but we are able to demonstrate intracellular association of α5-mEGFP and α4-mCherry when co-expressed with β2 in transiently transfected N2a cells (figure 1.4).
Figure 1.4
23 individual cell histograms of NFRET positive pixels in images of HEK293 cells expressing α5- mEGFP378, α4-mCherry, and β2 subunits. Bolded histogram describes the average of all 23 cells.
Boxes on the right display sample images of an HEK293 cell expressing α5-mEGFP378, α4-mCherry, and the associate NFRET values illustrated as a heat map of expression intensity.
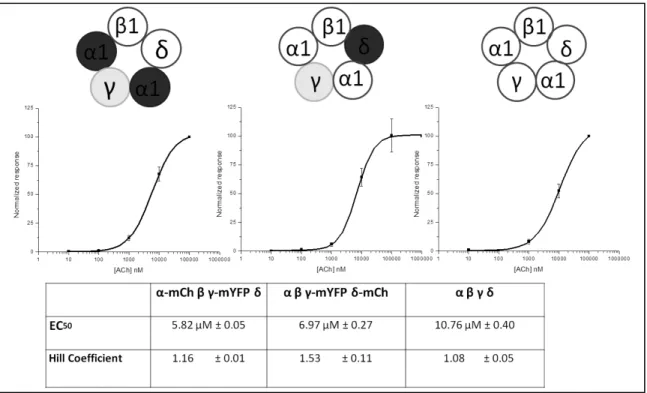
Within the cell nAChRs, like other receptor complexes, are synthesized and assembled in the endoplasmic reticulum (ER). Once assembled, the complete pentameric complex is trafficked to the plasma membrane (PM) for insertion. It is understood that only complete nAChR pentamers reside in the PM. Functional response of α5-mEGFPα4β2 receptors to agonist would confirm proper synthesis, incorporation, and trafficking of α5- mEGFPα4β2 receptors. Electrophysiology on Xenopus oocytes expressing α5α4β2 receptors was performed in collaboration with Chris Marotta, and some results are reported in Marotta et al. [20]. Both α5α4β2 and (α4)2(β2)3 have a similar dose response to acetylcholine (ACh), and no pharmacological agents for selective activation of α5 receptors have yet been reported.
Mutation of a conserved leucine (L) at the 9’ position within a nAChR subunit confers “hypersensitivity” to agonist in receptors containing L9’ mutant subunits [27-29].
Thus, 9’ mutations can act as a reporter for subunit incorporation. Interestingly, the
“accessory” subunits α5 and β3 do not have the conserved amino acid at their 9’ location.
Both the α5 and β3 subunit sequences have a valine (V) occupying the 9’ position.
Hypersensitive β3 subunits have been constructed by mutation of either the 9’ or 13’
positions [22]. To construct a potentially hypersensitive α5 subunit, the 9’V at position 280 was mutated to an S to create α5V9’S and α5V9’S-mEGFP constructs. These constructs were then subcloned into the oocyte expression vector pGEMhe for use in electrophysiology experiements. Injection of α59’S mRNA with α4 and β2 in a 10:10:1 ratio was sufficient to cause a leftward shift in dose response to ACh. We conclude that α59’Sα4β2 receptors are formed, and the increase in receptor sensitivity indicates that the
9’S mutation can act as a reporter for α5 incorporation (see figure 1.5). Injection of α59’S–
mEGFP mRNA with α4 and β2 in a 10:10:1 ratio results in a biphasic dose response to ACh. This shift indicates that the fluorescently labeled subunit is incorporated into an α59’S-mEGFPα4β2 receptor, but subunit incorporation may not be as efficient.
Figure 1.5
Acetylcholine dose response curves from
(α4)3(β2)2 –bottom curve α59’s-mEGFPα4β2-middle curve α59’Sα4β2 –top curve.
Receptors expressed in Xenopus oocytes and recorded with an OpusExpress.
Table below describes the mRNA injection ratio of each subunit and calculated EC50 value from the dose response curve.
With these data we are able to demonstrate construction of a functional fluorescent α5- mEGFP subunit. Complete protein expression was verified using IP and Western blot. α5- mEGFP was shown to be fluorescent via heterologous expression in transiently transfected N2a, HEK293, and HEK293-T cells using fluorescence confocal microscopy. Expression of fluorescent α5 is consistently low compared to other fluorescent α subunits, and low expression of many α5-mEGFP constructs has been observed in N2a and HEK293 clonal cell lines. Functional verification of α5-mEGFP was performed by oocyte electrophysiology, and the optimized α5-mEGFP construct, α5-mEGFP378, was selected for use in additional experiments.
Chapter 2
Investigation into miR-346 Regulation of the nAChR α5 Subunit
MicroRNA’s (miRNAs) are small (< 25 base pairs), single stranded, non-coding RNAs that regulate gene expression at the post transcriptional level. Mature miRNAs form loose base pair interactions with the UTR regions of their target mRNA transcripts. This can lead to degradation and impaired translation. Because the base pair interaction between miRNA and mRNA target are imperfect, one miRNA may regulate many gene products [30]. Many miRNA’s are expressed in spatially and temporally restricted patterns, and miRNA regulation has been associated with almost every cellular process, including cancer, immune response, and cellular degeneration [30]. miRNAs are also known to play a large part in development, acting as “switches” to control critical timing dependent processes such as organogenesis and neural development [30].
A few nAChRs are thought to be regulated by miRNAs, but no in-depth investigation has been undertaken. In C. elegans, a conserved miRNA, miR-1, regulates the expression of two nAChR muscle subtypes that are important for synaptic transmission at the neuromuscular junction [31]. Preliminary screening of a commercially available library of orphan miRNAs against luciferase-based reporter constructs with murine nAChR 3’UTRs have revealed several candidate miRNA-nAChR interactions (unpublished work by Eric Hogan, University of Massachusetts). A single miRNA, miR-346 was shown to inhibit luminescence when luciferase was coupled to the α5 3’UTR or α10 3’UTR (see figure 2.1).
Figure 2.1. Results of luciferase screen of orphan miRNA library against nAChR 3’UTRs. Subunits affected by miR-346 are highlighted in red. Both α5 and α10 3’UTR constructs displayed a 30% reduction of luminescence in cells co-expressed with miR-346, but not when the 3’UTR contained mutated recognition sequences. (data from Hogan et al.)
Follow-up studies identified the miRNA recognition element recognized by miR- 346 in the α5 and α10 3’ UTR as ACAGGCAGACA. Mutations to this sequence in both the α5 and α10 3’ UTR resulted in no effect on luciferase activity when miR-346 was present (figure 2.2). With the interaction between miR-346 and α5 and α10 3’ UTRs firmly established, we next examined miR-346 regulation of the α5 protein as expressed in clonal cells transiently transfected with α5 subunits.
Figure 2.2
Site directed mutagenesis of predicted miR-346 binding sites in the 3’ UTR of α5 and α10 was carried out in the context of MIR-REPORT-Luciferase. Mutated sequences are shown on the right. MRE = miRNA recognition element. Bars indicate mean ± SEM. Student t-test ***p ≤ 0.001 (data from Hogan et al.)
In collaboration with Hogan et al. in the Tapper Lab at the University of Massachusetts, α5-mEGFP was selected as the reporter construct for further investigations.
The complete mouse α5 wt 3’UTR (3’UTR) or 3’UTR with mutated miR-346 MRE (3’MUT) were subcloned into the α5-mEGFP378 and α5D/N-mEGFP378 plasmid constructs (see table 1). Expression analysis of the constructed α5-mEGFP fusion proteins was performed using HEK293-T cells transiently transfected with α5-mEGFP, α5-mEGFP- 3’UTR, α5-mEGFP-3’MUT, α5D/N-mEGFP, α5D/N-mEGFP-3’UTR, or α5D/N-mEGFP- 3’MUT (figure 2.3). Statistical differences in total fluorescence were detected between α5- mEGFP and α5D/N-mEGFP, and also between α5-mEGFP and α5D/N-mEGFP-3’MUT (t- test, p = 0.05). Interestingly, there was no significant difference in fluorescence between α5-mEGFP and α5D/N-mEGFP-3’UTR.
Figure 2.3
Relative fluorescene of α5-mEGFP
α5D398N-mEGFP α5-mEGFP3’UTR α5D398N-mEGFP3’UTR α5-mEGFP3’MUT α5D398N-mEGFP 3’MUT expressed in HEK293T cells and assayed for fluorescence using a standard fluoremeter.
Asterisks indicate significant reduction in expression compared to α5-mEGFP, by t-test, p ≤ 0.05
Due to their small size and single stranded nature, miRNAs are highly unstable [30]. A precursor form of the desired miRNA is used for transfection to prevent degradation of the desired miRNA. Once inside the cell, the Pre-miR is processed by
endogenous proteins to create a mature miRNA strand. At high concentrations, non specific interactions of miRNA with mRNA transcripts can occur. These interactions may lead to regulatory effects on non-target sequences. We sought to optimize the concentration of miR-346 precursor (Pre-miR-346) necessary for regulation of α5-mEGFP-3’UTR. α5- mEGFP-3’UTR or α5-mEGFP-3’MUT were co-transfected with varying concentrations of Pre-miR346 for expression in HEK293-T cells. Results show that 1 nM Pre-miR-346 is the optimum concentration for use in further experiments (figure 2.4).
Figure 2.4
Bar graph illustrating resultant fluorescence from transfections of α5-mEGFP-3’UTR (dark grey) or α5- mEGFP-3’MUT (light grey) with varying concentrations of Pre-miR-346. Asterisk indicates significant variation (p ≤ 0.05) from 0nM values. 1 nM was selected as the optimal concentration of Pre-miR346 because at that concentration significant reduction in α5-mEGFP-3’UTR but not in α5-mEGFP-3’MUT was observed.
α5-mEGFP-3’UTR was then co-transfected with 1 nM of Pre-miR346, a scrambled miRNA precursor, or α5 siRNA. Cells were assayed for fluorescence intensity using a
fluorescent plate reader 24 h post-transfection. Preliminary results from Hogan et al.
showed a 50% reduction in α5-mEGFP-3’UTR expression when co-transfected with Pre- miR-346 (figure 2.5).
Figure 2.5
Results of fluorescence assay of HEK293-T cells transiently transfected with α5-mEGFP-3’UTR and either 1nM of scrambled negative control or 1nM Pre-miR-346.
Fluorescence is reduced by almost 50%
when Pre-miR-346 is transfected with α5-mEGFP-3’UTR
(data from Hogan et al.)
However, additional experiments using α5-mEGFP and α5-mEGFP-3’MUT as positive and negative control, respectively, were unable to repeat these results. Figure 2.6 shows the consistent lack of response of the various α5-mEGFP constructs to different transfection conditions. Reduction in fluorescence of α5-mEGFP3’UTR upon addition of miR-346 was not significant and additionally, greater reduction of α5-mEGFP3’UTR expression was seen when α5-mEGFP3’UTR was co-transfected with a scrambled Pre-miR sequence than in the Pre-miR-346 condition. Obviously, more experiments are needed to determine specific regulation of α5-mEGFP3’UTR via direct, sequence-specific interaction between miR-346 and the α5 3’UTR.
Figure 2.5
Bar graph representing relative fluorescence of α5-mEGFP (black) α5-mEGFP 3’UTR (light grey)
α5-mEGFP 3’MUT (dark grey)
after co-transfection with (right to left) water, scrambled Pre-miR, Pre-
miR-346, or
commercially available siRNAs to α5 siRNA0, siRNA2, siRNA.
α5* receptors have been implicated in developmental changes in activation and
morphology of the medial prefrontal cortex (mPFC). The mPFC is responsible for decision making and attention as well as other higher-order cognitive processes. Cholinergic inputs to the cortex appear early in brain development and are widespread in rats by the third week of post-natal life [32]. There is a corresponding developmental peak in nicotinic current response to ACh in rodent mPFC layer VI neurons that is mediated by α5*
receptors and occurs during a crucial period of cortical circuit refinement [10, 32-33].
Nicotinic stimulation during this period can modulate the retraction and maturation of neuronal processes [32]. α5* receptors are known to be enriched in layer VI of the mPFC and it has recently been discovered that proper expression of the α5 subunit in this area during development plays an important role in normal attention behavior in adult mice [10]. Work by Leslie et al. examining expression of α5 mRNA in rats indicates that there may be a global reduction in α5 mRNA after post-natal day 10 [34]. We hypothesize that this down regulation of α5 mRNA may be due to regulation by miRNAs such as miR-346.
In this chapter we have identified a miRNA, miR-346, that may be involved in regulation of nAChR expression. This miRNA is upregulated in adult mouse brain after chronic nicotine exposure, and a reduction in luminescence of a luciferase reporter construct fused to the α5 3’UTR in the presence of miR-346 is reported. More investigation is necessary to determine the nature of the biological interaction between miR-346 and α5.
However, preliminary experiments suggest that fluorescence of α5-mEGFP-3’UTR is reduced in the presence of 1 nM Pre-miR-346. Data presented here lays the foundation for investigation of miRNA regulation of nAChRs and specific regulation of α5 by miR-346.
Elucidating the role of miR-346 in regulation of α5 expression could have implications for brain development and disease states.
Chapter 3
Expression of α5-mEGFP in Mouse Cortical Neurons
Subcellular localization of the neuronal nAChR subtypes α4β2 and α4β4 depends on the β subunit. Signal sequences in the M3-M4 loop of β nAChRs bind protein factors to enable or inhibit forward trafficking for expression on the cell membrane. The M3-M4 loops of some subunits, like β4, contain forward trafficking signals that contribute to the abundant expression of receptors containing those subunits at the cell surface [35].
However, many subtypes, such as those that contain the β2 subunit, are primarily retained in the ER. For these receptors, molecular chaperones such as nicotine may aid in surface expression [23, 36]. The presence of these intracellular trafficking sequences may act as an intra-receptor level of nAChR regulation. The α4β2 receptor can exist in two stoichiometries, one of which traffics more readily to the membrane [23]. This difference in trafficking between stoichiometries may be partially due to the number of beta subunits contained in the receptor. An RRQR retention motif has been identified in the M3-M4 loop of the nAChR β2 subunit. The (α4)3(β2)2 receptor traffics to the membrane more easily than (α4)2(β2)3 because the (α4)2(β2)3 stochiometry contains more beta subunits and therefore more RRQR signals [23, 37]. nAChRs may also use incorporation of accessory subunits such as α5 and β3 to modulate trafficking and expression.
Examination of the α5 M3-M4 loop identified a forward trafficking IFL amino acid motif beginning at position 354 and a LCM motif at position 364. I/LXM motifs, where X can be any amino acid, have been associated with vesicular export from the endoplasmic reticulum. The I/LXM sequence interacts with a surface groove of Sec24D, a major component of COPII vesicles, for efficient cargo packaging [38]. Presence of Sec24D
targeting sequences in the α5 subunit imply that incorporation of an α5 into a parent receptor may encourage trafficking of the α5* receptor to the plasma membrane via interaction with Sec24D and other COPII machinery. When α5 is incorporated into an α4β2 receptor, the receptor stochiometry becomes fixed as α5(α4β2)2. This α5(α4β2)2 receptor contains two ER retention RRQR signals from the β2 subunits and one IFL motif in the M3-M4 loop of the α5 subunit. We hypothesized that due to the reduction in retention sequences and the addition of a forward trafficking signal α5α4β2 receptors may be more easily expressed on the cell membrane than α4β2 receptors.
To assay whether α5α4β2 receptors are trafficked differently than α4β2 receptors, we first expressed these receptors heterologously in clonal cell lines N2a and HEK293.
Cells were imaged live, 48 h post-transfection, at 37 °C with a Nikon C1 scanning confocal microscope. In all fluorescence experiments the percentage of cells with detectable α5- mEGFP fluorescence is low when compared to α4-mEGFP and β3-mYFP controls. Even after optimization of transfection, expression, and imaging protocols, α5-mEGFP fluorescence remained ≤ 50% of control subunit levels. It is possible that like α7*
receptors, whose expression is significantly enhanced by co-expression with the chaperone protein Ric-3, α5* receptors rely on endogenous protein chaperones or other factors for optimal expression, and α5-mEGFP may be more efficiently expressed in primary cells [39]. To test this hypothesis, α5-mEGFP was expressed in primary cultures of mouse neurons.
α5-mEGFP plasmid DNA was transiently transfected into mouse cortical neurons alongside unlabeled α4 and β2 subunits. Due to the difficulty of imaging primary neurons, cells expressing nAChRs were fixed with 4% paraformaldahyde (PFA) before
imaging. 48 h post-transfection cells were fixed, washed with 1% phosphate buffered saline (PBS), and imaged in PBS at room temperature after excitation with a 488nm laser.
Images were spectrally unmixed against control spectra for mEGFP and background controls. When transfected with only α4-mEGFP and β2 plasmid DNA, mouse e17 cortical neurons express α4-mEGFPβ2 with a transfection efficiency of approximately 10% (figure 3.1). When α5-mEGFP is transfected with unlabeled α4 and β2 subunits, very low intensity of α5-mEGFP fluorescence is seen. In addition to reduced fluorescence, a cell death rate of over 50% is observed. Unlike α4-mEGFP, α5-mEGFP exhibits low intensity fluorescence that is confined to the cell bodies (see figure 3.1B). Interestingly, when a red fluorescent α4-mCherry is transfected with green fluorescent α5-mEGFP and unlabeled β2, all detected fluorescence, not just that from α5-mEGFP, is confined to the cell body (figure 3.1D). This is not true when fluorescent α4 subunits are transfected with unlabeled β2 subunits alone (figure 3.1C).
Figure 3.1
Mouse e17 cortical neurons expressing fluorescent nAChRs. Cells were transfected after 6 days in culture, fixed with 4% PFA and imaged 48 h post transfection. Samples were exposed to 488 nm (mEGFP) or 561 nm (mCherry) laser excitation and spectrally unmixed against control spectra for mEGFP and mCherry.
Scale = 25 microns
A) α4-mEGFPβ2 – fluorescence is fairly bright and extends into the processes. Laser intensity = 15%.
B) α5-mEGFPα4β2 – fluorescence is dim and restricted to the cell body. Laser intensity = 35%
C) α4-mEGFPα4-mCherryβ2 – overlay of images obtained using 488nm and 561 nm excitation.
Laser intensity = 15%.
D) α5-mEGFPα4-mCherryβ2 – overlay of images obtained using 488 nm and 561 nm excitation.
Laser intensity = 35% and 15%, respectively.
We see that fluorescence from α4-mEGFP is distributed into the neuronal processes, but when the α5 subunit is present, fluorescence is restricted to the cell body. It is possible that insertion of a flurophore disrupted the efficiency of expression of α5- mEGFP. However, It is interesting to note that it is not the presence of the mEGFP in the intracellular loop that contributes to the expression problem. α5-mEGFP subunits constructed such that the mEGFP has been fused to the extracellular C-terminal domain of the α5 subunit, leaving the M3-M4 loop clear of any manipulation were also transiently transfected into mouse cortical neurons with the same lack of success.
Given the high rate of cell death, attempts were made to optimize the neuronal transfection protocol. It was found that transfecting neurons in a lower volume of growth media (0.5 mL), combined with complete replacement of cellular medium following 4 h 37 °C incubation with the lipofection-DNA complex, greatly enhanced both transfection efficiency and cell viability (see appendix ii for complete optimized protocol). This optimization has eliminated the need for fixed cell imaging techniques. Using the CO2
buffering Leibovitz media in the absence of phenol red, a small 37 ºC incubator installed on the microscope stage, and a heating unit that warms the objective itself to 37 ºC, it is possible to maintain live cell health during an imaging session for upwards of 1 h before apoptotic phenotypes are observed.
Figure 3.2A shows the poor expression and low fluorescence previously seen in the fixed neurons transiently transfected with α5-mGFP α4 β2 receptor subunits. The multiple cells in the single imaging field shown in figure 1C illustrate the improvements to the transfection efficiency over those previously used, and increased expression and visualization of the α5-mEGFP subunit after optimization of culture, transfection, and
imaging conditions. It is also important to note the increased fluorescence intensity and the improved distribution of fluorescence of the cells in shown in figure 3.2B and 3.2D when compared to the fixed cell shown in 3.2A. Improved transfection and cell culturing methods have allowed us to visualize more than just the cell soma. Figures 3.2B and 3.2D show that α5-mEGFP expression in live neuronal culture extends from the soma into both primary and secondary processes of the neuron.
Figure 3.2
Mouse e17 cortical neurons expressing α5-mEGFP. Cells were transfected after 6 d in culture and imaged 24 h post- transfection. All images were taken with a scanning confocal microscope after excitation with 488 nm laser.
A. Expression of α5-mEGFPα4β2 using non-optimized transfection protocol.
Image was taken after fixation with 4%
PFA, 24 h post-transfection.
B and D. Expression of α5-mEGFPα4β2 under optimized cell culture and transfection protocol. Cells were imaged live, without fixation, 48 h post- transfection.
C. Widefield image of multiple fluorescent neurons in a dish illustrates the significant improvements in transfection achieved using the optimized protocol.
We know from previous experiments performed in HEK293 and N2a cells that α5-mEGFP or α5D398N-mEGFP subunits co-localize with α4 and β2 receptor subunits (chapter 4). α5- mEGFP or α5D398N-mEGFP subunits also form functional receptors with α4 and β2 receptor subunits in frog oocytes (chapter 1). The improvements made to experimental techniques have allowed us to ask whether α5-mEGFP or α5D398N-mEGFP subunits co- localize with α4 and β2 receptor subunits in primary cell cultures. Figure 3.3 shows example images of co-transfection experiments with α5-mEGFP or α5D398N-mEGFP, α4-
mCherry, and unlabeled β2 subunits. This is the first reported expression of a mutant α5D398N-mEGFP subunit in mouse neurons.
As stated in the introduction, the SNP rs16969968 encodes a D to N substitution in the M3-M4 loop of the α5 subunit at position 398 and is associated with increased risk for nicotine dependence in humans [18]. It was hypothesized that the M3-M4 loop localization of the D398N mutation may contribute to changes in intracellular trafficking or localization of the mutant protein. Co-transfection experiments did not reveal any differences in localization between α4-mCherry and expressed α5-mEGFP and α5D398N-mEGFP subunits (figure 3.3). This could indicate proper expression and assembly of α5-mGFP, α4- mCherry, and β2 into α5-mGFPα4-mCherryβ2 receptors; unfortunately, no obvious differences in expression were seen upon introduction of the α5D398N-mEGFP subunit.
Figure 3.3
A. False color images (left to right) of α5-mEGFP α4- mCherry, and an overlay of the α5-mEGFP α4- mCherry images.
B. False color images (left to right) of α5D398N- mEGFP α4-mCherry, and an overlay of the α5- mEGFP α4-mCherry images.
All images are max- intensity projections of 1 micron step size z-stacks.
Imaging was performed with a scanning confocal microscope after sample excitation by 488 nm for the mEGFP (green) or 561 nm for mCherry (red).
All scale bars 20 microns.
Co-localization studies performed on cells expressing α5-mEGFP, α4, β2, and the ER marker dsRed-ER show a 1:1 correlation with ER marker and localization of α5- mEGFP (figure 3.4). Chronic or acute incubation with nicotine may rescue ER localization of α5-mEGFP and facilitate ER exit of α5-mEGFP containing receptors, possibly though a chaperoning-like mechanism. 4 h treatment of neurons transiently transfected with α5- mEGFP, α4, β2, and dsRed-ER with 1.0 µM nicotine did not result in measurable changes in localization with ER marker. Other concentrations of nicotine were also investigated but no changes were observed.
Figure 3.4
Representative images of mouse e17 cortical neurons expressing α5-mEGFP subunits with non- fluorescent α4 and β2 subunits.
Neurons were concurrently transfected with dsRED-ER, to delineate the endoplasmic reticulum.
Fluorescent expression of α5- mEGFP was characteristically low, and no obvious differences in co-localization with dsRED-ER were seen after 24 h incubation with 0.5 µM nicotine.
24 h incubations were performed with 0.1 µM nicotine, and the same result was seen. Parallel experiments conducted with the α5D398N-mEGFP mutant variant were performed for both 4 h and 24 h incubations, and no difference in co-localization with ER marker or phenotypic differences between α5-mEGFP and α5D398N-mEGFP were observed (figure 3.5).
Figure 3.5
Representative images of α5D398N-mEGFP and ER marker dsRED-ER. Images were taken by scanning confocal microscope after excitation with 488 nm (mEGFP) or 561 nm (dsRED-ER) laser. Scale = 20µm.
mEGFP images perfectly overlay with dsRED ER images, indicating that there is little expression of α5D398N-mEGFP outside the ER.
It is possible that differences in trafficking do occur, but the effects are subtle.
Measurements of integrated membrane expression using Total Internal Reflection Fluorescence (TIRF) have been used to quantify differences in surface expression of α4β2 receptors after drug exposures [23]. Similar techniques could be applied to neurons expressing α4 vs α5 and/or α5D/N subunits. With the data reported here we are able to demonstrate expression of fluorescent α5-mEGFP and α5D/N-mEGFP constructs in mouse e17 cortical neurons. Optimized protocols for transfection, expression and imaging of these neurons are described in detail in appendix ii. Similar to results reported in chapter 1, even after optimization of imaging conditions, expression of fluorescent α5 is consistently low compared to other fluorescent α subunits. It we wish to study the endogenous behaviors of α5* receptors, it is possible that other methods for fluorescent labeling must be used to
improve visualization and ensure wild-type behavior of the labeled receptor.
From these data, we must conclude that there is little difference in trafficking of α4- mEGFPβ2 vs. α5mEGFPα4β2 receptors. α5mEGFPα4β2 receptors express much less efficiently, and α5mEGFP fluorescence does not extend as far into the neuronal processes
as does α4-mEGFP, but this is most likely due to the large difference in expression level and not the result of differential trafficking. Incubation with 1µM nicotine was not able to rescue ER localization of either the α5mEGFPα4β2 or α5D/NmEGFPα4β2 receptor and no difference in expression or subcellular localization of these two receptors was seen. Taken together, these data suggest that the D398N mutation does not exert its influence over α5mEGFPα4β2 by altering assembly or trafficking of the receptor.
Chapter 4
Determination of nAChR stoichiometry using Normalized Försters Resonance Energy Transfer (NFRET)
Försters resonance energy transfer (FRET) has become a technique widely used in the biological community to assay for protein-protein interactions. FRET describes the distance dependent, non radiative transfer of energy between a donor fluorophore in an excited state and an acceptor fluorophore in the ground state [40]. Donor fluorophores emit at wavelengths that overlap with the acceptor excitation spectrum. In biological applications these donor and acceptor molecules are frequently fluorescent protein variants of GFP. The Förster distance, R0, is the distance at which energy transfer is 50% of the maximum, and for fluorescent proteins this distance tends to fall within a range of 40 – 60 Å. Within this distance, detection of a FRET signal is sufficient to indicate interaction between two independent FP labeled proteins [41-42].
FRET is sometimes called a “molecular ruler” as it can be used to directly measure the distances between donor and acceptor fluorophores [43]. This is especially useful when measuring conformational changes before and after ligand binding or during denaturation [44-45]. The distance between FRET donor and acceptor molecules can be simply calculated by equation 1. Where EFRET is the efficiency of energy transfer, τD is the decay rate of the donor in the absence of acceptor, R0, is the distance at which energy transfer is 50% efficient, and r is the distance between donor and acceptor fluorophores.
(eq 1)
𝐸
!"#$=
!!!
(
!!!
)
!This is a simplification from the greater equation given below for rate of FRET, kT(r), between a single donor, D, and acceptor, A, separated by a distance, r, where QD is the quantum yield of the donor, κ2 is the orientation factor for the donor and acceptor transition dipoles, and N is Avogadro’s number. FD(λ) is the corrected fluorescence intensity of the donor in the wavelength range λ to λ+Δλ, and εA(λ) is the extinction coefficient of the acceptor at λ. n represents the refractive index of the medium and is assumed to be 1.4 for biological applications.
(eq 2) 𝑘! 𝑟 = !!!!!
!!! !"""!"!"
!"#!!!!! !!𝐹! 𝜆 𝜀! 𝜆 𝜆!𝑑𝜆
Qualitatively, FRET can be used to determine whether two proteins come close enough together to form an interaction. If two FP labeled proteins are in close proximity, such that a FRET signal is detected, it can be implied that they are close enough to form direct interactions with each other. This approach has been applied to nAChRs. Drenan et al. demonstrated that β3 was incorporated into α6* receptors by measuring FRET interactions between FP labeled α6 and β3 subunits via donor recovery after photobleaching (DRAP) [22].
Within the nAChR pentamer, there are two possible distances between subunits.
For instance, in the α6α4β2β3 receptor α6 subunits can be either adjacent, or non-adjacent to β3 subunits. When a receptor contains a single donor and acceptor FP pair there are two possible FRET outcomes that correspond to distance and position within the pentamer.Son et al. estimates that the distance (r) between adjacent subunits, a, is approximately 5.2 nm and b, the diagonal distance between nonadjacent subunits is approximately 8.3 nm. Using
mEGFP and mCherry, and the donor and acceptor fluorophores, R0 = 5.1 nm, and equation 3 (a rearrangement of eq. 1) EFRET is calculated to be 47% for adjacent FP and 5% for non- adjacent FP-labeled subunits. Therefore, it is theoretically possible to determine the position of an α6-mEGFP with respect to a β3-mCherry subunit within an assembled pentamer.
(eq. 3)
𝐸
!"#$=
!!
!
!
!! !!! !
The α4β2 receptor presents additional challenges to interpretation of FRET data because it can be expressed in multiple stoichiometries of two or more of a single subunit subtype. When α4β2 receptors are expressed with FP labeled α4 subunits, the α4 may contain either a mEGFP or mCherry label. Possible label geometries are illustrated in figure 4.1. Nevertheless, from measurements of α4 subunits labeled with the FRET donor/acceptor pair cyan fluorescent protein (CYP)/ yellow fluorescent protein (YFP), Son et al. proposed that the (α4)2(β2)3 and (α4)3(β2)2 stoichiometries can be differentiated using FRET [6].
Figure 4.1
Cartoon of α4β2 and α5α4β2 receptor pentamers, their stoichiometries and relative FRET values.
Dark grey indicates a FRET donor, light grey indicates a FRET acceptor.
The calculation of EFRET in the presence of multiple donor and acceptor molecules is complicated. In their analysis Son et al. make some necessary geometric assumptions:
1. “In a functional α4β2 receptor, there are at least two agonist binding sites at the α-β subunit interfaces (these are polarized, requiring particular faces of each subunit; see assumption 2 below). Therefore, in the (α4)2(β2)3 stoichiometry, the two α4 subunits are nonadjacent, and in the (α4)3(β2)2 stoichiometry, the two β2 subunits are nonadjacent.
2. The β subunit is adjacent, in the clockwise direction, to the α subunit.
3. Although the intracellular domain of the α4 subunit has roughly twice as many amino acids as that of the β2 subunit, the fluorophores are positioned in an equilateral pentagonal structure.
4. All α4 subunits are radially equivalent, and all β2 subunits are radially equivalent.
5. Because YFP (acceptor) and CFP (donor) differ by only nine amino acids, YFP- and CFP-tagged subunits are synthesized with equal efficiency and assemble
randomly within receptor pentamers. The expected results are rather insensitive to departures from this assumption by even 2-fold.
6. Again, because YFP and CFP differ only subtly, the structure of an α4CFP subunit is the same as α4YFP; in addition, a β2CFP subunit has the same structure as a β2YFP subunit.
7. In a rigorous analysis, the dipole orientation factor κ2 differs between adjacent and nonadjacent subunit pairs. Analysis shows that, in general, the ratio κ2 (nonadjacent subunits)/κ2 (adjacent subunits) lies between 1 and 2; a full prediction requires knowledge of the dipole orientation, which we do not know.
We assume that this ratio always equals 1.” [6]
Using these assumptions, the difference in calculated EFRET was dependent on the number of donor and acceptor subunits within the pentamer. Son et al. chose to examine the case in which only the α4 subunits are labeled with FPs. An assembled pentamer of (α4)2(β2)3
stoichiometry, contains only one possible arrangement of donor and acceptor FPs. The theoretical EFRET calculated from equation 3 for a single mEGFP/mCherry pair in a non- adjacent arrangement is 5%.
The (α4)3(β2)2 stoichiometry, however ,can assemble into four possible geometries (see figure 4.1). The measured EFRET for a population of α4-mEGFP α4- mCherryβ2 receptors in an (α4)3(β2)2 stoichiometry becomes the weighted sum of the EFRET for each geometry times the probability of the occurrence of the geometry. The theoretical EFRET for each receptor conformation can be calculated using the equations below:
(eq. 4) EFRET (1 donor, nonadjacent to 2 acceptors) = !
!!
!
!
!!! !!! !
(eq. 5) EFRET (1 donor, adjacent and nonadjacent to 2 acceptors) = !!
! !
!!!!
!!
!! !!! !
!!!!
!!
(eq. 6) EFRET (2 donors, both nonadjacent to an acceptor) =
!!
!
!
!! !!! !
(eq. 7) EFRET (2 donors, each adjacent and nonadjacent to 1 acceptor) = !! !!!
!
!! !!!!+
!!
!
!
!! !!! !
Normalized Förster Resonance Energy Transfer (NFRET) has been used successfully to examine changes in between α4 subunits (α4-EGFP and α4-mCherry) in cells transiently transfected with α4 and β2 subunits and has provided clues to stoichiometric changes upon addition of pharmacological agents such as nicotine [46].
Detection of FRET is possible by measuring intensity of sensitized emission. Equation 8 describes the calculation of EFRET based on intensity measurements. IFRET is the intensity of the FRET signal, ID is the measured fluorescent intensity of the donor fluorophore, BTD is the bleed-through fluorescence detected in the acceptor channel after excitation of the donor. IA is the fluorescent intensity of the acceptor flurophore and BTA is the bleed-through fluorescence of the acceptor.
(eq. 8) EFRET = 𝐼!"#$−𝐼!𝐵𝑇! −𝐼!𝐵𝑇!
NFRET describes the measured EFRET value after normalization with the square root of ID and IA (equation 9). This method is ideal for calculation of FRET within a multi- pixel image in which each image pixel may contain different numbers of FP labeled receptors and therefore display different fluorescence intensities [47].
(eq. 9) ENFRET = !!"#$!!!!"!!!!!"!
!!!!
To examine the efficiency of unlabeled α5 subunits into α4-mCherryα4-mEGFPβ2 receptors, N2a cells were transiently transfected with DNA constructs of α4-mCherry, α4- mEGFP, and β2 subunits. Plasmid DNA constructs were transfected in a 1:1:1 ratio of α4- mCherry:α4-mEGFP:β2 to bias assembly of the (α4)3(β2)2 stoichiometry. 48 h post- transfection, cells were imaged at 37 °C on an Eclipse C1si laser-scanning confocal microscope with a 63 X, 1.4 numerical aperture, violet-corrected plan apochromatic oil objective and a multianode photomultiplier tube with 32 channels (Nikon Instruments Inc., Melville, NY). Images were linearly unmixed with the emission spectra of the donor and acceptor fluorophores using reference spectra. NFRET was measured using the PixFRET plugin for ImageJ [40, 47]. The calculated NFRET values per-cell were then plotted as average histograms and fitted to two Gaussian curves (see figure 4.2).
It was hypothesized that incorporation of unlabeled, wild-type α5 constructs into α4-mCherryα4-mEGFPβ2 parent receptors could be detected as a shift in calculated FRET values. Addition of an unlabeled α5 subunit into an α4-mCherryα4-mEGFPβ2 receptor population would lock the FP-labeled α4 subunits geometries into a non adjacent position
and thus reduce the measured ENFRET for the receptor population. N2a cells were transiently transfected with DNA constructs of α4-mCherry, α4-mEGFP, β2wt and either α5 or β3 subunits and compared to the α4-mCherryα4-mEGFPβ2 control. However, no change in NFRET values or in the areas of the two Gaussians fit to the NFRET histogram was seen (figure 4.2).
Figure 4.2
Sum histograms of NFRET calculated from images of N2a cells expressing fluorescent nAChRs. Each dark grey curve describes the sum NFRET calculated in 40 cells. Light grey curves describe Gaussian curves fit to the sum histogram. Properties of the fit Gaussians were intended to describe each sub population stoichiometry.
It was hypothesized that α4-mCherryα4-mEGFPβ2 receptors may not incorporate accessory subunits as efficiently as other receptor subtypes. α3β4 are also know to incorporate α5 and β3 accessory subunits [7]. NFRET was assayed in N2a cells expressing α3-mCherryα3-mEGFPβ4, α3-mCherryα3-mEGFPβ4α5, or α3-mCherryα3-mEGFPβ4β3 subunits. A small shift was seen in the peak position of the second fit, corresponding to the
“high-FRET” Gaussian component, but it was not found to be significant (figure 4.3).
It is possible that the incorporation of unlabeled α5 subunits into α4β2 parent receptors is so inefficient that α4-mCherryα4-mEGFPβ2α5 receptors do not represent a
large enough sub-set of the entire receptor population to change on measured NFRET values.
Figure 4.3
Sum histograms of NFRET calculated from images of N2a cells expressing fluorescent nAChRs. Each dark grey curve describes the sum NFRET calculated in 40 cells. Light grey curves describe Gaussian curves fit to the sum histogram. Properties of the fit Gaussians were intended to describe of each sub population stoichiometry.
In this case, a direct measurement of the α5* receptor population would be preferable.
Detection of interaction between α4-mCherry and α5-mEGFP could indicate subunit incorporation. NFRET measurements between α5-mEGFP378 and α4-mCherry were performed in HEK293 cells and yielded inconsistent NFRET signals. NFRET was detected in only 60% of cells imaged, and the peak NFRET value per cell showed high variability using the α5-mEGFP378 construct (figure 4.4).
Figure 4.4 Same as figure 1.4
23 individual histograms of NFRET positive pixels in images of HEK293 cells expressing α5-mEGFP378, α4-mCherry, and β2 subunits. Bolded histogram describes the average of all 23 cells.
Distribution of individual cell histograms show significant variability in NFRET calculated for each individual cell. Average peak appears to be near 5% NFRET.
0 5 10 15 20
0 500 1000 1500 2000 2500 3000
Pixel Count
NFRET %
Inconsistency in NFRET data led to the hypothesis that NFRET was not measuring fully-assembled nAChR pentamers but that NFRET measurements were dominated by intracellular sub-assemblies of dimers, trimers, and tetramers. To test this hypothesis, a series of transfections was performed with α4 or α5 subunits in the absence of β2. Without the β2 subunit it is impossible for a fully formed pentamer to assemble. Figure 4.5 shows that NFRET signals are not indistinguishable by eye when N2a cells are transfected with α4-mCherry and α4-mEGFP, or α4-mCherry α4-mEGFP and β2 subunits. However, no statistical difference was found after a two-sample independent t-test between the total FRET positive pixels of these two cell populations (p = 0.50) (see also appendix iii).
Figure 4.5
A. Raw fit histograms of NFRET from ≥ 40 N2a cells expressing α4-mEGFP and α4-mCherry without β2.
Bolded line indicates the average of the raw fits.
B. Average fit histogram of cells described in A.
C. Raw fit histograms of NFRET from ≥ 40 N2a cells expressing α4-mEGFP and α4-mCherry and β2. Bolded line indicates the average of the raw fits.
D. Average fit histogram of cells described in C.
E. Overlay of average fit histograms for NFRET calculations in cells that do have the ability to form complete α4β2 pentamers (C and D, light grey line) and cannot form complete pentamers (A and B, dark grey line).