Eastern Panama is one of the most diverse and poorly understood regions not only in Latin America, but also in the world. An analysis of the relevant actors and their micro-fundamental logic is then carried out to understand the human implications of this specialized research. However, the underlying causes of land cover and land use change appear to be the structure of Panama's governance system and the resulting power dynamics within the country.
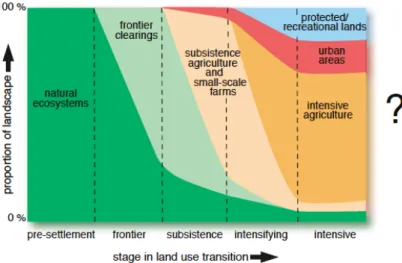
One of the most definitive features of any human society is its interaction with the land. As shown in Figure 1 (see Appendix A), Foley (2005) has isolated five different stages of the so-called 'land use transition'. Therefore, it is important to undertake research efforts at different scales to fully understand the complexities of the regions involved.
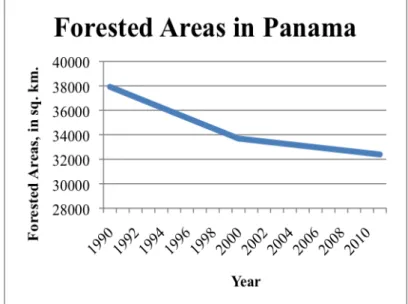
One of the most important land use changes in the world today is deforestation, which is occurring at an alarmingly high rate and rate (Global Forest Watch, 2014). From a preliminary understanding of the Panamanian landscape, it is clear that Panama falls into the 'intensification' phase of the land use transition identified above. Once these lands are identified, a discussion is made of the potential implications of this information.
More sustainable land use planning and policies will therefore be a direct result of the determination of the FVL and its broader Panamanian relevance.
Methods & Procedures
From a sustainability perspective, this work is thus part of a broader plan that works to improve land use and land cover in Eastern Panama. To conduct the analysis, data were collected from a variety of sources in Panama City. First, a digital copy of the 2007 pilot study as well as additional information about the study was obtained from the Autoridad Nacional del Ambiente.
In the following weeks, data was obtained from various sources, both physical and digital, as summarized below. To ensure the compatibility of the data and the accuracy of the analysis, the acquired files were immediately projected to the Coordinate System NAD_1927_UTM_Zone_17N and cut along the borders of the provinces of Panama and Darién. As described in the cartographic model (Figure 6 in Appendix B), the first stage of the analysis consisted of dividing a Digital Elevation Model (DEM) into.
After the 2007 BID survey, the Llano areas, with a slope of less than 8%, were immediately identified as non-FVL areas. Similarly, the Fuerte Ondulado areas with a slope of more than 30% were immediately identified as FVL areas. The Moderado Ondulado areas, with a slope of 8-15%, and the Ondulado areas, with a slope. of 15-30% was then made into a shapefile for further analysis. ii) Precipitation: Following the method outlined in Appendix B (Figure 7; Precipitation method explained), three intervals of precipitation intensity were determined from monthly and annual precipitation averages at the numerous ETESA hydrometeorological stations in the study region.
Three polygonal shapefiles were created: (1) Baja, with low rainfall intensity (2) Media, with medium rainfall intensity and (3) Alta, with high rainfall intensity, which were stored and subsequently used for further analysis. iii) Soil: Here, a polygonal shapefile containing attribute data regarding land cover of soil types provided by STRI was used. Specifically, a small literature review was conducted to determine the propensity of each soil type to hold forest or other land cover. The three above analyzes were therefore combined, as outlined in the cartographic model (Figure 8, Appendix B), to create a shapefile containing Eastern Panamá's FVL and a shapefile containing Eastern Panamá's non-FVL.
For this phase of the analysis, a 2008 forest cover shape file, from ANAM via Gerardo Vergara, was used to define the forested and deforested areas of the study region. The first scheme contained areas under forest cover and the second contained only areas that were under alternative non-forested land covers. The Phase 1 and Phase 2 products were joined together in this analysis phase through a series of geoprocessing clips in ArcGIS to obtain shapefiles of both forested and non-forested FVL in the study region.
Results
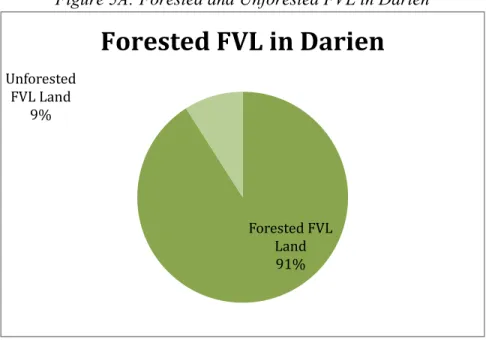
As shown in Figure 3, Appendix A and Map 3, Appendix C, 70% of the identified FVLs are currently under forest cover. Due to the context and time frame of the study, several limitations were met. The most notable and influential limitation of this study was the availability of updated data.
Many study days were spent tracking down data that turned out to be either non-existent or insufficient for the analysis. Furthermore, some data used in this study (especially the most recent Panamanian land cover shapefile obtained from ANAM via Gerardo Vergara) are several years old, thus leaving a margin for error due to the likelihood of changes since 2008. due to the absence of specific information regarding the kinetic energy of rainfall and the presence of only monthly and annual rainfall averages, the Arnoldus 1980 formula for rainfall intensity was deemed most suitable for use in this study.
This calculation is known to be an overestimate and therefore the calculated rain intensity values were overestimates, causing the FVL shapefiles to become slightly larger. It was indeed the most applicable formula given the scope and context here, but it presented the study with an important limitation. The other main limitation of this study was the time frame in which the study was conducted.
This limited each phase of the study and prevented a more nuanced and precise identification of eastern Panama's FVL. Thus, this limitation of this study points to the need for future work to be conducted on a smaller scale or over a larger study region.
Discussion
To ensure that the development of the nation follows a sustainable course, the forestry lands identified above must be maintained under forest cover or a similar sustainable land use. Because not all of the identified FVL are currently under forest cover (see Map 3, Appendix C), there is an important role for ANAM in converting these areas to more sustainable land use practices. Therefore, any social application of the utilization of FVL and non-FVL areas for their relevant tasks requires ANATI's help.
However, this seems extremely unrealistic in the context of today's Panama, as there are already residents, both official and informal, of FVL areas. ANATI also has a role in the realization of lands defined as non-FVL. Panama has an intimate knowledge of land and will play an invaluable role in applying this knowledge and transitioning to sustainable land use in the region.
Similar to recent changes in land use over time, the indigenous peoples of the area are increasingly realizing the unsustainability of some local practices and traditions (Nelson et al., 2001). As important members of the Eastern Panamanian region, these communities and individuals should be given access to the above spatial information. Providing the indigenous peoples of eastern Panama with access to such information puts the longevity of their livelihoods through the longevity of the environment into their own hands.
The functioning of the Canal, the basis of much of the country's well-being, depends entirely on the health of the surrounding forests, giving the country a very unique perspective from which to view sustainability. In the late 1970s, academics and policy makers realized the importance of the basin in providing the Channel with enough fresh water to support the 35 to 45 ships that transit the Channel every day. Here, a large-scale restructuring of land use in the Channel watershed took place to maintain the necessary hydrological functioning of the Channel.
Thus, there is precedent to be followed for land use changes across a large and crucial part of the Panamanian landscape, making this daunting task seem somewhat more feasible. These inequalities manifest in the power dynamics evident in the country, in which a small minority holds much of the authority, both socially and politically, and the ability to influence large-scale changes in the region. However, an analysis of the surrounding socio-economic environment shows that there is a clear need for greater cooperation between governmental, sub-national and local actors and organizations.
Conclusions
Such projects will enable improved modeling of various future scenarios and will undoubtedly function to help determine the best mechanisms by which the region can move towards sustainable land use practices. A meta-analysis of proximate and underlying causes of deforestation based on subnational scale case study evidence.
FVL Land Area in Darien
FVL Land Area in Panama
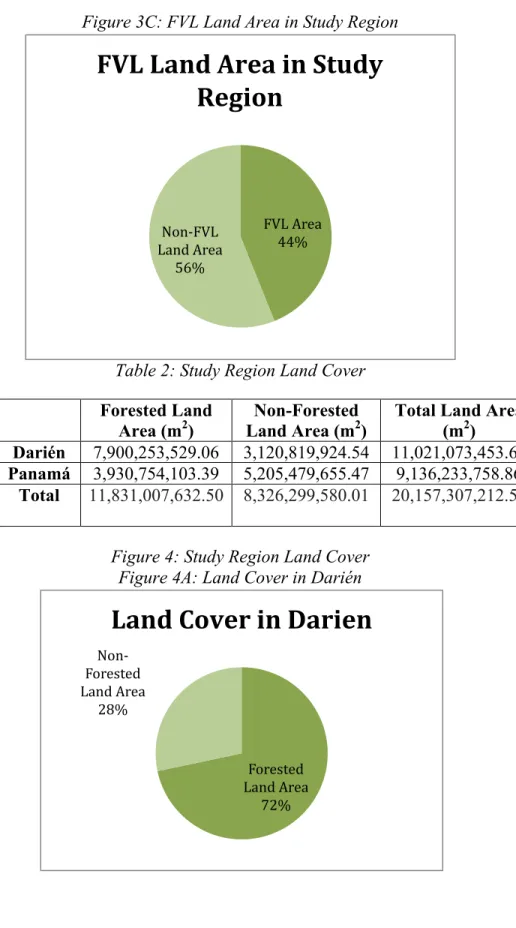
FVL Land Area in Study Region
Land Cover in Darien
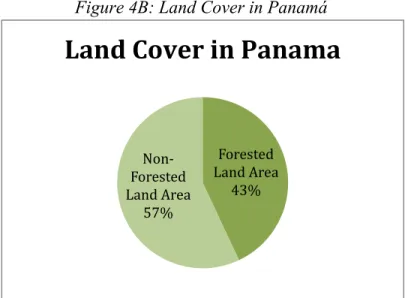
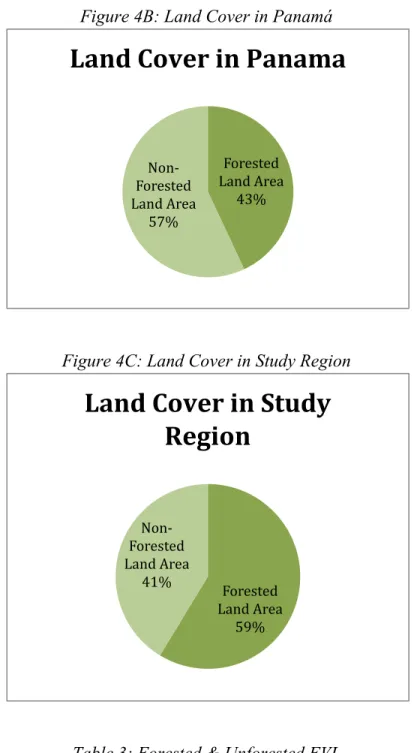
Land Cover in Panama
Land Cover in Study Region
The file was then imported for use in ArcGIS as a .csv file, from which a point shapefile was created using latitude and longitude coordinates. The shapefile was then interpolated into a raster file to assess the rainfall intensity throughout the study region. Then, as described above, three intervals were determined using Jenk's Natural Breaks Optimization classification, which divides classes by minimizing variance within classes and maximizing variance between classes (maybe cite this).
Once these classifications were obtained, the classified vector polygon was used to create three shapefiles: (1) Baja, with low rainfall intensity (2) Media, of medium rainfall intensity, and (3) Alta, with high rainfall intensity.