4/19/23, 1:43 PM Bung Hatta University Mail - Final changes
azrita ubh <[email protected]>
Final changes
5 messages
Haynes, Jonathan <[email protected]> Thu, Dec 15, 2022 at 8:52 PM To: azrita ubh <[email protected]>
Dear Azrita
Re: 1 query – and 2 confirmations
Thank you for the resolutions to my text points.
1. Re: an outstanding point. Unfortunately, there is still one small area that does not seem quite right. This concerns the paragraph under the subheading, ‘Preparation of formulated product’. This currently runs:
‘We prepared 100 g of palm sap sugar by traditional production and cooked it in 1.0 litre of fresh water for fifteen minutes at 60⁰ C to make an 11% palm sap sugar solution. Then, it was cooled in an open space for twenty minutes. Furthermore, we also prepared 2.0 litres of mature coconut water (Cocos nucifera L.) and mixed it with the 1.0 litre of palm sap sugar solution. The product was stored for ten minutes in a cool air-conditioned room. A total of 3.0 litres of the formulated product was divided into three parts of 1.0 litre each.’
a. Re: sentence 1. The figure of 11% in sentence 1 does not seem correct? (If 100g are cooked in 1 litre, the palm sap sugar makes 1/ 11th of the product, or approximately 9%?)
b. Re: sentence 3. If you created 1.1 litres of palm sap sugar solution in sentence 1 (not 1 litre…) then that is different to
‘the 1.0 litre of palm sap sugar solution’ you refer to here. Please note that in the Abstract (and possibly elsewhere), you also refer to mixing 2 litres of coconut water with 1.0 litre of palm sap sugar solution.
Perhaps there is an explanation for point b) that has been left out? For example, perhaps you only got 1 litre of solution as a result of the process in sentence 1 due to some of it being ‘boiled off’ (?). If that was the case, you could add in such a detail and all would make sense. Alternatively, possibly you did obtain 1.1 litres of palm sap sugar solution, but only used 1 litre of it – again, if the text made this clear, then the details would add up. However,
‘11%’ in sentence 1 does seem to be incorrect.
Please clarify how the paragraph should run.
2. I have applied your other text changes. However, you actually sent versions of the manuscripts with slightly different corrections (perhaps they had not been updated?) in two cases. Therefore, please confirm the following text in the manuscript is correct on these two points:
a. Under the heading, ‘Condition factor and body indices of giant gourami after 90 days of feeding’, after a number of lines you have got:
4/19/23, 1:43 PM Bung Hatta University Mail - Final changes
The GSI value of gourami was significantly (F (3,8) = 10.492, P = 0.243) different between diets, and the GSI of giant gourami fed KP3 rations was higher than if fed KP1, KP2, or KP4 rations.
b. Under Acknowledgments, I have added your new sentence and left the existing one also. So it runs:
We are grateful to the Ministry of Education, Culture, Research, and Technology of the Republic of Indonesia for funding this research. We would also like to thank the students and fish farmers who helped with data collection in the field and in the laboratory.
Please confirm both these pieces of text in the manuscript are just as they should be.
I look forward to hearing back and sending the manuscript to be printed…
All the best
Jonathan F1000 Research
PS By the way, I am the editor working on your manuscript, there is no-one else doing so (you sometimes sound like you are unclear on this). Best, Jonathan
Information Classification: General
azrita ubh <[email protected]> Sun, Dec 18, 2022 at 6:56 AM To: "Haynes, Jonathan" <[email protected]>
Dear Jonathan
F1000 Research Team
Thank you for your email on December 15, 2022; We have read the 1 query – and 2
con irmations about manuscript No. 124706. 1 query and two con irmations have been revised.
Part revised Highlighted in red (the list correction is attached). Please help us complete this manuscript if there are small things we have not revised.
With best regards
4/19/23, 1:43 PM Bung Hatta University Mail - Final changes Azrita
[Quoted text hidden]
2 attachments
124706 F1000 Research - Received JH2 - Des 16,22 .doc 3063K
List correction manuscript No. 124706 - Des 16, 2022.pdf 64K
Haynes, Jonathan <[email protected]> Sat, Dec 24, 2022 at 1:31 AM To: azrita ubh <[email protected]>
Hi Azrita
Just a quick email to say thanks for this. I have been a bit in and out of the office this week; I will be processing your manuscript next as it is top of the list. So hopefully I should be able to send the ‘unconditional acceptance’ for publication very shortly.
Best wishes
Jonathan
From: azrita ubh <[email protected]>
Sent: Saturday, December 17, 2022 11:56 PM
To: Haynes, Jonathan <[email protected]>
Subject: Re: Final changes
Dear Jonathan
F1000 Research Team
Thank you for your email on December 15, 2022; We have read the 1 query – and 2
con irmations about manuscript No. 124706. 1 query and two con irmations have been revised.
Part revised Highlighted in red (the list correction is attached). Please help us complete this manuscript if there are small things we have not revised.
With best regards
Azrita
On Thu, Dec 15, 2022 at 8:52 PM Haynes, Jonathan <[email protected]> wrote:
Dear Azrita
Effect of feed enriched by products formulated from coconut water, palm sap sugar, and mushroom on the chemical composition of feed and carcass, growth performance, body indices, and gut micromorphology of giant gourami, Osphronemus goramy (Lacepède, 1801), juveniles
Azrita undefineda*, Hafrijal Syandria, Netti Aryanib, Ainul Mardiahc
aDepartment of Aquaculture, Faculty of Fisheries and Marine Science, Universitas Bung Hatta, Padang, West Sumatera, 25133 Indonesia
bDepartment of Aquaculture, Faculty of Fisheries and Marine Science, Universitas Riau, Pekanbaru, 28293, Indonesia.
cDepartment of Aquaculture, Faculty of Fisheries and Marine Science, Universitas Nahdlatul Ulama Sumatera Barat, West Sumatera, 25118, Indonesia.
Corresponding author: [email protected]
ABSTRACT
Background: Giant gourami, Osphronemus goramy (Lacepede, 1801) is the most important freshwater aquaculture farm in Indonesia’s. The purpose of this study is to determine the effect of various newly formulated products on the amino acid composition of the diet and whole-body carcass, the growth coefficient, body indices, and gut micromorphology.
Methods: 100 g of palm sap sugar, cooked in 1.1 litre of fresh water for fifteen minutes, and only got 1 litre of solution due to some of it being boiled off to make an 11% palm sap sugar solution. Furthermore, 2 litres of coconut water and mixed in it with 1 litre of palm sugar solution. 1 litre of product was added in turn to 2 g of Aspergillus niger (CP2), 2 g of Rhizopus oligosporus (CP3), and 2 g of Saccharomyces cerevisiae (CP4), while, freshwater as a control (CP1). Aquafeed was added to CP1, CP2, CP3, and CP4, to make diets labeled KP1, KP2, KP3, and KP4. The dosage was 150 ml/kg of feed. Juvenile giant gourami (initial weight 50±0.25 g and length 13.2±0.07 cm) were reared in triplicate net frames (2×1×1 m;
water volume 1.5 m3) in a freshwater concrete pond with a stocking density of 30 juveniles/net.
Results: The results supported our hypothesis that different product formulations have a significant effect (P < 0.05) on aquafeed nutrition and the whole-body carcass, growth coefficient, feed utilization, body indices, and gut micromorphology of giant gourami juveniles. The thermal growth coefficient strongly correlated with the daily growth coefficient (r2 = 91%). The KP3 diet contains a higher concentration of amino acids, which increased the growth coefficient, feed utilization, and carcass quality more than the other diets that we tested.
Conclusions: Diet KP3 contains higher total amino acids in diets and carcasses and leads to better growth for giant gourami.
Keywords: Giant gourami, amino acid profile, growth performance, feed efficiency, coconut water, gut micromorphology
Commented [HJ1]: Re: figures within the article.
#2 - Unfortunately, only one of the four attachments is at the resolution we need for reproduction (300 dpi); this is the one for Figure 3. Please therefore could you provide jpegs (or another suitable file format such as tiffs) at 300 dpi for the other figures to be used. Thanks.
Formatted: Highlight Formatted: Highlight Formatted: Highlight Formatted: Highlight
Commented [HJ2]: On our system, the last part of the address that was entered currently reads: ‘…Universitas Bung Hatta, Padang, Sumatera Barat, 25113, Indonesia’.
#2 - Which address is correct please? They are different.
Formatted: Superscript, Highlight Formatted: Highlight Formatted: Highlight Formatted: Highlight Formatted: Highlight
Formatted: Font: Italic, Highlight Formatted: Highlight Formatted: Font: Italic, Highlight Formatted: Highlight Formatted: Font: Italic, Highlight Formatted: Highlight
Commented [HJ3]: #2 – you have made a change or two here. However the sentence starting ‘Aquafeed was added…’, which I queried, is still confusing, unfortunately. (It suggests that you add aquafeed to CP1 and then also add CP2, CP3, CP4 to the ‘aquafeed plus CP1’ mix.)
I think you must mean: ‘Aquafeed was added to CP1, and then added to CP2, CP3, and CP4, to make diets labeled KP1, KP2, KP3, and KP4.’ Please confirm.
Formatted: Highlight
Introduction
In this decade, the production of capture fisheries has decreased; meanwhile, the demand for fish products for human consumption is increasing. Therefore, according to the Food and Agriculture Organisation, 60% of fisheries production in the future will come from aquaculture activities and this figure will continue to rise1. The utilization of a variety of fish for aquaculture has now increased the need for commercial feed2,3,4,5. At the same time, for aquaculture operations, the cost of aquafeed is still a significant challenge2,6,7,8. On the other hand, commercial feed produced by factories still does not contain complete nutrition for fish growth, while being acknowledged for its positive effects on food safety9,10,11. In this context, enriching fish feed with cost-effective natural ingredient resources is key to increasing feed nutrient quality and feed efficiency in commercial fish farming and ensuring the sustainability of aquaculture operations2,12,13.
The target is fish feed that is wealthy in many important nutrients, including protein, fat, vitamins, and minerals that cultured fish can utilize to increase their growth rate and survival and that is beneficial for human health4,14,15,16. Therefore, novel approaches have been developed by scientists to improve the nutrition of fish feeds, such as feed supplemented with EPA and DHA17, iodine and selenium10, methionine18, fish oil19,11, and soybean oil20. In addition, supplementing probiotics into the diet21 and supplemental glycine, prebiotics, and nucleotides in a soybean meal-based diet have been studied22.
The progress of aquaculture biotechnology has stimulated the interest of scientists in improving aquatic animal production, for example, to increase giant gourami production. One of the experimental techniques is to increase feed nutrition used for this purpose, such as, the use of fish meal and Azolla flour as a feed ingredient for giant gourami23, and the utilization of new products formulated from water coconut, palm sap sugar, and fungus for the enrichment of commercial feed9. Additional research has involved a diet supplemented using glutamine24, feed supplemented with a growth hormone25, and substitute fish meal incorporating chicken feather26. Whether using coconut water and palm sap sugar fermented with mushrooms affects the amino acid composition of the diet, body carcass, growth coefficient, and body indices is still not understood.
Coconut water has extraordinary nutritional value and contains supplements for health like minerals, amino acids, fatty acids, vitamins, enzymes, organic acids, and several phenolic compositions27,28,29,30. Palm sap sugar also has health benefits due to its essential nutrient content, such as a low glycaemic index, and it contains antioxidants, vitamins, and minerals31,32,33,34. Meanwhile, mushrooms have been widely used in fermentation due to their
Formatted: Highlight
Commented [HJ4]: #2 – It does not seem to work, putting
‘FAO, 2018’ in the text, as no other references like tis, which are given in the end-of-article References, are included within the text. So I have cut this and moved the spelt-out ‘Food and Agriculture Organisation’ within the sentence.
This seems to work well to me – if you agree?
Formatted: Highlight
Commented [S5R4]: We agreed
Formatted: Highlight
ability to degrade antigenic proteins in fish feed ingredients7,35,36. Additionally, coconut water is a functional food that can protect the lens from diabetic cataract development in rats37. Coconut water is also a treatment for burning pain during urination, dysuria, gastritis, increasing semen, and indigestion38.
On the other hand, Azrita et al.9 have reported using new formulations of products containing coconut water and palm sap sugar that are fermented with various mushrooms involving a dosage of 300 ml/kg feed. Their newly formulated products can increase fatty acid levels in the diet and whole body carcasses. Besides that, they also improve giant gourami's growth performance and feed efficiency.
However, the effect of these new formulation products at a dosage of 150 ml/kg feed on the diet amino acid composition, and body meat's amino acid composition has not yet been analyzed. In line with that, the relationships between thermal growth coefficient and condition factor, daily growth coefficient, and feed utilization coefficient, including body indices parameters, as well as the gut micromorphology of giant gourami, have not yet been analyzed.
We hypothesized that commercial aquafeed combined with different newly formulated products at the dosage of 150 ml/kg feed could improve the amino acids compositions of the aquafeed and whole body carcass, body indices, and gut micromorphology. Hence, this investigation's first purpose was to analyze the effect of various newly formulated products on the diet's proximate compositions, amino acid composition, and whole-body carcass. The second aim was to analyze the impact of newly formulated products on the growth coefficient and relation to thermal growth coefficient, body indices, and gut micromorphology in giant gourami juveniles.
Methods Ethical approval
The Research and Community Service Ethics Committee at Universitas Bung Hatta, West Sumatera, Indonesia approved this research (89/LPPM/Hatta/III-2022) which followed the ARRIVE guidelines. The Ministry of Education, Culture, Research and Technology of the Republic of Indonesia funded the research under grant No. 076/E5/PG.02.00 PT/2022 on March 16, 2022. Approval was given by the ethics committee to collect and rear juvenile gurami sago in the aquaculture laboratory, Faculty of Fisheries and Marine Science at Universitas Bung Hatta. All efforts were made to relieve the suffering of experimental animals. Therefore, the animal did not suffer for this study, and they were still in good
Commented [HJ6]: #2 - Please confirm this plural (‘compositions’) is correct
condition when returned to the pond after research was completed. Where some fish were euthanized, this was carried out by piercing part of the fish’s brain. Gurami sago fish are not classified as a protected animal according to Indonesian legislation.
Preparation of formulated product
We prepared 100 g of palm sap sugar by traditional production and cooked it in 1.1 litre of fresh water for fifteen minutes at 60⁰ C, and only got 1 litre of solution due to some of it being boiled off to make an 11% palm sap sugar solution. Then, it was cooled in an open space for twenty minutes. Furthermore, we also prepared 2.0 litres of mature coconut water (Cocos nucifera L.) and mixed it with the 1.0 litre of palm sap sugar solution. The product was stored for ten minutes in a cool air-conditioned room. A total of 3.0 litres of the formulated product was divided into three parts of 1.0 litre each. We added 2 g of Aspergillus niger (labeled as CP2 product) to the first part of the formulated product solution, 2 g of Rhizopus oligosporus (labeled as CP3 product) to the second part, and 2 g of Saccharomyces cerevisiae (labeled as CP4 product) to the third portion. The CP2, CP3, and CP4 products were fermented for 48hrs in a jerry can (2.0 litres) using an Aerasi PUJIMAC, MAC-40 K 40 L/min. The products of CP2, CP3, and CP4 were used to enrich the nutrition of commercial aquafeed (781-2, PT. Japfa Comfeed Indonesia, Tbk) and labeled as the KP2, KP3, and KP4 diets. The aquafeed was supplemented with freshwater (labeled as the KP1 diet; placebo).
Preparation of experimental diets
Giant gourami juveniles were adapted for one month to standard feed, namely floating commercial aquafeed 781-2 (pellet size 2 mm), which contained 10.66% water content, 30.10% crude protein, 4.09% crude fat, 45.35% total carbohydrates, 2.5% ash, and 9.18%
crude fibre. The minerals in the commercial feed were 280.08 mg/100 g Na, 1415.02 mg/100 g Ca, 1358.07 mg/100 g K, 1200.31 mg/100 g P, 292.03 mg/100 g Mg, 18.14 mg/100 g Fe, and 13.83 mg/100 g Zn. The aquafeed was added to freshwater to create the KP1 diet as observed, and the formulated CP2, CP3, and CP4 products were added to the aquafeed at a dosage of 150 ml/kg of feed to create the enriched fish diets. The formulated product added to the aquafeed was mixed manually with it for three minutes to obtain maximum homogenization and then the blend was dried in the open air for thirty minutes. Thereafter, it was given to the trial animal.
Experimental procedures and sampling
Formatted: Highlight
Commented [HJ7]: #2 – query. This ‘11%’ applies to ‘palm sap sugar’ - I don’t follow what this means. Are you saying that the palm sap sugar itself, at the start, was only 11%?
If so, suggest we have: ‘We prepared 100 g of 11% palm sap sugar by traditional production and cooked it in…’.
If instead, you want to say that the overall preparation of 1.0 litres involved 11% palm sap sugar, you would need to have:
‘We prepared 100g of palm sap sugar by traditional production and cooked it in 1.0 litre of fresh water for fifteen minutes at 60°C, to make an 11% palm sap sugar solution.’
Which is it please? Pls clarify.
Formatted: Highlight
In the present study, we measured fish weight using AD-600i scales with 0.001 g accuracy (ACIS model number AD-600i, China). At the same time, a meter ruler with 1 mm accuracy was used to estimate the body length. A total of 360 sago strain juveniles of giant gourami were counted; the initial mean weight was 50±0.25 g, and the initial length was 13.2±0.07 cm. For rearing juveniles, twelve nets framed with 2 m3 (2×1×1 m) PVC pipe (water volume of 1.5 m3) were placed inside two freshwater concrete ponds with a size of 18 m3 (6×2×1.5 m). This experiment consisted of four treatments and three replications, and each frame net was stocked with 30 juveniles. The giant gourami were fed the KP1, KP2, KP3, and KP4 diets three times a day (08:00, 12:00, and 17:00hrs) during the 90-day feeding trial. Juveniles of giant gourami were fed at a 3% body weight rate per day based on the percentage of stored biomass. Fish samples were collected every 30 days for body weight and length measurements. Ten fish per net frame were collected and anesthetized orally using clove oil.
Then, their lengths and weights were measured. Prior to sampling, the fish fasted for 24hrs to empty their intestinal contents.
Proximate and amino acid composition
The diet samples and proximate carcass composition were analyzed using standard AOAC methods39. The matter was dried to a constant weight at 105°C. We used the standard Kjeldahl method to analyse crude protein (N × 6.25). We used the Soxhlet method with ether extraction to analyse crude lipids; the ash was incinerated at 550°C for 16 hrs, whereas gross energy was measured in a bomb calorimeter. The amino acid composition was determined by using a high-performance liquid chromatography (HPLC) system consisting of a water 1525 binary HPLC pump, 717 autosamplers (water ®), and water 2475 multi λ fluorescence detector optics (wavelengths: 250 nm for excitation and 395 nm for emission). It was hydrolysed in triplicate with 6 N hydrochloric acid for 24hrs at 11°C40.
Nutrient utilization and body indices
The growth coefficients in the fish experiments were measured by using the thermal growth coefficient (TGC), daily growth coefficient (DGC), total feed intake (FI), and protein efficiency ratio (PER) of giant gourami, assessed using the following formulae:
TGC = [(final weight (g))⅓ – (initial weight (g))⅓] / (mean water temperature (°C)) × duration of rearing period (day)] × 1000
Formatted: Highlight
Commented [HJ8]: Sense of ‘replicates’ unclear…do you mean ‘replications’?
#2 – I don’t understand what ‘replicate’ means (or ‘replicates’), I’m afraid. The word reads like an error. (‘replicates’ also reads like an error, it is incorrect usage.)
Do you mean you did the four treatments 3 times? (ie that you ‘replicated’ them 3 times? ‘replicated’ means ‘repeated’, as we know…)
I’d like to suggest that you phrase it a different way, so we can ensure the wording captures what you want…many thanks.
Formatted: Highlight
DGC = (Wf⅓ – Wi⅓) / duration of rearing period (day) × 100 FI as feed (FI as feed in g/fish/day) = Total feed fed / (n × t) PER = wet weight gain / total protein intake
Three fish from each net frame were sacrificed and dissected immediately to determine the Condition factor (CF), Viscerosomatic index (GSI%), Hepatosomatic index (HSI%), Visceral fat-somatic indexes (VFSI%), and Bilesomatic index (BSI) as given below:
CF = 100 × [weight of the juvenile (g) / Length of juvenile (cm3)]
GSI = 100 × [viscera weight (g) / whole body weight (g)]
HSI = 100 × [liver weight (g) / whole body weight (g)]
VFSI = 100 × [visceral fat weight (g) / whole body weight (g)]
BSI = 100 × [Bile weight (g) / weight of liver (g)]
Histological examination of the gut
For histological analyses, each gut specimen of the animal was cut into the foregut, midgut, and hindgut. Moreover, the cells were cleaned in saline solution and fixed in Bouin's fixative solution for 24hrs. After sequential dehydration steps in alcohol, the gut samples were embedded in paraffin. The implanted tissue blocks were sectioned at 5 µm, and sections were consistently stained with Haematoxylin-eosin and observed under a light microscope (Olympus IX71) equipped with Image-Pro Plus 7.0 software. The digitalized analysis measures the micrometer length of various enteric structures of gut images. We determined the average fold height (hF), fold width (wF), and enterocyte height (hMV) of the gut per slice (5 fields per individual sample) according to procedures described by Li et al.18. The specific measurement method of gut samples is shown in Figure 1.
Figure 1. Transversal section photomicrographs of giant gourami juvenile foregut. (A) Fold height and fold width were analyzed in a lower magnification of objective lens of microscope (magnification × 100), (B) Enterocytes height and microvilli height were analyzed using a higher magnification of an objective lens microscope (magnification × 200). hF = fold height, wF = fold width, hE = enterocyte height, hMV = microvillus height (hematoxylin and eosin).
Pond water quality
The water quality values of the freshwater concrete ponds that were used to rear the giant gourami juveniles were recorded weekly. The water samples were collected at 10:00am at a depth of 20 cm from each concrete pond to determine the water temperature, dissolved oxygen, and pH value. In addition, we also measured the total alkalinity, hardness, and nitrates of the water in the pond experiments. A thermometer (Celsius scale) was used to measure water temperature. To measure water dissolved oxygen (O2; mg L-1), we used an oxygen meter (YSI Model 52, Yellow Instrument Co, Yellow Spring, OH USA). A digital pH meter (Mini 0–14 pH IQ, Scientific Cemo Science, Thailand) was used to determine the pH values of water in the experiments. The level of nitrate-nitrogen (NO3-N; mg L-1), alkalinity (mg L-1), and hardness (mg L-1) were measured according to standard procedures41.
Calculations and statistical method
The data from this study were reported in the form of the mean ± standard deviation for each treatment. Data were analysed using the SPSS 16.0 software package (SPSS; Chicago, IL).
Normality was tested using the Kolmogorov–Smirnov statistic. Homogeneity was checked using absolute residuals according to Levine's test. One-way ANOVA was used to determine the treatment effect, followed by a post-hoc Duncan's multiple range test42. To create the figures, Microsoft Office Professional Plus 2019 was used.
Results
Proximate and amino acid profiles of the diets
Commercial feed supplemented with different formulated products with the dosage of 150 ml/kg of feed significantly affects the proximate composition of diets. One-way ANOVA results showed a marginal interaction among treatments in the case of protein content (F (3,8)
= 1.522, P = 0.282), fat (F (3,8) = 5.663, P = 0.022), carbohydrates (F (3,8) = 1.862, P = 0.214), crude fibre (F (3,8) = 1.445, P = 0.300), and ash (F (3,8) = 0.272, P = 0.844), and the total energy content (F (3,8) =1.112, P = 0.400) differed considerably (P < 0.05) among the four diets (Table 1). Duncan's Post-hoc test revealed that the protein content (21.6967±0.17%) was significantly higher (P < 0.05) in the KP3 diet than in the other treatments, while the carbohydrate (31.19 ± 0.38%), crude fibre (2.82±0.06%), and ash (6.67±0.06%) contents were significantly higher (P < 0.05) in the KP3 diet than in the other diets. Conversely, the total energy content was 240.88±0.74 (kg calories/100 g), which was significantly higher (P
< 0.05) in the KP3 diets than in the KP1, KP2, and KP4 diets (Table 1).
The levels of free amino acids in the diets supplemented with different formulated products with a dosage of 150 ml/kg of feed are presented in Table 1. All types of amino acids in the diets of KP1, KP2, KP3, and KP4 were significantly different (P < 0.05), except for tryptophan, and there was no significant difference (P > 0.05) between KP2, KP3, and KP4. Among the essential amino acids, leucine and arginine were found in the highest amounts in the KP1, KP2, KP3, and KP4 diets. There was no significant difference (P >
0.05) in the alanine content between KP2 and KP3 diets and the cystine level in KP1 and KP3 diets. Of the nonessential amino acids, glutamic and aspartic acid represented a significant portion of all four diets.
The present study found significant differences in the overall free essential and nonessential amino acid pools in the KP1, KP2, KP3, and KP4 diets (Table 1). One-way ANOVA results exhibited a marginally significant interaction between experimental diets in terms of essential amino acids (F (3,8) = 11.371, P = 0.003), nonessential amino acids (F (3,8) = 0.407, P = 0.752), and overall amino acid pools (essential plus nonessential) (F (3,8) = 7.355, P = 0.011). Duncan's Post-hoc test revealed that the free essential amino acids (9.10 ± 0.011%), nonessential amino acids (12.91 ± 0.004%), and overall amino acid pools (22.02%) were significantly higher (P < 0.05) in feed supplemented with CP3 products, followed by CP2, CP4, and CP1 products (Table 1).
Formatted: Highlight
Table 1. The experimental diets' proximate and amino acid composition (% dry matter).
Mean ± SD*. Note: Numbers followed by different superscript of letters in the same row indicate a significant differences (P < 0.05). Numbers followed by superscript of the same letter in the same row showed no significant difference (P > 0.05).
KP1 KP2 KP3 KP4
Proximate composition %, dry weight basis
Dry matter 38.42 ± 0.25a 38.27 ± 0.01a 37.59 ± 0.16a 38.41± 0.10a Crude protein 19.68 ± 0.41a 20.27 ± 0.13b 21.70 ± 0.18c 20.44 ± 0.10d Crude lipid 3.41 ± 0.02a 3.67 ± 0.13b 3.50 ± 0.02ac 3.48 ± 0.04ad Carbohydrate 26.37 ± 0.17a 29.50 ± 0.54b 31.19 ± 0.38c 30.57± 0.06d Crude fibre 2.23 ± 0.05a 2.36 ± 0.01b 2.82 ± 0.06c 2.45 ± 0.06d
Ash 2.75 ± 0.03a 6.66 ± 0.05b 6.57 ± 0.04c 6.67 ± 0.06d
Energy total (kg calorie/100 g)
240.87 ± 0.38a 234.41 ± 0.30b 240.88 ± 0.74ac 237.11 ± 0.43d
Amino acid composition
EAA
Leucine 1.36 ± 0.01a 1.42 ± 0.01b 1.46 ± 0.01c 1.36 ±0 .01d
Isoleucine 0.76 ± 0.01a 0.79 ± 0.01b 0.81 ± 0.01c 0.76 ± 0.01d
Lysine 0.95 ± 0.01a 1.10 ± 0.01b 0.98 ± 0.01c 1.20 ± 0.01d
Valine 0.86 ± 0.01a 0.94 ± 0.01b 0.96 ± 0.01c 0.89 ± 0.01d
Threonine 0.79 ± 0.02a 0.92 ± 0.01b 1.04 ± 0.01c 0.83 ± 0.01d
Arginine 1.02 ± 0.01a 1.19 ± 0.01b 1.30 ± 0.01c 1.03 ± 0.01d
Phenylalanine 0.67 ± 0.01a 0.93 ± 0.01b 1.05 ± 0.01c 0.77 ± 0.01d
Tyrosine 0.43 ± 0.01a 0.53 ± 0.00b 0.57 ± 0.06c 0.45 ± 0.01d
Methionine 0.18 ± 0.01a 0.26 ± 0.01b 0.30 ± 0.01c 0.21 ± 0.01d
Histidine 0.40 ± 0.01a 0.50 ± 0.01b 0.57 ± 0.01c 0.43 ± 0.01d
Tryptophan 0.06 ± 0.01a 0.11 ± 0.01b 0.07 ± 0.00bc 0.09 ± 0.01bd
NEAA
Alanine 0.85 ± 0.01a 0.94 ± 0.01b 0.87 ± 0.06c 0.97 ± 0.01bd
Serine 1.01 ± 0.01a 1.12 ± 0.01b 1.23 ± 0.01c 1.01 ± 0.01d
Glycine 1.15 ± 0.01a 1.32 ± 0.01b 1.29 ± 0.01c 1.19 ± 0.01d
Formatted: Highlight Formatted: Highlight Formatted: Highlight Formatted: Font: Italic, Highlight Formatted: Highlight Formatted: Highlight Formatted: Highlight Formatted: Font: Italic, Highlight Formatted: Highlight Formatted: Highlight Formatted: Superscript Formatted: Highlight Formatted: Superscript Formatted: Highlight Formatted: Superscript Formatted: Highlight Formatted: Superscript
Commented [HJ9]: Query – there is ‘ac’ and ‘ad’ in superscript in this line.
This sort of thing occurs occasionally elsewhere. Is it just a case of typos please, or is it deliberate? (If it is erroneous, please go through each table and delete the unwanted letters.)
#2 – Actually, there appears to be no explanation of what any of the superscript letters mean. Please add a note at the bottom of the table about this, therefore – and also, for any other table where this applies…
Proline 1.01 ± 0.01a 1.05 ± 0.01b 1.03 ± 0.01c 1.03 ± 0.02d Aspartic acid 1.25 ± 0.01a 1.50 ± 0.01b 1.40 ± 0.01c 1.56 ± 0.01d
Glutamic 2.15 ± 0.03a 2.88 ± 0.03b 2.59 ± 0.01c 3.01 ± 0.03d
Cystine 0.09 ± 0.01a 0.07 ± 0.01b 0.04 ± 0.01c 0.09 ± 0.01ad
∑EAA 7.56 ± 0.003a 8.70 ± 0.003b 9.03 ± 0.003c 8.04 ± 0.003d
∑NEAA 7.51 ± 0.008a 8.88 ± 0.007b 8.88 ± 0.004c 8.84 ± 0.008d
∑AA 15.07 ± 0.004a 17.58 ± 0.002b 17.91 ± 0.00c 16.88 ± 0.003d
* Values represent the means of triplicate samples.
Proximate and amino acid profile of the whole body of giant gourami
Commercial feed combined with a new formulation product significantly affected the proximate carcass composition of juvenile giant gourami. One-way ANOVA results showed a marginal interaction among group treatments in the case of protein contents (F (3,8) = 1.522, P = 0.282), fat (F (3,8) = 5.663, P = 0.022), carbohydrates (F (3,8) = 1.862, P = 0.214), and crude fibre (F (3,8) = 1.445, P = 0.300). Duncan's Post-hoc test revealed that the protein content (21.69 ± 0.17%), fat (3.47 ± 0.03%), carbohydrates (31.18 ± 0.37%), and crude fibre (2.81 ± 0.05%) were significantly higher (P < 0.05) in the KP3 diet than in the other treatments. Meanwhile, the carcass protein content of fish fed KP1, KP2, and KP4 was not significantly different (P > 0.05) between treatments. For the energy total, KP3 was significantly higher (P < 0.05) than the other treatments (Table 2). However, the moisture content of the carcass did not show any significant variation among the KP1, KP2, KP3, and KP4 diets.
The mean quantities of total amino acids in the carcasses of O. goramy fed different diets are given in Table 2. Lysine and leucine represented a significant portion of the essential amino acids of the whole body carcass, and methionine was present in small quantities in all of the whole-body meat. Of the nonessential amino acids, glutamic acid, aspartic acid, and alanine were the highest, and cystine was the lowest for all whole-body carcasses of giant gourami fed different diets. The levels of glutamic acid were significantly higher in carcasses of fish fed the KP3 diet than in those provided the KP1, KP2, and KP4 diets.
Table 2. Whole-body proximate and amino acid composition of giant gourami after a 90-day
feeding trial. Note: Numbers followed by different superscript of letters in the same row Formatted: Highlight
indicate a significant differences (P < 0.05). Numbers followed by superscript of the same letter in the same row showed no significant difference (P > 0.05).
KP1 KP2 KP3 KP4
Proximate composition %, dry wet basis
Dry matter 64.59 ± 0.16a 64.51 ± 0.34a 64.14 ± 0.33a 64.24 ± 0.12a Crude protein 28.64 ± 0.28a 28.07 ± 0.79ab 28.85 ± 0.45c 28.66 ± 0.44ad Crude fat 2.79 ± 0.03a 2.88 ± 0.02b 2.67 ± 0.04c 3.00 ± 0.02d Carbohydrate 1.38 ± 0.01a 1.99 ± 0.06b 1.97 ± 0.09c 1.31 ± 0.02d Crude fibre 0.97 ± 0.02a 0.68 ± 0.01b 0.83 ± 0.02c 0.95 ± 0.04d
Ash 1.63 ± 0.02a 1.70 ± 0.02b 1.54 ± 0.01c 2.11 ± 0.04d
Energy total (kg calorie/100 g)
144.77 ± 1.58a 155.48 ± 1.26b 157.90 ± 0.91c 149.60 ± 0.29d
Amino acid composition EAA
Leucine 2.13 ± 0.01a 2.37 ± 0.01b 2.42 ± 0.01c 2.26 ± 0.01d
Isoleucine 1.13 ± 0.01a 1.25 ± 0.01b 1.38 ± 0.01c 1.19± 0.01d
Lysine 2.77 ± 0.01a 3.16 ± 0.02b 3.88 ± 0.01c 2.86 ± 0.01d
Valine 1.26 ± 0.01a 1.40 ± 0.01b 1.32 ± 0.01c 1.35 ± 0.01d
Threonine 1.38 ± 0.02a 1.49 ± 0.01b 1.43 ± 0.01d 1.48 ± 0.01d
Arginine 1.58 ± 0.01a 1.71 ± 0.01b 1.63 ± 0.01c 1.70 ± 0.01d
Phenylalanine 1.02 ± 0.01a 1.11 ± 0.01b 1.08 ± 0.01c 1.11 ± 0.01d
Tyrosine 0.80 ± 0.01a 0.84 ± 0.00b 0.83 ± 0.01c 0.85 ± 0.06d
Methionine 0.15 ± 0.01a 0.21 ± 0.01b 0.18 ± 0.01c 0.16 ± 0.01d Histidine 0.55 ± 0.01a 0.56 ± 0.01ab 0.59 ± 0.01c 0.57 ± 0.01d Tryptophan 0.08 ± 0.01a 1.02 ± 0.01b 1.08 ± 0.01c 0.06 ± 0.00d
NEAA
Alanine 1.86 ± 0.01a 2.08 ± 0.01b 2.92± 0.01c 1.97 ± 0.01d
Serine 1.28 ± 0.01a 1.31 ± 0.01b 1.26 ± 0.01c 1.31 ± 0.01d
Glycine 1.58 ± 0.01a 1.68 ± 0.01b 1.61 ± 0.01c 1.77 ± 0.01d
Formatted: Highlight Formatted: Superscript Formatted: Highlight Formatted: Superscript Formatted: Highlight Formatted: Superscript Formatted: Highlight Formatted: Superscript Formatted: Superscript Formatted: Superscript, Highlight
Formatted: Highlight Formatted: Highlight
Commented [HJ10]: #2 – figures have changed in this table, without being highlighted. See column 3 for ‘Serine’ and
‘Proline’ here.
I am unclear why this is so….(inevitably, if changes aren’t highlighted we are not aware of them and so cannot read them to check for typos etc…)
As a result of the changes, the numbers were closed up to the ‘±’ symbol – which I had tweaked before. So I have re- corrected it here.
Commented [S11R10]: We agreed
Proline 1.06 ± 0.01a 1.16 ± 0.01b 1.08 ± 0.01c 1.16 ± 0.01d Aspartic acid 2.71 ± 0.01a 3.08 ± 0.01b 3.79± 0.01c 2.77 ± 0.01d
Glutamic 4.36 ± 0.03a 4.92 ± 0.01b 4.97± 0.01c 4.66 ± 0.01d
Cystine 0.06 ± 0.01a 0.09 ± 0.01b 0.06 ± 0.01c 0.05 ± 0.01d
∑EAA 12.68 ± 0.003a 15.13 ± 0.005b 15.82± 0.001c 13.61 ± 0.008d
∑NEAA 12.91 ± 0.007a 14.32 ± 0.01b 15.69 ± 0.002c 13.50 ± 0.001d
∑AA 25.59 ± 0.003a 29.45 ± 0.04b 31.51 ± 0.001c 27.11 ± 0.004d
* Values represent the means of triplicate samples.
When the overall quantities of total essential and nonessential amino acids were compared, the whole-body carcass amino acid content was significantly lower (P < 0.05) in fish fed the KP1 diet than in those fed the KP2, KP3, and KP4 diets (Table 2). The number of amino acids (essential plus nonessential) in the carcasses of fish fed the KP3 diet was significantly higher than that in fish fed the KP1, KP2, and KP4 diets.
Growth coefficient and survival
The growth coefficient and feed utilization of the giant gourami juveniles displayed significant differences among the diets. One-way ANOVA results exhibited a marginally significant difference between experimental diets in the case of the thermal unit growth coefficient (F (3,8) = 153.99, P = 0.458), and daily growth coefficient (F (3,8) = 59.88, P = 0.288), while total feed intake (% BW day-1) (F (3,8) = 14.938, P = 0.56), and protein efficiency ratio (F (3,8) = 15.78, P = 0.29) also showed significant differences (P < 0.05) among the treatment diets (Figure 2).
Figure 2. Growth coefficient and feed utilization of the giant gourami juveniles reared under different diets during 90 days of the experiment period. (A) Thermal growth coefficient (TGC), (B) daily growth coefficient (DGC), (C) feed intake (FI), and (D) protein efficiency ratio (PER). The mean value and standard deviation (mean ± SD) are presented for giant gourami (n = 3). Different superscripts in the bar diagram of the giant gourami juvenile TGC, DGC, FI, and PER indicate significant differences among other diets (P < 0.05, One-way ANOVA Duncan Post-Hoc)
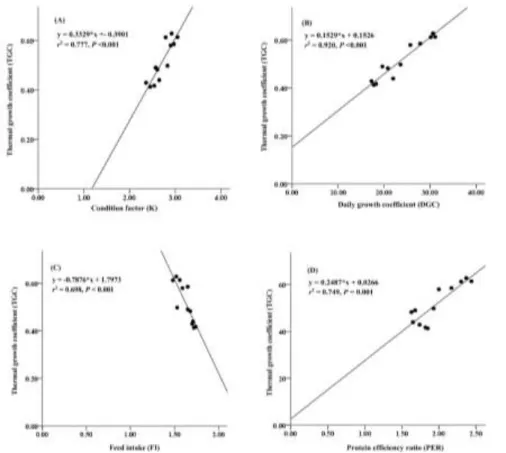
Furthermore, the thermal growth coefficient (TGC) has often been used to predict growth performance and production performance of aquaculture using water temperature at the fish- rearing location. This study presents the relationship between thermal growth coefficient and condition factor, daily growth coefficient, and protein efficiency ratio (Figure 3). The thermal growth coefficient had strong relationships with the condition factor (r2 = 0.777, figure 3A), daily growth coefficient (r2 = 0.999, figure 3B), and protein efficiency ratio (r2 = 0.749, figure 3D), while the thermal growth coefficient had a moderate relationship with the feed intake (r2 = 0.699, figure 3C).
Figure 3. Relationships between thermal growth coefficient and condition factor (A), daily growth coefficient (B), feed intake (C) and protein efficiency ratio (D) for giant gourami (O.
gourami) over 90 days.
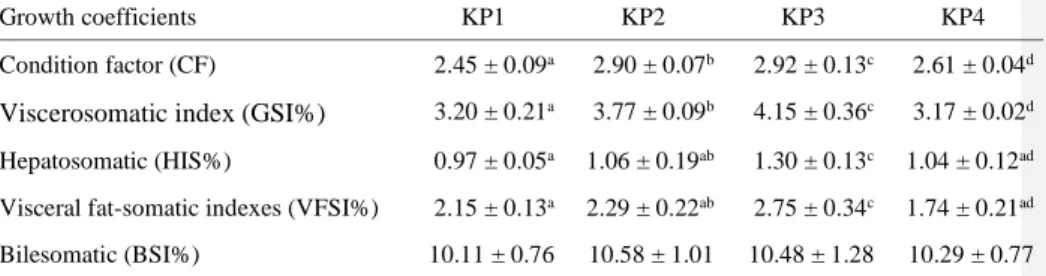
Condition factor and body indices of giant gourami after 90 days of feeding
The condition factor was significantly different between diets (F (3,8) = 19.98, P = 0.566) in the present study; while the GSI, HIS, and VFSI displayed marginally significant differences between diets. The HIS was significantly (F (3,8) = 5.389, P = 0.500) higher in the KP3 diet, but KP1, KP2, and KP4 diets had no significant differences among them (Table 3). The GSI value of giant gourami was significantly (F (3,8) = 10.492, P = 0.243) different between diets, and the GSI of giant gourami fed KP3 rations was higher than if fed KP1, KP2, or KP4 diets.
The VFSI was not considerably different among the KP1, KP2, and KP4 diets. The Duncan's post-hoc test revealed that the HIS (1.30 ± 0.13%), GSI (4.15 ± 0.36%), and VFSI (2.75 ± 0.34%) were significantly higher (P < 0.05) in the KP3 diet than in the other diets.
Meanwhile, BSI showed no significant difference (P > 0.05) among the treatment diets (Table 3).
Table 3. Mean (± SD) value condition factor and body indices of giant gourami during the 90-day experimental period. Note: Numbers followed by different superscript of letters in the same row indicate a significant difference (P < 0.05). Numbers followed by superscript of the same letter in the same row showed no significant difference (P > 0.05).
Growth coefficients KP1 KP2 KP3 KP4
Condition factor (CF) 2.45 ± 0.09a 2.90 ± 0.07b 2.92 ± 0.13c 2.61 ± 0.04d
Viscerosomatic index (GSI%) 3.20 ± 0.21a 3.77 ± 0.09b 4.15 ± 0.36c 3.17 ± 0.02d Hepatosomatic (HIS%) 0.97 ± 0.05a 1.06 ± 0.19ab 1.30 ± 0.13c 1.04 ± 0.12ad Visceral fat-somatic indexes (VFSI%) 2.15 ± 0.13a 2.29 ± 0.22ab 2.75 ± 0.34c 1.74 ± 0.21ad Bilesomatic (BSI%) 10.11 ± 0.76 10.58 ± 1.01 10.48 ± 1.28 10.29 ± 0.77
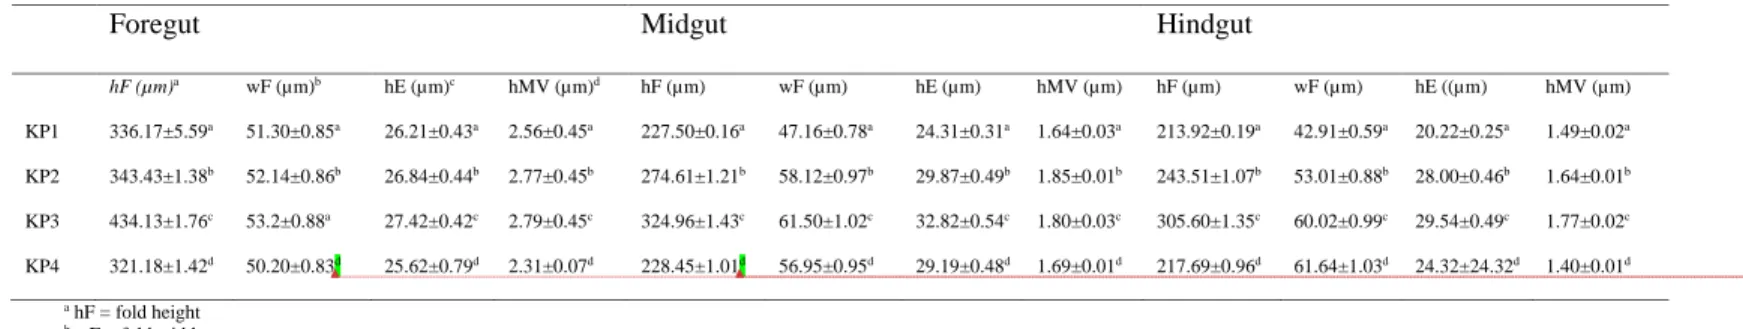
Gut micromorphology
The gut morphometric measurements of giant gourami juveniles are presented in Table 4.
Fish gut micromorphology was significantly affected by different feeds. One-way ANOVA results showed a significant effect of feed differences between groups in terms of foregut fold height (F (3.8) = 816.70, P = 0.135), foregut fold width (F (3.8) = 129.34, P = 0.974), height of the foregut (F (3.8) = 169,80, P = 0.882), and microvillus height of the foregut (F (3.8) = 56,01,
Formatted: Highlight
Commented [HJ12]: #2 – an overlooked point…as mentioned, ‘significantly’ creates a small a sense problem (on both occasions). Perhaps it s a typo and you just mean
‘significant’ (on both occasions)? Please confirm.
Formatted: Highlight Formatted: Highlight
Formatted: Highlight Formatted: Highlight
P = 0.285). The Duncan's post-hoc test demonstrated that the foregut fold height (434.13 ± 1.76 µm), fold width (53.23 ± 0.88 µm), enterocyte height (27.42 ± 0.42 µm), and microvillus height (2.79 ± 0.45 µm) were significantly higher (P < 0.05) in fish fed the KP3 diet than those fed the other diets. For the midgut, one-way ANOVA results showed a significant interaction among treatments in the case of fold height (F (3,8) = 5602.628, P = 0.055), fold width (F (3,8) = 129.341, P = 0.974), enterocyte height (F (3,8) = 169.809, P = 0.882), and microvillus height (F (3,8) = 56.016, P = 0.285). The Duncan's post-hoc test showed that the fold height of the midgut (324.96 ± 1.43 µm), fold width (61.50 ± 1.02 µm), and enterocytes (32.82 ± 0.54 µm) were significantly higher (P < 0.05) in fish fed the KP3 diet, whereas microvillus height was significantly higher in fish fed the KP2 diet (Table 4).
Fish fed the KP3 diet showed a higher fold height of the hindgut (F (3,8) = 5459.01, P = 0.066), fold width (F (3,8) = 271.94, P = 0.865), enterocyte height (F (3,8) = 299.180, P = 0.821), and microvillus height (F (3,8) = 253.57, P = 0.316).
Pond water quality
The pond water quality values of the giant gourami juvenile rearing freshwater concrete pond were recorded; water temperatures, dissolved oxygen (DO), total alkalinity, hardness, pH, and nitrates were in the range of typical values as given by WHO/FAO, as shown in Table 5.
Table 4. Gut micromorphology of giant gourami juveniles fed different diets for 90 days. Mean values with different superscript letters in the same line are significantly different (P < 0.05).
Foregut Midgut Hindgut
hF (µm)a wF (µm)b hE (µm)c hMV (µm)d hF (µm) wF (µm) hE (µm) hMV (µm) hF (µm) wF (µm) hE ((µm) hMV (µm)
KP1 336.17±5.59a 51.30±0.85a 26.21±0.43a 2.56±0.45a 227.50±0.16a 47.16±0.78a 24.31±0.31a 1.64±0.03a 213.92±0.19a 42.91±0.59a 20.22±0.25a 1.49±0.02a KP2 343.43±1.38b 52.14±0.86b 26.84±0.44b 2.77±0.45b 274.61±1.21b 58.12±0.97b 29.87±0.49b 1.85±0.01b 243.51±1.07b 53.01±0.88b 28.00±0.46b 1.64±0.01b KP3 434.13±1.76c 53.2±0.88a 27.42±0.42c 2.79±0.45c 324.96±1.43c 61.50±1.02c 32.82±0.54c 1.80±0.03c 305.60±1.35c 60.02±0.99c 29.54±0.49c 1.77±0.02c KP4 321.18±1.42d 50.20±0.83d 25.62±0.79d 2.31±0.07d 228.45±1.01d 56.95±0.95d 29.19±0.48d 1.69±0.01d 217.69±0.96d 61.64±1.03d 24.32±24.32d 1.40±0.01d
a hF = fold height
b wF = fold width
c hE = enterocyte height
d hMV = microvillus height
Table 5. The average values and range of water quality parameters in the concrete pond during the 90-days of experiment.
Water quality parameters n Mean ± SD Range WHO/FAO limits References
Water temperatures (OC) 45 28.01 ± 1.06 27 - 30 25-33 Prokoso et al.43 Dissolved oxygen (mg/L) 14 6.01 ± 0.14 5.80 – 6.20 3-5 Syandri et al.44 Total alkalinity (mg/L as CaCo3) 14 58.09 ± 3.33 52.5 - 62.5 120 Boyd et al.45 Hardness (mg/L as CaCo3) 14 66.34 ± 1.32 65 - 68.5 168 Boyd et al.45
pH 14 7.48 ± 0.19 7.2 – 7.8 6.5 – 9.0 Boyd et al.45
Nitrates (mg/L) 14 0.04 ± 0.01 0.03 – 0.05 0.2 – 219 Boyd and Tucker46
Formatted: Highlight Formatted: Highlight
Formatted: Highlight Formatted: Highlight Formatted: Highlight
Formatted: Highlight
18
Discussion
The chemical analysis of fish feed is essential because it provides valuable information to aquafeed nutritionists concerned with readily available sources of proximate and amino acid compositions, including minerals and vitamins. This study investigated the nutritional quality of fish feed enriched with three different formulation products and one as a placebo. Dietary protein levels for giant gourami ranged from 19.68 to 21.70%. Overall, the crude protein content in the feed of this study was within the ranges observed by other authors47,48,49. The giant gourami belongs to the trophic level of herbivorous fish50. Generally, herbivorous fish require a lower dietary protein level than carnivorous fish51,49. Reducing the protein content of aquafeed is one method to increase continuous fish farming, by diminishing feed costs and reducing the impact on the aquatic environment2,52. The fat content of the feed ranged from 3.41 to 3.67%, which is similar to the feed fat content for juvenile grass carp, Ctenopharyngodon idella53, and lower than the feed fat content for the herbivorous fish Ancistrus cirrhosis48 and for rearing rohu, Labeo rohita54. At the same time, the carbohydrate content of all feed treatments ranged from 26.37 to 31.19%, and the energy total (kg calorie/100 g) was between 234.41 and 240.87. Although protein content as an energy source for the maintenance and growth of giant gourami is relatively low, energy can be acquired from either protein or nonprotein sources, i.e., fat and carbohydrates.
In the present study, the commercial fish feed was enriched with natural sources, i.e., formulated products of mature coconut water and palm sap sugar fermented with various fungi (Aspergillus niger, Rhizopus oligosporus, and Saccharomyces cerevisiae). In the recent past, the dose used was 300 ml/kg of feed. This method is a new approach that has been developed by Azrita et al.9to improve feed nutrition and whole-body carcasses, covering fatty acids, the atherogenic index and thrombogenic, feed efficiency, and growth performance of giant gourami. Here, we continued the investigation by reducing the feed dose to 150 ml/kg. This study's results found that supplementing feed with newly formulated products can increase feed nutrition, covering amino acids in diet and body meat, and the growth coefficient of giant gourami. Several authors have reported increasing feed nutrition and maximizing the digestive enzyme activity of aquacultured fish by providing feed supplemented with EPA and DHA17, iodine and selenium10, methionine12, fish oil19, 11, and soybean oil20. In addition, the provision of feed has been supplemented with probiotics21, glycine, and prebiotics22.In this study, mature coconut water and palm sap sugar solution fermented with various fungi were used to supplement fish feed. In addition to coconut water
19
and palm sugar, mushrooms also play a role in increasing feed nutrition. However, it's better to use Rhizopus oligosporus. As in the present study, Varzakas55 and Vong et al.56 showed that Rhizopus oligosporus can produce various extracellular enzymes. Aspergillus niger. has a high capacity to degrade antigenic proteins,including carbohydrases, proteases, lipases, and phosphatases, when used for fermenting plant-sourced fish feed ingredients12,57. Saccharomyces cerevisiae is one of the most acclaimed microorganisms. Its effectiveness is due to its useful composition, such as "β-glucans, nucleic acids, mannan oligosaccharides and chitin," which are used for fermented ingredients7,58.
The amino acid composition can be used to assess feed quality. Leucine, arginine, and glutamic acid were the most abundant free amino acids in the KP1, KP2, KP3, and KP4 diets.
Similarly, in other studies on fish feed, such as feed for largemouth bass, Micropterus salmoides, the feeds were supplemented with glycine, prebiotics, and nucleotides in a soybean meal-based diet22. Feed for pacu, Piaractus mesopotamicus, was supplemented with an essential amino acid59, and feed for snubnose pompano, Trachinotus blochii, was supplemented with different levels of protein60. Apparently, supplementing feed with different ingredients is common, and in other species, leucine, arginine, and glutamic acid were the most abundant FAAs. Conversely, methionine levels were low in all experimental feeds. Methionine is one amino acid that must be available in fish feed because methionine is needed to protect body cells from stress. For optimal growth of juvenile hybrid grouper, 1.89% methionine is required in the feed18. The experimental feed contained 0.18–0.30%
methionine, but whether this amount is sufficient for the needs of giant gourami is poorly understood.
In the current study, the nonessential amino acid compositions were slightly higher than the essential amino acid compositions in all the experimental diets. It was higher in the KP3 diet than the other diets. In contrast, the essential amino acids of fish feed for snubnose pompano were slightly higher than the nonessential amino acids content60. This difference may be caused by differences between freshwater fish and marine fish. As in the present study, Prabu et al.60 reported that different dietary protein levels also caused different pools of FAAs, including limiting essential amino acid types in the diet59 and supplemental glycine, prebiotic, and nucleotide levels in the soybean meal-based diet22. In the present study, this difference in FAA content is caused by various mushrooms used in the formulated products.
Giant gourami juveniles fed the KP3 diet showed higher levels of glutamic acid, aspartic acid, leucine, and lysine and lower levels of tyrosine, methionine, histidine, tryptophan, and
Formatted: Highlight
Commented [HJ13]: #2 – it reads like there is a word missing before ‘feed supplemented’ if none is added
20
cystine in their carcasses than those fed other diets. The carcasses of giant gourami fed the KP3 diet showed the highest sum of FAAs compared to cultured fish fed the KP1, KP2, and KP4. The differences in the FAA profile in the whole-body carcasses of giant gourami could be related to the fungus type used in the formulated products for enriched feed. Each type of mushroom has a different function depending on the fermented fish feed ingredients and is correlated with the whole-body carcass amino acids12,57. The FAA profile differences could be related to different aspects, such as diet composition61, dietary protein level62, and methionine levels in the diet18, including the water quality of the ponds63. This study does not analyse the relationship between growth performance and FAA profile or pond water quality.
Several authors have reported that the physiological parameters of water quality and animal body composition are usually interrelated64,60. The present study did not examine whether the difference in FAAs in the whole-body carcass is correlated to pond water quality.
The lower weight gain of fish fed the KP1 diet compared to fish fed the KP2, KP3, and KP4 diets shows that a deficiency of either fungus in the formulated product for the enriched diet could lower the protein content and related sum amino acids, leading to the inhibition of giant gourami growth. In addition, it also affects feed intake and feed conversion ratios. The low protein efficiency ratio and daily growth coefficient in fish provided the insufficient KP1 diet were perhaps due to an amino acid imbalance. The amino acid content of the KP2, KP3, and KP4 diets increased, ranging from 16.88% to 17.91% after fermentation. The increase may be due in part to the increased protein content in the KP2, KP3, and KP4 diets, which was in line with the results of Jannatullah et al.57 and Li et al.12, who found that Aspergillus niger and Aspergillus awamori fermentation increased the amino acid content of soybean meal by 2.56% and 15.56%, respectively. In addition, Dawood et al.36 stated that the essential amino acid profile was changed after fermentation by Saccharomyces cerevisiae. This might result from the different fungi used having different utilization patterns for amino acids in this study. It influences the growth performance and nutrient utilization of giant gourami juveniles. We found that the methionine proportion was lower in the diets in the current study. In addition, methionine is an essential amino acid that plays a unique role in protein structure and metabolism18. It is possible that Aspergillus niger, Rhizopus oligosporus, and Saccharomyces cerevisiae fermentation promoted the conversion of specific amino acids to methionine. However, the exact mechanisms need to be studied further.
In the present study, the thermal growth coefficient (TGC) strongly correlated with the daily growth coefficient (DGC). Because faster daily fish growth requires a quality diet and