FRACTURE TOUGHNESS STUDY ON BULK METALLIC GLASSES AND
NOVEL JOINING METHOD USING BULK METALLIC GLASS SOLDER
Thesis by Jin-Yoo Suh
In Partial Fulfillment of the Requirements for the Degree of
Doctor of Philosophy
California Institute of Technology Pasadena, California
2009
(Defended December 18, 2008)
© 2009 Jin-Yoo Suh All Rights Reserved
Acknowledgements
God gives me more than I deserve.
I am so much grateful to Prof. William L. Johnson, my advisor, for his guidance and support. His passion and optimism are inspiring and his deep insight is enlightening.
It has been my great pleasure to work together and form friendship with the former and current members of the Johnson group. Prof. R. Dale Conner of California State University, Northridge has been a good friend and mentor since the beginning of my bumpy life in Caltech.
Dr. Paul Kim provided materials for the fracture experiments on monolithic BMG’s. He also gave me a lot of advices and encouragements. Dr. Marios D. Demetriou is a specialist of almost all research arenas of bulk metallic glasses. He helped me not only with many experimental skills, but also with invaluable ideas. Dr. Douglas C. Hoffman is my officemate. It has been my honor to work on the outstanding composites he invented, which are introduced in Chapter 5. I have enjoyed being his officemate. His hard work always makes a breakthrough. Prof. Boonrat Lohwongwatana is now a professor of the Chulalongkorn University in Thailand. He came up with the idea of the novel thermoplastic soldering process, which is the basis for the experimental works described in Chapter 6. Prof. Haein Choi-Yim of Sookmyung Woman’s University in Korea influenced a lot for my graduate study. Dr. Mary Laura Lind did sound velocity measurement for me. She responded quickly with whatever questions I asked. Annelen Kahl kindly taught me how to measure sound velocity. Georg Kaltenboeck helped me make thin foils of metallic glasses using the splat quencher. Aaron Wiest is very smart and passionate. He is full of joy. He always listens to me carefully. He was kind enough to do the DSC calibration for me.
Warm-hearted Joe Schramm and Glenn Garett often closed the gas valve for DSC whenever I had to run during a measurement. I also got many helps from them for the details of experiments.
Chris Veazey took me to the freezing Manhattan beach at dawn, for which I am grateful. Scott Roberts showed me how to use image-J software. Dr. Won-Kyu Lim and John Li warmly
welcomed me whenever I stopped by. Dr. Seung-Yub Lee taught me how to use Instron testing machine. Dr. Gang Duan and Dr. Donghua Xu taught me a lot at the beginning of my graduate study. Pam Albertson helped me get through any office business. Tara Scott did shopping for me quickly.
I also like to thank people of GALCIT solid mechanics group. Christian Franck showed me how to use AFM. Dr. Min Tao, Dr. Benny Poon, Dr. Jianheng Zhao, Dr. Arjun and Petros
Arakelian helped me utilize the MTS testing machine.
Dr. Daewoong Suh, a researcher of the INTEL corporation with a creative mind,
sometimes pushed me hard, but mostly inspired me harder. Thanks to the INTEL research fund that his creativity initiated and brought to us, I could keep myself as a graduate student.
Carol Garland took marvelous TEM pictures for me. I am so grateful for the discussions we had in the middle of her busy schedule. Dr. Chi Ma keeps the SEM facility in good condition so that I could use SEM as often as I wanted. Mike Vondrus is a great machinist who always responded to my rushed request. I’m really grateful to him and his wife for their care on me and my family. Ji Hun Kim, Young Shik Shin and Dr. Ju-Young Kim helped my experiments.
I thank my thesis committee: Prof. William L. Johnson, Prof. Brent Fultz, Prof. Guruswami Ravichandran, Prof. Julia R. Greer and Prof. R. Dale Conner. I also thank the professors who let me pass the candidacy exam: Prof. William L. Johnson, Prof. Brent Fultz, Prof. Marc W.
Bockrath and Prof. Wolfgang G. Knauss.
Dr. Sang Lee is the best friend of my father, who lives in Michigan. He and his wife visited my family every year and showed us their love and care.
I thank my lovely wife, Sung-Eun, and my son, Ji-Seok, for being with me. I also would like to express my appreciation to those who made good friends with my wife.
Finally, I give my deepest love to my parents, brother and sisters, in Korea. Their endless and unconditional love has encouraged and supported me ever since I was born.
Abstract
The fracture toughness of three new compositional variants of the Zr-Ti-Be-LTM (Late Transition Metal) family of bulk metallic glasses (BMG’s) are studied in the as-cast and annealed condition. Quaternary Zr-Ti-Cu-Be alloys consistently had linear elastic fracture toughness values greater than 80 MPa·m1/2, while Vitreloy 1, a Zr-Ti-Cu-Ni-Be alloy, had an average fracture toughness of 48.5 MPa·m1/2 with a large amount of scatter. The addition of iron to Vitreloy 1 reduced the fracture toughness to 25 MPa·m1/2. The Zr-Ti-Cu-Be alloy, having fracture toughness KQ = 85 MPa·m1/2 as cast, was annealed at various time/temperature combinations. When the alloy was annealed 50oC below Tg, the fracture toughness dropped to 6 MPa·m1/2, while DSC and X-ray showed the alloy to still be amorphous. Fracture surfaces were analyzed using scanning electron microscopy. The tougher samples have shown evidence of highly jagged patterns at the beginning stage of crack propagation, and the length scale and roughness of this jagged pattern correlate well with the measured fracture toughness values. These jagged patterns, the main source of energy dissipation in the sample, are attributed to the formation of shear bands inside the sample. This observation provides a strong evidence of significant “plastic zone” screening at the crack tip.
Unlike the unstable fracture behavior of monolithic BMG’s, ductile phase containing in- situ BMG composite shows stable crack growth behavior. Application of ductile BMG as a matrix for an in-situ composite with controlled microstructural characteristic length scales maximizes the toughening effect. In order to characterize this highly toughened BMG composite, the elastic-plastic fracture mechanics concept is introduced and the J-parameter is evaluated.
A novel thermoplastic bonding concept is demonstrated based on the unique rheological behavior and pattern-replication ability of bulk metallic glass forming liquids. In this approach, the bulk metallic glass is heated above Tg to the “supercooled liquid” region while a small normal force is applied to the joint. This results in liquid reflow, wetting and a strong bond. Complete
wetting between copper substrates and a layer of platinum based bulk metallic glass leads to an atomistically intimate void-free interface.
Contents
Chapter 1 Introduction, Motivations, and Key Contributions ………..… 1
1.1 Fracture toughness of Bulk Metallic Glasses (BMG’s) (Chapters 2-4)1.1.1 General issues with fracture toughness measurement 1.1.2 History of BMG fracture toughness measurement 1.1.3 Motivations and key contributions
1.2 Fracture toughness characterization of ductile phase containing in-situ BMG composite (Chapter 5)
1.3 Novel Joining method using BMG solder (Chapter 6) 1.4 Related publications
Chapter 2 Effect of composition on fracture toughness of new Zr-based Be-bearing bulk metallic glasses …….…….………. 20
2.1 Introduction2.2 Experimental
2.3 Results and Discussions 2.4 Conclusions
Chapter 3 Correlation between fracture surface morphology and toughness in Zr- based bulk metallic glasses ………. 32
3.1 Introduction3.2 Experimental
3.3 Fracture surface of bulk metallic glasses 3.4 Size of the dimple patterns
3.5 Stress state around a crack tip (surface) 3.6 Stress state around a crack tip (interior) 3.7 Formation of the shear bands
3.8 Effect of loading geometry
3.9 Size of the plastic zone and the validity of KQ as plane strain fracture toughness (KIC) 3.10 Possible effect of residual stress
3.11 Conclusions
Chapter 4 Effect of annealing on fracture toughness of a Zr-based Be-bearing bulk metallic glass ……….... 59
4.1 Introduction4.2 Experimental
4.3 Fracture toughness of annealed specimens
4.4 Elastic property change by annealing of the Zr44Ti11Cu20Be25 alloy
4.5 Comment on the universal correlation between the energy of fracture and the Poisson’s ratio (or the elastic modulus ratio, G/B)
4.6 Conclusions
Chapter 5 Fracture toughness characterization of ductile phase containing in-situ BMG composite ………... 74
5.1 Introduction5.2 Ductile phase containing in-situ BMG composite 5.3 Experimental (fracture property measurement)
5.4 Basic concept for elastic and elastic-plastic fracture mechanics
5.5 Load-displacement behavior of composites with different compositions 5.6 Comparison of two composites with different compositions
5.6.1 Crack growth estimation by unloading compliance 5.6.2 Difference in the microstructure
5.7 J-R curve evaluation with thicker specimens
5.7.1 Evaluation procedure for 5.21 mm thick specimen 5.7.2 Evaluation with 4.18 and 4.86 mm thick specimens 5.7.3 Effect of semi-solid processing
5.7.4 Effect of specimen thickness 5.8 Conclusions
Appendix 5-A Machine compliance correction for MTS test machine
Chapter 6 Novel thermoplastic bonding using bulk metallic glass solder ……… 110
6.1 Introduction6.2 Motivations and possible application to microelectronics industry 6.3 Proof of concept experiment (Effect of processing condition)
6.3.1 Experimental
6.3.2 Results and Discussions
6.4 Cross-sectional Transmission Electron Microscopy (TEM) study 6.5 Effect of pressure distribution
6.6 Interfacial reaction and fracture behavior 6.7 Applicability of other BMG’s
6.8 Conclusions
Appendix 6-A Coefficient of Thermal Expansion (CTE) of BMG’s
Appendix 6-B Electrical resistance measurement of BMG’s and solder joints
List of Figures
Figure 1-1. Effect of specimen thickness on stress and mode of fracture………...… 2 Figure 1-2. Specimen and loading geometries of (a) Compact Tension (CT) and (b) Single Edge
Notched Bending (SENB) tests………. 3 Figure 1-3. SEM micrograph of cracks developed from shear bands………..… 5 Figure 1-4. Notch toughness, KQ, as a function of notch root radius. KQ data obtained on fatigue
pre-cracked specimens (i.e., ρ ≈ 0) are enlarged in inset box………...… 6 Figure 1-5. The correlation of fracture energy G with elastic modulus ratio μ/B for all the as-cast
(unannealed) metallic glasses. In this figure,Lewandowski et al. used G for fracture energy, not shear modulus, with the formula G= K2/E/(1-ν2)). Instead, μ is used to denote the shear modulus which is generally expressed by ‘G.’………... 7 Figure 1-6. SEM backscattered electron image of in-situ composite microstructure (Inset : X-ray
diffraction pattern)………... 11 Figure 1-7. Fracture resistance curves for three composite specimens are compared with the
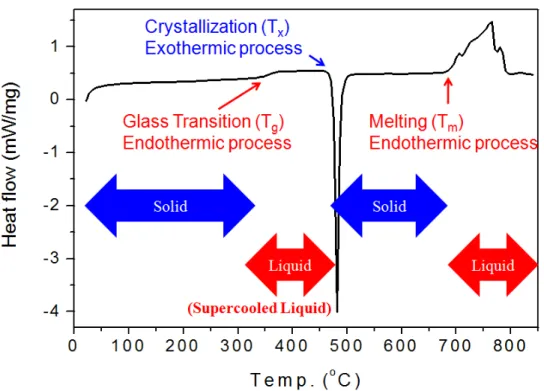
fracture toughness of the monolithic alloy (Vitreloy 1)……….. 11 Figure 1-8. SEM micrograph showing interaction of shear bands with ductile phases…………. 13 Figure 1-9. A typical Differential Scanning Calorimetry (DSC) curve of a BMG on heating….. 14 Figure 1-10. A typical equilibrium viscosity curve of a BMG (Vitreloy 1) at molten and
supercooled liquid regions………... 15 Figure 2-1. Fracture specimen after casting (left) and grinding and polishing (right)…………... 24 Figure 2-2. Effect of composition on fracture toughness………...… 25 Figure 2-3. Effect of Poisson’s ratio (ν) on fracture energy (Fracture Energy = K2/E/(1-ν2))….. 29
: Zr-based bulk metallic glasses measured in this study S: Fe-based bulk metallic glass
z: Various glasses including phosphate glasses and soda lime silicate
Figure 3-1. (a) Single edge notched bending fracture specimen geometry and dimension. (b) Viewpoint of fracture surface observation after ultimate fracture………... 36 Figure 3-2. Scanning electron micrographs of the fracture surfaces. The vertical arrows mark the
location of the initial pre-cracks. Crack propagation is from right to left in each micrograph. (a) specimen S1, (b) S2, (c) S5, (d) S7, (e) S8, (f) S11, (g) S12 and (h) S15. Measured fracture toughnesses (KQ) are shown in the parentheses for all
specimens………. 39 Figure 3-3. Fracture surface of area B (defined in Figure 3-2(a)). (a) specimen S2, (b) S7, (c) S10
and (d) S15………...……… 40 Figure 3-4. Direction of maximum shear stress and resultant slip in front of crack under mode 1
loading under (a) plane stress condition and (b) plane strain condition. (c) Shape of a surface shear band formed around the crack tip (d) Atomic Force Microscopy (AFM) scan of the area shown in (c). (e) Wavy path of crack propagation on the surface of the specimen S2. (f) Fracture surface of specimen S9 on the area shown in (c) and
(d)... 43 Figure 3-5. (a) boundary (dotted line) between fatigue pre-crack (right) and ultimate fracture (left) of specimen S5. Crack growth direction is from right to left. (b, c) matching surfaces of the boundary of specimen S1. (d) single shear band mechanism for blunting crack tip……….……… 46 Figure 3-6. Magnified image of squared area in Figure 3-2(c)……….. 51 Figure 3-7. Correlation between jagged pattern extension (denoted as LA in Figure 3-2(a)) and
process zone size calculated from Equation 3-2……….. 54 Figure 4-1. Schematic diagram of structural relaxation of BMG. As temperature decreases, the
supercooled liquid deviates from the equilibrium behavior at the glass transition point, and this deviation depends on the cooling rate………...………. 60 Figure 4-2. Effect of annealing on fracture toughness of Zr44Ti11Cu20Be25 alloy……….. 63
Figure 4-3. X-ray diffraction patterns of specimens annealed at different temperatures……..… 63 Figure 4-4. DSC curves of as-cast and annealed fracture specimens. (a) Overall and (b) magnified images………..… 64 Figure 4-5. Fracture surfaces of annealed and as-cast Zr44Ti11Cu20Be25 alloy………... 65 Figure 4-6. Change of elastic constants with annealing at 320 and 350°C……….... 69 Figure 4-7. Effect of room temperature (a) Poisson’s ratio, (b) Bulk modulus, and (c) Shear
modulus on measured fracture energy (Fracture Energy = K2/E/(1-ν2))………. 71 Figure 5-1. Typical fracture behavior of monolithic BMG……….….. 75 Figure 5-2. Infinite plate with interior crack for Griffith energy balance model………...… 79 Figure 5-3. Simple resistance curve (R-curve) when (a) material resistance is constant with crack
growth and (b) material has rising R-curve……….………… 80 Figure 5-4. Typical J-R curve for a ductile material………..……… 81 Figure 5-5. Load-displacement curves of composites with different compositions……….. 83 Figure 5-6. Crack length estimation by unloading compliance on (a) DH3 and (b) DH2*.
Triangles show crack position measured before and after fracture test………... 86 Figure 5-7. Low magnification images of fracture specimens. (a) DH3 and (b) DH2*……….... 88 Figure 5-8. Back-scattered electron images of the surfaces of fracture specimens near the crack
arresting point. (a) DH3 and (b) DH2*. Both images are taken by 1000×
magnification………... 89 Figure 5-9. Magnified back-scattered electron images of the surfaces of fracture specimens near
crack arresting point. (a) DH3 with 6000× magnification and (b) DH2* with 3000×
magnification……….……….. 90 Figure 5-10. Potential drop (electrical resistance) measurement setup for fracture specimen….. 92 Figure 5-11. 5.21 mm thick specimen of DH3 (Zr39.6Ti33.9Nb7.6Cu6.4Be12.5) after test………..…. 92
Figure 5-12. Load-displacement curve and unloading compliance lines of 5.21 mm thick
specimen……….…. 93 Figure 5-13. Crack position estimation by unloading compliance which is agreeing with crack
position before and after test measured by calipers and potential drop line in overall shape……… 94 Figure 5-14. J-R curve for 5.21 mm thick specimen………. 95 Figure 5-15. Regression curve fitting for JQ determination of 5.21 mm thick specimen……….. 98 Figure 5-16. (a) 4.18 and (b) 4.86 mm thick DH3 (Zr39.6Ti33.9Nb7.6Cu6.4Be12.5) specimens after
test………...…. 99 Figure 5-17. Crack position estimation for (a) 4.18 and (b) 4.86 mm thick specimens by
unloading compliance which is agreeing with crack position before and after test measured by calipers and potential drop line in overall shape………..…… 100 Figure 5-18. J-R curve for (a) 4.18 and (b) 4.86 mm thick specimens……… 101 Figure 5-19. Load-displacement curves of four specimens with different thickness………….. 102 Figure 5-20. Fracture data of four specimens with different thickness expressed in stress intensity
factor (K) and a curve showing limitations of specimen dimension for valid JIC
evaluation………...……… 104 Figure 5A-1. Correlation between ram displacement and LVDT output voltage……… 107 Figure 5A-2. Difference between ram displacement reading and LVDT displacement reading as a
function of load applied……….……… 108 Figure 5A-3. A linear function to correct the machine and fixture compliance………..……… 109 Figure 5A-4. Effect of machine and fixture compliance correction on load-displacement
curve……….………. 109 Figure 6-1. Schematic diagram showing the concept of “Thermoplastic bonding.”…………... 113 Figure 6-2. Copper-solder-copper stack with thermocouple after processing. Inset: schematic
diagram showing experimental configuration………..………. 114
Figure 6-3. Back scattered images of both fracture surfaces of joints produced with 36.5N at (a) 290°C and (b) 300°C. By the compositional contrast, copper surface looks dark and platinum based BMG surface looks bright. The circle marks show ‘contact zone’ with 3-mm diameter. Squared areas marked as from A to E indicate where EDS scans were performed. (listed in Table 6-2.)………..……….. 117 Figure 6-4. High resolution fractography on BMG solder residues produced by (a) 36.5N at
290°C, (b) 36.5N at 300°C, (c) 14.2N at 290°C and (d) 14.2N at 300°C. Scale bars in (a-c) for 200 nm (100,000× magnification) and (d) for 100 nm (200,000×
magnification)………...………. 119 Figure 6-5. X-ray diffraction patterns of fracture surface of joints produced with 36.5N at (a)
290°C (surface shown in Figure 6-3(a-2)) and (b) 300°C (surface shown in Figure 6- 3(b-2))………..……….. 119 Figure 6-6. TEM images of BMG solder part processed at 300°C, with load of 36.5 N, specimen
shown in Figure 6-3(b). (a) spot pattern, (b) bright field image and (c) dark field image of the same place shown in (b). (Magnification: 220,900×)………….…….. 122 Figure 6-7. Interface between copper substrate and BMG solder in specimen processed at 300°C
with 36.5 N load………..……….. 123 Figure 6-8. The solder-copper interface shown at (a) low magnification (15,400×), (b) high
magnification (523,000×) and (c) high resolution (5,335,000×)………... 124 Figure 6-9. Rim part of the specimen shown in Figure 6-3(b-2). Inset: Overall specimen cross-
section having small square mark on the right side. This small square is where this figure is taken from……… 126 Figure 6-10. Magnified images of interface shown in Figure 6-9 and Figure 6-3(b-2), produced at
300°C with a load of 36.5N. (a) Upper part of the specimen. Boundary between the Pt-BMG solder and molding compound. (b) Lower part of the specimen. Boundary
between the Pt-BMG solder and copper substrate. (a-1) and (b-1) are secondary electron images. (a-2) and (b-2) are back-scattered electron images……….... 128 Figure 6-11. Magnified images of interface of the specimen shown in Figure 6-3(a-2), produced
at 290°C with a load of 36.5N. (a) Upper part of the specimen. Boundary between the Pt-BMG solder and molding compound. (b) Lower part of the specimen. Boundary between the Pt-BMG solder and copper substrate. (a-1) and (b-1) are secondary electron images. (a-2) and (b-2) are back-scattered electron images…………..….. 129 Figure 6-12. (a) Back-scattered electron image of interface between Pt-BMG solder and Cu
substrate after tension test, showing cavities nucleated and expanded. (b) magnified secondary electron image of the cavity squared in (a)……….. 131 Figure 6-13. Matching fracture surfaces of a joint processed at 300°C. (a) Fracture surface of Pt-
BMG side. Central area has copper residue pulled out by tension (b) Exposed pure copper surface surrounded by Pt-BMG residue still sticking to the copper
surface……… 132 Figure 6-14. Fracture surface of a joint processed at 300°C. All images are taken by back-
scattered electron detector. (a) Pt-BMG solder and (b) copper substrate. (c) higher magnification image of Pt-BMG surface showing compositional contrast……...… 132 Figure 6-15. DSC scans of the Au48Ag5.5Pd2.3Cu26.9Si16.3Ti1 alloy solder pieces after joining
process. Right side of the figure shows cross-sectional shape change of each solder specimen by the process……… 135 Figure 6-16. Time-temperature-transformation (TTT) diagram of Pt-based and Au-based
glasses……… 136 Figure 6-17. La-based BMG joint after tension test (diameter of the copper cylinders is 6.35
mm)………...……. 136 Figure 6A-1. Schematic diagram of CTE measurement setup………... 141
Figure 6A-2. Heating and cooling cycles repeated three times on a high purity copper cylinder with 6.35 mm diameter and 6.09 mm height. (a) Probe position and temperature plotted as a function of time and (b) Probe position as a function of
temperature………...………. 142
Figure 6A-3. Derivative of probe position by temperature……….. 143
Figure 6A-4. Linear coefficient of thermal expansion (CTE) of BMG’s……… 144
Figure 6A-5. Relationship of CTE’s between pure metal and BMG………...… 145
Figure 6B-1. (a) Schematic diagram of electrical resistance measurement performed in this chapter and (b) actual specimen setup………...…… 147
Figure 6B-2. Electrical resistance (Voltage drop) measurement for a Ni wire for verification.. 148
Figure 6B-3. Electrical resistance (Voltage drop) measurement for a Vitreloy 1 plate……...… 148
Figure 6B-4. Electrical resistance (Voltage drop) measurement for a Pt-BMG plate……….… 149
List of Tables
Table 1-1. Typical values of KIC……….. 5 Table 2-1. Thermal, elastic and mechanical properties of Zr-based BMG’s……….…… 24 Table 2-2. Experimental conditions and data of BMGs used in this study. a0: initial crack length
(a0 = length of notch + length of fatigue precrack), KQ: Fracture toughness calculated using critical fracture load, G: shear modulus, ν: Poisson’s ratio………... 26 Table 3-1. Experimental conditions and data of BMGs used in this study……….... 37
a0: initial crack length (a0 = length of notch + length of fatigue pre-crack).
LA : size of the plastic zone as defined in Figure 2(a).
The process zone size is calculated from KQ 2/π/σy
2 (see Equation 2)
Table 4-1. Measured thermal properties of as-cast and annealed specimens……… 65 Table 4-2. Relationship between calorimetric and ultrasonic data………...……. 69 Table 5-1. Physical properties of different composites. Dendrite volume fraction, yield stress,
Young’s modulus and Poisson’s ratio………. 83 Table 5-2. Dimensions of fracture test specimens and fracture test results………... 84
a0 denotes initial pre-crack length (notch + pre-crack).
Typical 3-pt bending specimen is illustrated in Figure 3-1.
G = (Area of load-disp. curve)/(thick × Δa) and G = K2/E × (1-ν2).
Table 6-1. Bonding process condition and experimental results……….……… 115 Table 6-2. Compositional information by Energy Dispersive Spectroscopy (in at.%)……….... 117 Table 6-3. Thermal properties of Au-based and La-based BMG’s……….……. 134 Table 6A-1. Linear coefficient of thermal expansion (CTE) of BMG’s……….……… 143 Table 6A-2. Linear CTE of pure metals at 25°C………. 144
Chapter 1
Introduction, Motivations, and Key Contributions
1.1 Fracture toughness of Bulk Metallic Glasses (BMG’s) (Chapters 2-4) 1.1.1 General issues with fracture toughness measurement
Fracture toughness evaluates the resistance of an existing crack against further growth under externally applied load. Fracture toughness has been one of the key material properties for structural applications because all structural parts are likely to have defects such as micro-cracks during service. Despite its importance, fracture toughness is not very well understood by the structural materials research community and its measurement is performed much less frequently than other typical material testing methods such as tension, compression and bending tests because of the intrinsic complexity of the concept and difficulties of the actual measurement, some of which are discussed in the following paragraphs.
(1) Unlike other testing methods, fracture toughness tests involve introducing a certain type of crack into the specimen. Due to the almost infinite number of combinations that initial crack shape and specimen geometry can create, the typical fracture parameter known as K, the stress intensity factor, is used to describe the stress distribution around a crack of given geometry in a body containing the crack. In other words, two different cracks in two different bodies with different geometries have the same stress distribution in around the cracks if their stress intensity factors, K’s, are defined to be the same. Solutions of K for hundreds of given crack-specimen geometries can be found from reference books [1, 2], among which, three geometries are defined for standard testing methods in structural metallic materials by ASTM E399 and E1820.
(2) Another complexity arises from plastic deformation in front of a crack due to extremely high stress concentration caused by the crack. The amount of plastic deformation occurring around the crack tip area influences the fracture toughness measurement significantly. As shown in Figure 1-1, thinner specimens tend to resist crack propagation more than thicker specimens by dissipating energy via plastic deformation. The plastic deformation originates from the surface earlier than inside and then spreads to the inside. This is due to reduced constraints on the surface (plane stress condition) which increases deviatoric or maximum shear stress terms. As the specimen thickness increases, the contribution of the surface layer deformation decreases and the thickness dependence is negligible over a critical thickness. Plane strain fracture toughness (KIC) is then defined by this thickness independent fracture toughness in order to provide a size- independent material property.
Figure 1-1. Effect of specimen thickness on stress and mode of fracture [3].
Figure 1-2. Specimen and loading geometries of (a) Compact Tension (CT) and (b) Single Edge Notched Bending (SENB) tests.
The specimen size requirement for metallic materials defined by ASTM E399 is given by Equation 1-1. B, a, and (W-a), are defined in Figure 1-2, and represent specimen thickness, initial crack length and initial ligament length (initially uncracked region), respectively. A material with more resistance to crack propagation (KQ ↑) and with less yield stress (σY ↓) requires thicker and larger specimens to interpret the measured critical stress intensity factor (KQ) as a plane strain fracture toughness (KIC). The size requirement applies to both Compact Tension (CT) and Single Edge Notched Bending (SENB) geometries which are typical standard geometries for fracture toughness measurement (Figure 1-2). The size requirement implies that the size of the plastic zone must be less than 2% of the specimen dimensions in order to obtain a size-independent critical KIC value [4].
B, a, (W-a) ≥ 2.5 ⋅ (KQ/σy)2 Equation 1-1.
(3) Finally, ASTM standards for fracture toughness measurement require a sharp crack as an initial crack. Since the sharp crack cannot be achieved by conventional machining methods, the only way to generate a sharp crack in front of a notch as depicted in Figure 1-2 is by cyclic fatigue loading. A sharp crack generated in front of the notch is called a ‘pre-crack’. Fracture
toughness data acquired without a pre-crack is called ‘notch toughness’ and, generally, is not accepted as standard fracture toughness (KIC).
1.1.2 History of BMG fracture toughness measurement
Even before the early report of bulk metallic glass forming alloy, Vitreloy 1 [5],
mechanical properties including fracture properties of metallic glasses in the form of melt spun ribbon with thickness less than 150 microns had been studied [6-9]. However, thin ribbon specimens have limited validity as standard measurements especially when the ribbon is tough.
After the discovery of Vitreloy 1 [5], rigorous fracture toughness measurements on this alloy were performed by various research groups [10-14]. Although there was a significant scatter within the early stage fracture data, 16∼55 MPa⋅m1/2, the evaluated plane strain fracture toughness number is pretty because it is comparable to that of conventional crystalline metals as shown in Table 1-1 [15]. However, it is also well known that BMG’s have almost zero ductility in tension.
The unusual combination of zero ductility but high fracture toughness has been attributed to the formation of a high density of shear bands in front of a crack based on observation of shear band networks that evolved on the outer surfaces of specimens [16] as shown in Figure 1-3. However, this observation is based on shear bands formed on surfaces where the plane stress condition dominates.
Table 1-1. Typical values of KIC [15].
Material Yield strength (MPa)
Fracture toughness KIC (MPa⋅m1/2)
4340 steel 1470 46
Maraging steel 1730 90
Ti‐6Al‐4V 900 57
2024‐T3 Al alloy 385 26
7075‐T6 Al alloy 500 24
Figure 1-3. SEM micrograph of cracks developed from shear bands [16].
Figure 1-4. Notch toughness, KQ, as a function of notch root radius. KQ data obtained on fatigue pre-cracked specimens (i.e., ρ ≈ 0) are enlarged in inset box [10].
Among the early measurements for Vitreloy 1, the report by Lowhaphandu et al. [10]
compared fracture behavior of pre-cracked specimen with those of various notch root radii. As shown in Figure 1-4, the fracture toughness of this BMG was 18.4 MPa⋅m1/2 with a sharp pre- crack, but increased to 130 MPa⋅m1/2 by using a notch instead of a pre-crack.
Later, additional BMG’s were measured using notch toughness measurements [17-20].
Together with reports on melt spun ribbon toughness [8, 9], this is shown in Figure 1-5,
Lewandowski et al. [21] have proposed a universal correlation between the energy of fracture and the Poisson’s ratio (or the elastic modulus ratio G/B) for various metallic glasses. They even showed that the fracture toughness data for annealed BMG’s are fit by the proposed universal correlation. However, the data collected in their report [8, 9, 17-20, 22] were not consistent in the testing method used. Furthermore, the annealing experiments used for the fracture toughness study [19] caused crystallization or partial crystallization of specimens [23] which, in turn, increases shear modulus and decreases Poisson’s ratio much more than structural relaxation
annealing (causing no crystallization) generally does [24]. Therefore, it appears that a more rigorous study is required to establish such a universal correlation in the BMG systems.
Figure 1-5. The correlation of fracture energy G with elastic modulus ratio μ/B for all the as-cast (unannealed) metallic glasses [21]. In this figure,Lewandowski et al. used G for fracture energy, not shear modulus, with the formula G= K2/E/(1-ν2). Instead, μ is used to denote the shear modulus which is generally expressed by ‘G.’
1.1.3 Motivations and key contributions
As stated above, there are still unsolved problems in understanding of the fracture toughness of BMG’s especially regarding the major determining factors for fracture toughness.
Part of this thesis is devoted to address the following issues:
(1) The effect of composition on fracture toughness. (Chapter 2)
(2) Evidence for the existence of a plastic zone in front of crack. (Chapter 3)
(3) The relationship between fracture toughness and structural relaxation. (Chapter 4)
In chapter 2, three new compositional variants of the Vitreloy 1 are discussed. Not only is this work the first report on the effect of compositional variation on fracture toughness, but the work also proves the effectiveness of fracture toughness measurements for evaluating the mechanical stability of BMG’s. It is found that fracture toughness is the most distinguishing parameter to characterize BMG alloys (in contrast to other mechanical properties.) In other words, while properties such as elastic modulus and compressive yield strength show only weak
variation with alloy composition, fracture toughness varies much more significantly.
In chapter 3, through detailed observation of fracture surfaces, the existence of a plastic zone screening the crack tip is found. This ‘plastic zone’ exhibiting jagged patterns caused by the operation of shear bands inside fracture specimen is the main source of energy dissipation during a fracture test. The length and roughness of this plastic zone features correlate well with the measured fracture toughness values.
In chapter 4, the embrittlement of a tough BMG is studied by fracture toughness and elastic property measurements. While maintaining glassy structure, the fracture toughness drops
significantly by relaxing the glassy structure into lower temperature.
Through this research, better understanding of the fracture behavior of BMG’s has been acquired. It appears that the previously proposed simple universal correlation between fracture energy and Poisson’s ratio [21] cannot generally explain the fracture behavior of BMG system.
1.2 Fracture toughness characterization of ductile phase containing in-situ BMG composite (Chapter 5)
Although BMG’s are known to have high fracture toughness, the fracture behavior of the monolithic BMG’s is unstable under tension loading. Discovery of ductile phase containing in- situ BMG composites [25, 26] were the first reported BMG materials with tensile ductility. This composite microstructure forms by the solidification of a dendritic Zr-Ti rich β-phase with a body centered cubic structure followed by subsequent vitrification of remaining liquid to form a glassy matrix (Figure 1-6). Both phases are formed by processes predictable from a pseudo-binary phase diagram [27]. Both phases (glass and crystal) form during cooling and show atomically sharp, intimate and apparently strong interfaces. The fracture toughness evaluation of these in-situ composites has been reported [28]. Although the reported fracture toughness values were not very high, as shown in Figure 1-7, fracture resistance curves as a function of crack extension (R- curves) show stable crack growth from a sharp fatigue pre-crack during fracture testing. The steeply rising R-curve of the composite can be attributed to a marked increase in fracture resistance with crack extension.
Figure 1-6. SEM backscattered electron image of in-situ composite microstructure (Inset : X-ray diffraction pattern) [25].
Figure 1-7. Fracture resistance curves for three composite specimens are compared with the fracture toughness of the monolithic alloy (Vitreloy 1) [28].
Recently, significant improvements in the mechanical properties of ductile phase
containing in-situ BMG composites have been achieved by Hofmann et al. [29, 30]. Compared to the previous in-situ composites developed by Kim et al. [25, 26], the new BMG composites have the following features:
(1) Increased Ti content and removal of Ni to reduce density. Removal of Ni is also known to enhance fracture toughness of the glass and suppress possible nucleation of brittle intermetallic crystalline phases during processing [31-33].
(2) A homogeneous and coarsened microstructure. Earlier composite has cooling rate dependent microstructures. Ingots cooled from above the alloy liquidus showed large variation in the overall dendrite length scale and interdendrite spacings. In order to produce a uniform microstructure, cooling from the molten state (T > 1100°C) is interrupted at the temperature in the semi-solid two-phase region (T=∼800-900°C) between the alloy liquidus and solidus temperature. The sample is held isothermally for several minutes in this region. The isothermal hold in the two-phase region allows the nucleation, growth, and coarsening of the ductile dendrite phase to approach thermodynamic equilibrium prior to final quenching. After the isothermal hold, the semi-solid mixture is cooled to vitrify the remaining liquid phase, and obtain a coarse and uniform dendrite distribution.
(3) The length scale of the dendritic phase is on the order of the length scale of deformation in the glass matrix. With softer dendrite phases deforming first and, subsequently initiating shear bands into the BMG matrix, interdendrite distance is limited to below a characteristic length scale [34, 35]. Matching of microstructural length scales to this characteristic length scale limits shear band extension, suppresses shear band opening, and avoids crack development. The composite microstructure, with softer dendrites, creates short (stable) and dense shear bands rather than long (unstable) and sparse shear bands. This mechanism is illustrated in Figure 1-8.
Figure 1-8. SEM micrograph showing interaction of shear bands with ductile phases [29].
As shown above, these in-situ composites show stable crack growth behavior unlike the monolithic BMG’s. To compare these new composites with other tough conventional crystalline materials, it is necessary to evaluate the fracture properties using standard elastic-plastic fracture mechanics parameters. Chapter 5 describes the fracture behavior of the newly developed in-situ composites and the evaluation procedure for the elastic-plastic fracture mechanics parameter, J.
This work is the first reported “J-integral” evaluation applied to the BMG systems and provides a basis for placing the new in-situ BMG composites among the toughest known materials.
1.3 Novel Joining method using BMG solder (Chaper 6)
One of the characteristics of BMG is the existence of a supercooled liquid region between glass transition (Tg) and crystallization (Tx) temperatures on heating. Figure 1-9 shows a typical Differential Scanning Calorimetry (DSC) curve on heating of a BMG. In between Tg and Tx, the supercooled liquid region exists. The state of the BMG in this region is a viscous liquid and the atomic configuration of the BMG easily rearranges to accommodate plastic flow.
Figure 1-9. A typical Differential Scanning Calorimetry (DSC) curve of a BMG on heating.
Figure 1-10. A typical equilibrium viscosity curve of a BMG (Vitreloy 1) at molten and supercooled liquid regions [36].
As shown in Figure 1-10, the viscosity of a BMG is described by a single curve as a function of temperature in two different regions, the high temperature melt and the supercooled liquid. Although the viscosity of the supercooled liquid is higher than that of the molten BMG, supercooled liquids have sufficient fluidity to exhibit flow under small applied pressures. The viscosity of the supercooled liquid of a BMG can be as low as 6×10⁴ Pa⋅s, similar to that of viscous polymer melts [32]. The fluidity of a supercooled BMG forming liquid also makes micron-sized pattern replication possible [37]. Thus it is reasonable to expect that the supercooled BMG forming liquid can wet and bond to another metal surface during this configurational
rearrangement process. As shown in Figure 1-9, the bonding product processed in the supercooled liquid region is expected to have different characteristics from that of the
conventional soldering product in which the crystalline solder melts completely to form a joint, because the present process temperature is much lower than the equilibrium melting temperature of the solder. This low temperature soldering concept may appeal to the microelectronics industry in particular, because the solders in microelectronics generally suffer the high homologous temperature in service. This aspect is discussed more in Chapter 6.
In chapter 6, a novel thermoplastic bonding concept is demonstrated based on the unique rheological behavior and pattern-replication ability of bulk metallic glass forming liquids. This work is the first report of joining metals using a BMG in the supercooled liquid state. To the author’s knowledge, no work on this concept has been reported. Although this work was initially motivated by the urge to replace the current soldering technology in microelectronics industry, the present result is probably applicable to range of materials to be bonded together with different classes of BMG.
1.4 Related publications Chapter 2
C.P. Kim, J.-Y. Suh, A. Wiest, M.L. Lind, R.D. Conner and W.L. Johnson, Fracture toughness study of new Zr-based Be-bearing bulk metallic glasses, Scripta Materialia 60 (2008) 80-83.
This paper reported the development of new alloys, their thermal properties and
mechanical properties. The author contributed to this paper by performing mechanical property evaluation.
Chapter 3
J.-Y. Suh, C.P. Kim, R.D. Conner, M.D. Demetriou and W.L. Johnson, Correlation between fracture surface morphology and toughness in Zr-based bulk metallic glasses, submitted to Acta Materialia.
Chapter 5
D.C. Hofmann, J.-Y. Suh, A. Wiest, G. Duan, M.L. Lind, M.D. Demetriou and W.L.
Johnson, Designing metallic glass matrix composites with high toughness and tensile ductility, Nature 451 (2008) 1085-1089.
The author evaluated fracture property of the novel composite alloys.
Chapter 6
J.-Y. Suh
, B. Lohwongwatana, C.M. Garland, R.D. Conner, W.L. Johnson and D. Suh, Novel thermoplastic bonding using a bulk metallic glass solder, Scripta Materialia 59 (2008) 905-908.References
[1] H. Tada, P.C. Paris and G.R. Irwin, The stress analysis of cracks handbook, 2nd ed. (Paris Production and Del Research Corp., 1985).
[2] Y. Murakami, Stress Intensity Factors Handbook (Oxford Pergamon Press, 1987).
[3] G.E. Dieter, Mechanical Metallurgy, 3rd ed. (McGraw-Hill, 1986) p.357.
[4] T.L. Anderson, Fracture Mechanics: Fundamentals and Applications, 1st ed. (CRC Press, 1991) p.431.
[5] A. Peker, W.L. Johnson, Appl. Phys. Lett. 63 (1993) 2342.
[6] A.T. Alpas, L. Edwards and C.N. Reid, Metall. Trans. 20A (1989) 1395.
[7] D.G. Ast and D. Krenitsky, Mater. Sci. Eng. 23 (1976) 241.
[8] L.A. Davis, Metall. Trans. 10A (1979) 235.
[9] C.H. Shek, G.M. Lin, K.L. Lee and J.K.L. Lai, J. Non-Cryst. Solids 224 (1998) 244.
[10]. P. Lowhaphandu and J.J. Lewandowski, Scripta Mater. 38 (1998) 1811.
[11]. C.J. Gilbert, V. Schroeder and R.O. Ritchie, Met. Mat. Trans. 30A (1999) 1739.
[12]. D. Suh and R.H. Dauskardt, J. Non-Cryst. Solids 317 (2003) 181.
[13]. D. Suh and R.H. Dauskardt, Ann. Chim. Sci. Mat. 27 (2002) 25.
[14]. R.D. Conner, A.J. Rosakis, W.L. Johnson and D.M. Owen, Scripta Mater. 37 (1997) 1373.
[15] G.E. Dieter, Mechanical Metallurgy, 3rd ed. (McGraw-Hill, 1986) p.353.
[16] K.M. Flores and R.H. Dauskardt, Scripta Mater. 41 (1999) 937.
[17] X.K. Xi, D.Q. Zhao, M.X. Pan, W.H. Wang, Y. Wu and J.J. Lewandowski, Phy. Rev. Lett.
94 (2005) 125510.
[18] P. Wesseling, T.G. Nieh, W.H. Wang and J.J. Lewandowski, Scripta Mater. 51 (2004) 151.
[19] J.J. Lewandowski, Mater. Trans. JIM 42 (2001) 633.
[20] J. Schroers and W.L. Johnson, Phys. Rev. Lett. 93 (2004) 255506.
[21] J.J. Lewandowski, W.H. Wang and A.L. Greer, Phil. Mag. Lett. 85 (2005) 77.
[22] P.A. Hess, S.J. Poon, G.J. Shiflet, R.H. Dauskardt, J. Mater. Res. 20 (2005) 783.
[23] W.H. Wang, R.J. Wang, W.T. Yang, B.C. Wei, P. Wen, D.Q. Zhao and M.X. Pan, J. Mater.
Res. 17 (2002) 1385.
[24] W.L. Johnson, M.D. Demetriou, J.S. Harmon, M.L. Lind and K. Samwer, MRS Bull. 32 (2007) 644.
[25] C.C. Hays, C.P. Kim and W.L. Johnson, Phys. Rev. Lett. 84 (2000) 2901.
[26] F. Szuecs, C.P. Kim and W.L. Johnson, Acta Mater. 49 (2001) 1507.
[27] S.Y. Lee, C.P. Kim, J.D. Almer, U. Lienert, E. Ustundag and W.L. Johnson, J. Mater. Res.
22 (2007) 538.
[28] K.M. Flores, W.L. Johnson and R.H. Dauskardt, Scripta Mater. 49 (2003) 1181.
[29] D.C. Hofmann, J.-Y. Suh, A. Wiest, G. Duan, M.L. Lind, M.D. Demetriou and W.L.
Johnson, Nature 451 (2008) 1085.
[30] D.C. Hofmann, J.-Y. Suh, A. Wiest and W.L. Johnson, Scripta Mater. 59 (2008) 684.
[31] R.D. Conner, W.L. Johnson, Scripta Mater. 55 (2006) 645.
[32] G. Duan, A. Wiest, M.L. Lind, J. Li, W.-K. Rhim and W.L. Johnson, Adv. Mater. 19 (2007) 4272.
[33] C.P. Kim, J.-Y. Suh, A. Wiest, M.L. Lind, R.D. Conner and W.L. Johnson, Scripta Mater. 60 (2008) 80.
[34] R.D. Conner, W.L. Johnson, N.E. Paton and W.D. Nix, J. Appl. Phys. 94(2) (2003) 904.
[35] R.D. Conner, Y. Li, W.D. Nix and W.L. Johnson, Acta Mater. 52 (2004) 2429.
[36] T.A. Waniuk, R. Busch, A. Masuhr and W.L. Johnson, Acta Mater. 46 (1998) 5229.
[37] J. Schroers, Q. Pham and A. Desai, J. Mems 16 (2007) 240.
Chapter 2
Effect of composition on fracture toughness of new Zr-based Be-bearing bulk metallic glasses
Three new compositional variants of the Zr-Ti-Be–LTM (late transition metal) family of metallic glasses are discussed. Thermal stability, ΔT=Tx-Tg, was increased from 82°C for Zr41.2Ti13.8Cu12.5Ni10Be22.5 (Viterloy 1) to 141°C for Zr44Ti11Cu20Be25. It is found that fracture toughness is the most distinguishing parameter characterizing the alloys in contrast to other mechanical properties. Quaternary alloys consistently had fracture toughness values exceeding 80MPa·m1/2, while for Vitreloy 1 KQ=48.5MPa·m1/2 with a large amount of scatter. Adding iron reduced the fracture toughness to 25MPa·m1/2.
2.1 Introduction
Vitreloy 1 (Zr41.2Ti13.8Cu12.5Ni10Be22.5) [1], the first commercial Bulk Metallic Glass (BMG), has been the subject of extensive research in scientific and engineering fields. Vitreloy 1 may be cast into rods 25 mm in diameter [2], which exceeds that of most bulk glass forming alloys. It has high thermal stability; ΔT, the difference between a glass transition temperature (Tg) and a crystallization temperature (Tx), is as large as 82°C [3], high yield strength, and high fracture toughness [4-8].
In recent studies on Zr-based Be-bearing BMGs, a number of new alloys with superior thermal stability and comparable glass forming ability have been reported [9-11]. Furthermore, a correlation between a compositional ratio of (Zr,Ti) to other elements and the elastic properties was established in these Vitreloy-like Zr-based Be-bearing alloys [9]. The elastic properties of BMGs are important because mechanical yielding of BMG is strongly correlated with shear modulus (G) [12] and, in some systems, fracture toughness correlates well with Poisson’s ratio (ν) [13].
Historically, compression tests have been a prevailing evaluation method for BMGs.
However, frictional forces due to closing stresses stabilize shear bands, giving rise to multiple shear bands and global plasticity, which obscures the real stability with respect to failure along an individual shear band during deformation [14]. By comparison, fracture toughness is a measure of the resistance of an existing crack to propagation under an opening or shear stress. Mode-1 fracture toughness evaluates crack resistance under opening loads by where shear bands and opening cracks are less stable than in compression. Although all monolithic BMGs under tensile loading show virtually zero ductility, BMGs have often exhibited relatively high fracture toughness [13,15]. Fracture testing is a desirable method to distinguish and evaluate various BMGs, however limited fracture toughness data on BMGs is available, primarily because most
BMGs lack the robust glass forming ability needed to make the large samples required for fracture toughness testing. Among Zr-based Be-bearing alloys, only one alloy system other than Vitreloy 1 has been studied [16]. No studies have yet been reported regarding the effect of compositional variation on fracture toughness.
In this study, we assess the effect of composition variations on the fracture toughness on Zr-based Be-bearing alloys. Three new alloys have been developed with high glass forming ability as evidenced by a more than 15 mm critical casting thickness. Two alloys,
Zr33.5Ti24Cu15Be27.5 (Var1) and Zr44Ti11Cu20Be25 (Var2), are 4-component (quaternary) alloys without Ni and Zr44Ti11Cu9.3Ni10.2Be25Fe0.5 (Var3) is 6-component alloy with Fe as an additional microalloying element. Var 2 and Var 3 are most closely related to Zr44Ti11Ni10.2Cu9.8Be25 (known as Vitreloy 1b) [3]. Vitreloy 1b has lower glass forming ability than Vitreloy 1 but a larger ΔT.
The (Zr,Ti) concentration in these alloys is maintained at ∼55 atomic %, which minimizes the variation in elastic properties [9]. Elastic, thermal and mechanical properties of these alloys were evaluated and compared with those of Zr41.2Ti13.8Cu12.5Ni10Be22.5 (Vitreloy 1) to reveal the effect of compositional variation.
2.2 Experimental
Mixtures of elements were alloyed by arc melting under a Ti-gettered argon atmosphere to make BMG ingots. Compression and fracture toughness specimens were prepared by vacuum injection casting BMG ingots into Cu-molds (Figure 2-1). The nominal dimension of the fracture samples was 2.5 mm × 8 mm × 36 mm. The mold incorporated a 2 mm protrusion to form the notch. Approximately 0.15 mm on the faces of each sample was removed from the surface by lapping and polishing, reducing the thickness of each specimen to 1.9∼2.2 mm. This procedure
reduces the effects of residual stress resulting from the casting process. A 5-Hz cyclic load was applied to grow a fatigue precrack using an MTS servohydraulic load frame equipped with a 3-pt bend fixture having a 31.75 mm span. Applying a load of approximately ΔK≅10 MPa⋅m1/2 and Kmin/Kmax≅0.2, a 1.2∼2.5 mm long pre-crack was obtained after 40,000-150,000 cycles. Starting with an initial crack length of ∼3.2-4.5 mm (the sum of the notch length and pre-crack), a quasi- static compressive displacement of 0.3 mm/min (K∼40 MPa⋅m1/2/min) was applied and the load response of the pre-cracked sample was measured. Fracture toughness, KQ, was calculated using the formula given by ASTM E399.A3. Here we use KQ to denote fracture toughness rather than KIC because the sample thicknesses did not guarantee plane strain condition in all cases. The pulse-echo overlap technique with 25MHz piezoelectric transducers was used to measure the shear and longitudinal wave speeds at room temperature enabling calculation of the elastic constants. Sample density was measured by the Archimedean technique according to the ASTM C693-93. Compression tests were performed at room temperature on the Instron 5500R load frame using cylindrical samples of 4 mm diameter, heights from 7 mm to 9 mm, and an aspect ratio close to 1:2. The tests were done with a constant crosshead speed of 0.1 mm min-1. Thermal properties of all alloys were evaluated using differential scanning calorimetry (DSC) at a heating rate of 20K/min. X-ray analysis was performed on a X’Pert Pro x-ray diffractometer to confirm the amorphous nature of samples.
Figure 2-1. Fracture specimen after casting (left) and grinding and polishing (right).
2.3 Results and Discussions
Thermal and elastic properties of the 3 new alloys and Vitreloy 1 are presented in Table 2- 1. Glass transition temperatures (Tg) for quaternary Zr-Ti-Cu-Be alloys (Var1 and Var2) are lower than that of Vitreloy1 while the addition of iron to Vitreloy 1 had minimal effect on Tg. On the other hand, these compositions show increased crystallization temperature (Tx), and increased ΔT up to 141°C. Var2 and 3 were derived from a Zr44Ti11Ni10.2Cu9.8Be25 (Vitreloy 1b) alloy which has ΔT of 132°C [3]. ΔT is increased by replacing Ni with Cu (Var2), but decreased with the addition of 0.5% Fe in place of Cu (Var3).
Table 2-1. Thermal, elastic and mechanical properties of Zr-based BMG’s.
Tg
(°C) Tx
(°C) ΔT ρ (g/cc)
G (GPa)
B (GPa)
E
(GPa) ν σy
(GPa) Zr33.5Ti24Cu15Be27.5(Var 1) 333 447 114 5.58 36.8 113 99.6 0.353 1.75 Zr44Ti11Cu20Be25 (Var 2) 340 481 141 6.03 35.3 111.2 95.8 0.356 1.8 Zr44Ti11Cu9.3Ni10.2Be25Fe0.5(Var 3) 348 472 124 6.05 35.7 112.2 96.8 0.356 1.86 Zr41.2Ti13.8Ni10Cu12.5Be22.5 (Vitreloy 1) 350 432 82 6.09 35.7 115.3 97.1 0.360 1.86
All four alloys have nearly identical elastic properties. This agrees well with the report of Duan et al. [9] in which the dependence of elastic properties on the ratio of (Zr,Ti) to other elements were observed. Yield stresses measured by compression test of Var1 and 2 alloys are slightly lower than the known value of Vitreloy 1 [12] while Var3 alloy has almost identical yield stress to Vitreloy 1. This is not surprising considering the compositional similarity.
Figure 2-2 shows the fracture toughness data of Vitreloy 1 and Var1, 2 and 3. Detailed information of the fracture toughness measurement is listed in Table 2-2. For each composition, we obtained 3 data points except Var2, which had 2. Quaternary Zr-Ti-Cu-Be alloys (Var1 and Var2) consistently had linear elastic fracture toughness values greater than 80 MPa·m1/2, while Vitreloy 1, a Zr-Ti-Cu-Ni-Be alloy, had an average fracture toughness of 48.5 MPa·m1/2 with a large amount of scatter. The addition of iron to Vitreloy 1 reduced the fracture toughness to 25 MPa·m1/2. The error bars reflect the standard deviation of the data.
0 20 40 60 80 100
25.2 84.7
48.5
Var3 Var1 Var2
Fracture toughness (MPa m1/2 )
Vitreloy 1
82.3
Figure 2-2. Effect of composition on fracture toughness.
Table 2-2. Experimental conditions and data of BMGs used in this study.
a0: initial crack length (a0 = length of notch + length of fatigue precrack), KQ: Fracture toughness calculated using critical fracture load, G: shear modulus, ν: Poisson’s ratio.
Composition thickness (mm)
Initial crack a0
(mm)
KQ
(MPa⋅m1/2) G (GPa) ν
Zr33.5Ti24Cu15Be27.5 (Var1) 2.16 3.1 96.8 36.7 0.36
2.19 4.4 80.8 36.7 0.35 2.26 3.5 69.2 36.9 0.35 Zr44Ti11Cu20Be25 (Var2) 2.13 3.5 85.5 35.5 0.36
2.22 4.3 83.9 35.1 0.36
Zr44Ti11Ni10.2Cu9.3Be25Fe0.5 (Var3) 2.15 3.7 27.5 - - 2.16 3.7 26.4 35.7 0.36
2.16 3.4 21.7 - -
Zr41.2Ti13.8Ni10Cu12.5Be22.5 (Vitreloy1) 2.18 3.8 74.4 35.8 0.36
1.86 3.2 49.6 - - 2.22 4.1 27.3 35.6 0.36
The specimen size requirement for plane strain fracture toughness (KIC) limits the valid measurable fracture toughness value for a given specimen dimension, as described in ASTM E399: B, a, (W-a) ≥ 2.5 ·(KQ/σy)2
where B = sample thickness, a = initial crack length, and (W-a) = untorn ligament length.
For example, a specimen with thickness of B = 2.1mm and yield stress of 1.8 GPa is limited to a maximum valid fracture toughness value of 52 MPa⋅m1/2. Thus the KQ values higher than 80 MPa⋅m1/2 of the Var1 and Var2 alloys cannot be regarded as plane strain fracture
toughness (KIC). On the other hand, all data points for the Var3 satisfy the plane strain condition.
The Vitreloy 1 data lie on the boundary. To obtain valid plane strain fracture toughness, Var1 and
Var2 should be measured with specimens having thickness of ~6mm. Rather than measuring plane strain fracture toughness, we have compared the fracture behavior of specimens in the same geometry.
Reported fracture toughness for Vitreloy 1 varies from 16∼55 MPa·m1/2 [4-8]. The significant scatter in data has been attributed to variations in processing conditions, such as the cooling rate during casting [17]. The high degree of scatter in the fracture toughness
measurements of Vitreloy 1 was also pointed out earlier by Gilbert et al. [5], who reported values ranging from 30 to 68 MPa·m1/2. This is comparable to the scatter of the Vitreloy 1 data in this study, 27-74 MPa·m1/2. Possible sources of scatter in the data include (1) cooling rate differences during casting, (2) variations in residual stress, and (3) composition fluctuations in a given alloy.
Each fracture specimen was produced via vacuum injection casting into copper mold from separately prepared ingots. Injection temperature during the casting process was not strictly controlled so the cooling rate could vary between specimens. In turn, this will leads to differences in the configurational state of the sample and associated free volume distribution [17]. Residual stress develops during the casting process due to the high temperature gradients which arise during sample cooling and solidification. Residual stress is known to affect fracture toughness significantly [16]. According to Aydiner et al. [18], an 8.25mm thick Vitreloy 1 plate cast in a copper mold exhibited -25 to -30MPa surface compression and +10 to +13 interior tension. Their model suggested significant residual stress decreases with decreasing casting thickness. The casting thickness used in this study is 2.5mm. Aydiner et al. also showed that the compressive surface stresses were confined to a relatively thin surface layer. To reduce residual stress effects in the present work, ~10% of the surface layer was removed by grinding. This should
significantly reduce residual stress effects in the tested samples. It is noteworthy that Var1, Var2 and Var3 samples studied here show relatively small scatter in fracture toughness values. On the
other hand, the large scatter in the Vitreloy 1 data suggests a greater sensitivity of Vitreloy 1 to process conditions. Removing Ni from Vitreloy 1 significantly reduced experimental scatter and increased fracture toughness. Adding Fe to Vitreloy 1 decreased the experimental scatter, but also decreased the fracture toughness. Zr33.5Ti24Cu15Be27.5 (Var1) and Zr44Ti11Cu20Be25 (Var2), which contain no Ni, exhibit consistently high fracture toughness while Zr44Ti11Cu9.3Ni10.2Be25Fe0.5
(Var3) has consistently low fracture toughness. The reduction in the scatter of fracture toughness resulting from the small composition changes suggests that Vitreloy 1, in the compositional sense, is on a “boundary” separating high toughness (∼80MPa⋅m1/2) and low toughness (∼25MPa⋅m1/2) materials. In turn, this suggests that the fracture toughness of these BMG’s tends to exhibit a relatively sharp “transition” in fracture toughness with varying composition and to a lesser extent with process history for a single composition. In this picture, addition of Ni (or Fe) tends to stabilize the “brittle” phase. Recent reports on very high toughness BMG-composites [14] with a Ni-free Zr-BMG matrix [10] are consistent with this view. A report by Conner et al. [19] of a reduction in bending ductility with Ni addition to Vitreloy alloys also appears to be related.
Finally, we note that the addition of Ni (and other composition variations) may modify the free volume distribution in the glass. This is known to be a determining factor in BMG mechanics as shown by Launey et al. [20].
Figure 2-3 shows fracture energy, calculated from fracture toughness and elastic constants, as a function of Poisson’s ratio including the data of Fe-based bulk metallic glass [21, 22] and various non-metallic glasses [23]. As pointed out by Lewandowski et al. [13], the data suggest a universal correlation between the energy of fracture and the Poisson’s ratio (or the elastic
modulus ratio G/B) for various glasses. Although a correlation is suggested over a broad range of glasses, within the data set of Zr-based BMGs, the tendency is not clear. The effect of
composition changes or addition of specific constituent elements (e.g., Ni and Fe in this study) may be a more dominant factor.
0.22 0.24 0.26 0.28 0.30 0.32 0.34 0.36 1E-3
0.01 0.1 1 10 100
Fracture energy (kJ/m2 )
Poisson's ratio
Figure 2-3. Effect of Poisson’s ratio (ν) on fracture energy (Fracture Energy = K2/E/(1-ν2)).
: Zr-based bulk metallic glasses measured in this study
S: Fe-based bulk metallic glass (fracture data from Ref.21 and elastic property data from
Ref.22)
z: Various glasses including phosphate glasses and soda lime silicate [23]
2.4 Conclusions
In summary, we have developed Vitreloy type alloys with robust glass forming ability and thermal stability and measured basic properties including thermal, elastic and mechanical
properties. While all the alloys have comparable elastic properties and compressive yield strength, the fracture toughness exhibits much greater variation. Ni-free quaternary alloys consistently have
linear elastic fracture toughness values (KQ) of ~80 MPa·m1/2, while Vitreloy 1 had an average fracture toughness of 48.5 MPa·m1/2 with a large amount of scatter. The addition of iron to Vitreloy 1 consistently reduces KQ to 25 MPa·m1/2 with little scatter. This suggests that specific elemental constituents can have a significant effect on toughness and thus on the stability of shear bands during deformation under opening stress.
Acknowledgements
The authors would like to thank Prof. G. Ravichandran of GALCIT, Caltech for providing the MTS test system. This work was supported in part by the MRSEC Program of the National Science Foundation under Award Number DMR-0520565.
References
[1] A. Peker, W.L. Johnson, Appl. Phys. Lett. 63 (1993) 2342.
[2] W.H. Wang, C. Dong, C.H. Shek, Mat. Sci. Eng. R 44 (2004) 45.
[3] C.C. Hays, C.P. Kim, W.L. Johnson, Appl. Phys. Lett. 75 (1999) 1089.
[4] P. Lowhaphandu, J.J. Lewandowski, Scripta Mater. 38 (1998) 1811.
[5] C.J. Gilbert, V. Schroeder, R.O. Ritchie, Met. Mat. Trans. 30A (1999) 1739.
[6] D. Suh, R.H. Dauskardt, J. Non-Cryst. Solids 317 (2003) 181.
[7] D. Suh, R.H. Dauskardt, Ann. Chim. Sci. Mat. 27 (2002) 25.
[8] R.D. Conner, A.J. Rosakis, W.L. Johnson, D.M. Owen, Scripta Mater. 37 (1997) 1373.
[9] G. Duan, M.L. Lind, K. De Blauwe, A. Wiest, W.L. Johnson, Appl. Phys. Lett. 90 (2007) 211901.
[10] G. Duan, A. Wiest, M.L. Lind, J. Li, W.-K. Rhim, W.L. Johnson, Adv. Mater. 19 (2007) 4272.
[11] A. Wiest et al., Acta Mater. 56 (2008) 2625.
[12] W.L. Johnson, K. Samwer, Phys. Rev. Lett. 95 (2005) 195501.
[13] J.J. Lewandowski, W.H. Wang, A.L. Greer, Phil. Mag. Lett. 85 (2005) 77.
[14] D.C. Hofmann, J.-Y. Suh, A. Wiest, G. Duan, M.L. Lind, M.D. Demetriou, W.L. Johnson, Nature 28 (2008) 1085.
[15] W.L. Johnson, MRS Bull. 24(10) (1999) 42.
[16] M.E. Launey, R. Busch and J.J. Kruzic, Acta Mater. 56 (2008) 500.
[17] M.E. Launey, R. Busch and J.J. Kruzic, Scripta Mater. 54 (2006) 483.
[18] C.C. Aydiner, E. Ustundag, M.B. Prime and A. Peker, J. Non-Cryst. Solids 316 (2003) 82.
[19] R.D. Conner, W.L. Johnson, Scripta Mater. 55 (2006) 645.
[20] M.E. Launey, J.J. Kruzic, C. Li and R. Busch, Appl. Phys. Lett. 91 (2007) 051913.
[21] P.A. Hess, S.J. Poon, G.J. Shiflet, R.H. Dauskardt, J. Mater. Res. 20 (2005) 783.
[22] V. Ponnambalam, S.J. Poon, G.J. Shiflet, J. Mater. Res. 19 (2004) 1320.
[23] T. Miura, T. Watanabe, Y. Benino, T. Komatsu, J. Am. Ceram. Soc. 84 (2001) 2401.
Chapter 3
Correlation between fracture surface morphology and toughness in Zr- based bulk metallic glasses

![Figure 1-6. SEM backscattered electron image of in-situ composite microstructure (Inset : X-ray diffraction pattern) [25]](https://thumb-ap.123doks.com/thumbv2/123dok/12165215.0/28.918.337.679.132.485/figure-backscattered-electron-composite-microstructure-inset-diffraction-pattern.webp)
![Figure 1-7. Fracture resistance curves for three composite specimens are compared with the fracture toughness of the monolithic alloy (Vitreloy 1) [28]](https://thumb-ap.123doks.com/thumbv2/123dok/12165215.0/28.918.296.727.581.992/fracture-resistance-composite-specimens-compared-toughness-monolithic-vitreloy.webp)
![Figure 1-8. SEM micrograph showing interaction of shear bands with ductile phases [29]](https://thumb-ap.123doks.com/thumbv2/123dok/12165215.0/30.918.279.738.215.506/figure-micrograph-showing-interaction-shear-bands-ductile-phases.webp)
![Figure 1-10. A typical equilibrium viscosity curve of a BMG (Vitreloy 1) at molten and supercooled liquid regions [36]](https://thumb-ap.123doks.com/thumbv2/123dok/12165215.0/32.918.245.771.118.591/figure-typical-equilibrium-viscosity-vitreloy-molten-supercooled-regions.webp)


![Figure 3-7. Correlation between jagged pattern extension (denoted as L A in Figure 3-2(a)) and process zone size calculated from Equation 3-2 [3]](https://thumb-ap.123doks.com/thumbv2/123dok/12165215.0/71.918.326.695.465.784/figure-correlation-pattern-extension-denoted-figure-calculated-equation.webp)

