Freer Gallery of Art 2015 Visitor Studies Part Two:
Observations of Visitors
Office of Policy and Analysis Smithsonian Institution Washington, DC
March 2016
Credits:
Study design and setup: Andrew Pekarik, Mackenzie Crowley, Guarina Lopez-Davis Observers: Sonia Haro-Garcia, Dorothea Brady, Elena Day, Kyle Jean Fisher,
Lesley Kadish, Mackenzie Crowley, Guarina Lopez-Davis Project management and assistance: Kelly Richmond, Ikuko Uetani Analysis and Report: Andrew Pekarik
Freer Gallery liaison: Elizabeth Eder, Karen Sasaki
Table of Contents
Table of Contents ... 3
Background ... 4
Key Points ... 6
The Peacock Room ... 6
Atraction ... 6
Stops ... 6
Time ... 6
Survey Results for Observed Visitors ... 6
Recommendations ... 7
Improve Texts ... 7
Help Visitors with Chinese Painting ... 7
Highlight the Nio ... 7
Findings for All Visitors ... 8
Demographic and visitor characteristics ... 8
Time in the Freer Gallery ... 8
Stops in the Freer Gallery ... 8
High attraction locations ... 8
Stops and Time in Galleries ... 12
Objects and Galleries ... 13
Objects and their labels ... 14
Labels and Galleries ... 16
Panel Texts ... 16
Galleries and Panel Texts ... 18
Benches and Galleries ... 18
Other Locations ... 18
Findings for Surveyed Visitors ... 20
Comparisons to the Year-long Survey Data ... 20
Stops ... 20
Time ... 20
Superior Overall Experience Rating ... 21
Behavior and Especially Satisfying Experiences ... 21
Feature Ratings ... 21
Other Outcomes ... 21
Recommendations ... 22
Improve Texts ... 22
Help Visitors with Chinese Painting ... 22
Highlight the Nio ... 22
Appendix A: List of Identified Locations by Gallery ... 23
Appendix B: Map of the Galleries ... 30
Background
In anticipation of the closing of the Freer Gallery for infrastructure repair in 2016, the museum requested three studies to help guide the re-design of the galleries -- a year-long entrance-exit survey, an interview study, and this observation study. The aim of the observation study was to document exactly how visitors were using the museum by unobtrusively observing their activity and noting where they stopped and for how long, and who they were with. A sample of observed visitors were also invited to take a survey as they were leaving the museum.
The study took place between July and December 2015. Throughout the museum 270 locations were identified as potential stops.1 Of these, 171 were object locations.
Some of these locations featured a single object, in other instances the location referred to a case with multiple objects. In addition 32 label locations were
identified. These were places where the label for an object was positioned in such a way that an observer could reliably determine whether or not a visitor was reading the label. All 47 panel texts (called “wall chats” by Freer|Sackler staff) were also identified as stop locations, as were 15 benches, 2 brochure locations, 2 magnifying glass locations, and the lobby information desk.
Appendix A contains the list of observation locations. Each location is identified by a code that identifies the Gallery, sequence of the location within the gallery, type of stop, and identifying description. In all but a few cases the sequence is
counterclockwise starting from the entrance door around the walls of the gallery and then in the center. For example S-10-O Peacock Room is the 10th item in the South Hall and is an object stop. Other types of locations are noted as P (panel), L (label), or B (bench).
The gallery with jades closed during the study period and its data has been excluded from this report. Other changes in the Freer during this period were minor. The areas included in the study were Galleries 1-7, 11, 13-18, and Northwest Hall, West Hall, South Hall, East Hall, and Northeast Hall. See the map in the Appendix B.
A stop at one of these locations was defined as a person standing in front of the location with feet not moving for at least three seconds. The data in this report account only for the time that follows the initial three seconds. Thus actual times are three seconds greater than the times reported here.
Observers used a software program, TrackNTime, to record visitor behaviors. The program ran on iPads that identified all the stops both on a gallery-by-gallery list and also on a map. Analysis of the data was done in MS Excel and SPSS 20.
Although visitors were followed unobtrusively, some visitors became aware that they were being observed and commented on it when they took the survey. None of these visitors expressed any objection. However, on the few occasions that a visitor
1 The total number of stop possibilities increased to 282 over the course of the study as objects and texts were rotated.
engaged an observer during observation, the observation was terminated and not used in the study.
Altogether 230 individuals were observed throughout their visit. Of these, 138 also completed surveys (75% of those who were asked). Nearly all observations began at the Freer’s Mall entrance lobby. Some visitors entered the lobby from the
connection to the Sackler Gallery, but most entered directly from the Mall. One in twenty observations began with visitors who entered at Independence Avenue.
Key Points
The Peacock Room
The Peacock Room played a large role in the visit during this period, at least partly as a result of the REMIX exhibition, which brought it strongly to the attention of visitors. Nearly three out of four visitors went to the Peacock Room and on average they spent more than four times longer there than at any other location. The
principal panel for the Peacock room “The Peacock Room Comes to America” was the most frequently stopped-at panel text (one in five visitors stopped there).
Atraction
After the Peacock Room the two locations that drew the most attention were both Japanese – the Nio guardian figure in the northwest corner, and the Maple Leaves screen in the Japanese screen gallery (Gallery 5). The two Chinese bronze tigers in Gallery 18 were also major draws.
Observation studies like this one are always good reminders of how diverse visitors are. Only ten locations in the entire museum were stopped at by at least one in five visitors (see Table 1), and most locations received very little attention.
Only one designated location – a label in the Chinese painting gallery (Gallery 13) – was not stopped at by anyone in the study. In general visitors the Chinese paintings drew relatively little attention, despite the fact that they were presented as an exhibition of the work of a single artist, Bada Shanren.
Stops
On average visitors made 16 stops of at least three seconds during their visit. On average each object location drew 24 visitors (10% of visitors), and each label location drew 22 (10%). Panel texts were not as successful in attracting visitor attention. On average panel texts drew 11 visitors (5%). By comparison, nearly as many sat on benches (an average of 7 visitors per bench; 3%).
Time
On average visitors spent 24 minutes in the museum, 9 of them at stops and 15 minutes moving.
Survey Results for Observed Visitors
About one-quarter of visitors (23%) who were surveyed after observation rated their overall experience as Superior, the top of the scale. Superior experience ratings were significantly associated with exceeding expectations, high ratings of features, seeing rare things, moved by beauty, enriching understanding, feeling an emotional connection, and having a higher Idea score in IPOP. Those who spent more time at label stops were more likely to have reported enriching understanding, gaining information, and feeling an emotional connection as especially satisfying experiences, compared to those who spent less time at label stops. The survey results from observed visitors were very similar to those from all visitors in the year-long entrance-exit survey.
Recommendations
Improve Texts
The panel texts (“wall chats”) are very important for establishing context for the artworks. The study shows that they were not effective in attracting or engaging visitors. They could be much more visible, attractive, and engaging. In both the survey conducted as part of this study and the year-long Freer survey visitors rated their experience with texts relatively low compared to design, and the variety and quality of the art.
The labels included in this study were ones that were set somewhat apart from the objects they supported and they tended to be larger than other labels, sometimes including photographs, as well. The significant association in this data between time at label stops and higher levels of satisfying learning and emotional experiences suggests the potential for texts in the Freer.
Help Visitors with Chinese Painting
The Bada Shanren exhibition in Gallery 13 was notably less successful than other galleries in attracting and engaging visitors. While it was probably not immediately obvious to visitors that Gallery 13 was a themed exhibition, the same could be said of other galleries as well. Presumably visitors had trouble making a direct and spontaneous connection to the ink paintings and calligraphy. The works might have been more accessible to visitors if there had been a closer link to history and
emotion through more explanation, translations, and guides to closer looking.
Highlight the Nio
After the Peacock Room, the large, dynamic Nio Guardian Figure in the northwest corner drew the most attention, despite its relatively low-key display. Its companion sculpture in the northwest corner was also one of the high attraction locations.2 Size, of course, is a factor in attraction, but so, too, is the human form. The relatively
strong response to the Chinese Buddhist sculpture in Gallery 17 probably reflects a similar attraction to the human figure. The Guardian Figures have the potential to serve as effective icons of the Gallery, especially if they were to be presented in a more dramatic manner.
2 The figure in the northwest corner probably received more attention because 60% of visitors entering from the Mall turned to the right rather than to the left and were thus more likely to have noticed the sculpture facing them. They would have seen the figure in the northeast corner only in passing as they crossed the hall from Gallery 16 to Gallery 17. In support of this interpretation, it should be noted that the number of visitors who stopped at the northwest figure is 60% of the number who stopped at both.
Findings for All Visitors
Demographic and visitor characteristics
Observers estimated the gender, ethnicity, group size, and group composition of visitors. According to these estimates visitors were:
• 55% female; 45% male (The sample of observed and surveyed visitors was 61% female, 39% male)
• 77% White, 16% Asian, 4% Hispanic, 2% Black, 1% Middle Eastern
• 45% alone, 51% with one or more adults, 10% with one or more youth under age 18
In the sample of observed and surveyed visitors two out of three visitors (68%) were visiting the Freer for the first time and the average age of visitors was 41 (median: 41).
Time in the Freer Gallery
• The average length of the Freer visit was 24 minutes (median: 24 minutes).
• On average visitors spent 9.2 minutes in total at all the locations where they stopped (i.e., the sum of all times they spent stopped during their visit).
• If bench locations are excluded the average total time stopped is 8 minutes.
• The average time stopped at a (non-bench) location was 23 seconds.
In other words, on average visitors spent most of their time (62% - 15 of their 24 minutes) moving through the space.
Stops in the Freer Gallery
The average number of stops during the visit was 16, the maximum was 121.
Locations where visitors stopped (including only object locations, label locations, and panel locations) can be divided into three nearly equal groups:
• High Attraction Locations – the 35% of locations where at least 10% of visitors stopped
• Medium Attraction Locations – the 32% where 5%-9% of visitors stopped
• Low Attraction Locations – the 33% where 1%-4% of visitors stopped High attraction locations
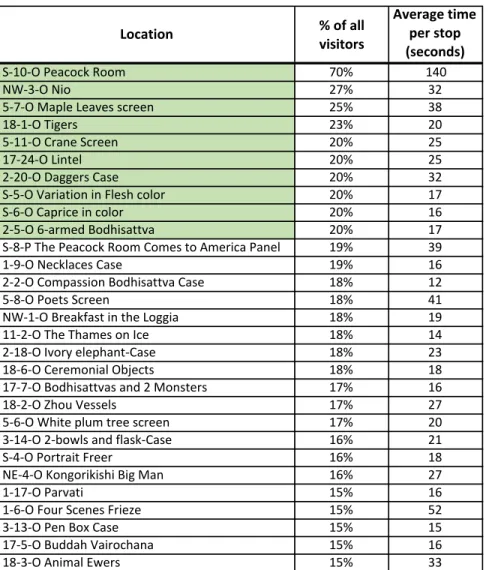
The very highest attraction locations (11% of all locations) are those where at least 15% of visitors stopped. They are shown in Table 1 together with the average time in seconds at each location.
Table 1: Highest attraction locations
The Peacock Room was by far the most visited location – 70% of all visitors stopped in the Peacock Room, and they spent an average of 140 seconds (2.3 minutes) there, which is six times longer than the average stop length. The Guardian Figure in the Northwest Hall (at the location farthest from the Peacock Room) was the second most visited location. The others in the top ten (highlighted in green) are nicely spread across the museum:
• The six-armed Bodhisattva and case with daggers in Gallery 2
• Two screens in Gallery 5
• Two Whistler paintings in the South Hall
• The lintel in Gallery 17
• The tiger bronzes in Gallery 18
Only one panel text makes it into these top 29 locations – “The Peacock Room Comes to America.”
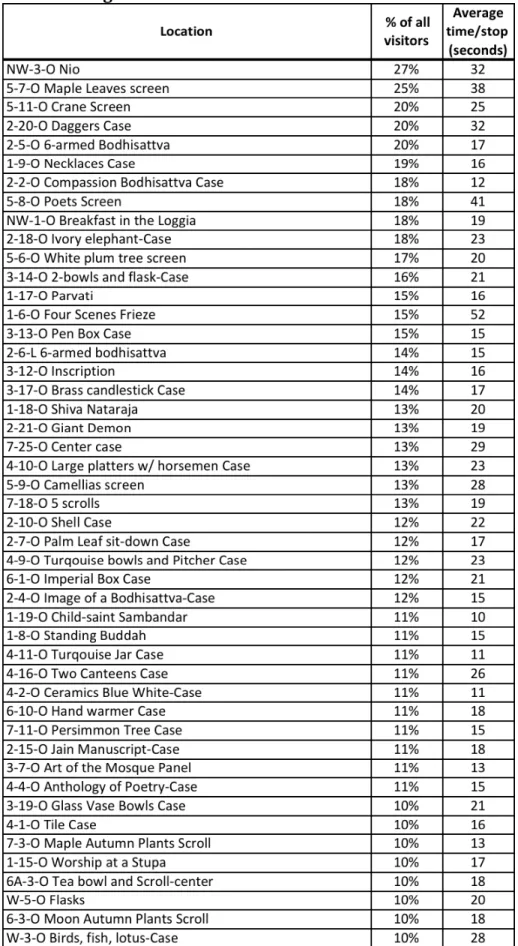
Tables 2A and 2B present the complete list of High Attraction Locations (i.e., those where at least one in ten visitors stopped) by Gallery.
Location % of all
visitors
Average time per stop (seconds)
S-10-O Peacock Room 70% 140
NW-3-O Nio 27% 32
5-7-O Maple Leaves screen 25% 38
18-1-O Tigers 23% 20
5-11-O Crane Screen 20% 25
17-24-O Lintel 20% 25
2-20-O Daggers Case 20% 32
S-5-O Variation in Flesh color 20% 17
S-6-O Caprice in color 20% 16
2-5-O 6-armed Bodhisattva 20% 17
S-8-P The Peacock Room Comes to America Panel 19% 39
1-9-O Necklaces Case 19% 16
2-2-O Compassion Bodhisattva Case 18% 12
5-8-O Poets Screen 18% 41
NW-1-O Breakfast in the Loggia 18% 19
11-2-O The Thames on Ice 18% 14
2-18-O Ivory elephant-Case 18% 23
18-6-O Ceremonial Objects 18% 18
17-7-O Bodhisattvas and 2 Monsters 17% 16
18-2-O Zhou Vessels 17% 27
5-6-O White plum tree screen 17% 20
3-14-O 2-bowls and flask-Case 16% 21
S-4-O Portrait Freer 16% 18
NE-4-O Kongorikishi Big Man 16% 27
1-17-O Parvati 15% 16
1-6-O Four Scenes Frieze 15% 52
3-13-O Pen Box Case 15% 15
17-5-O Buddah Vairochana 15% 16
18-3-O Animal Ewers 15% 33
Table 2A: High attraction locations in West Galleries
Table 2B: High attraction locations in South and East Galleries
Note that these 92 High Attraction Locations, where at least one in ten visitors stopped, include at least one stop in all galleries except Gallery 13 and the East Hall, where Chinese paintings were on view. Visitors to those areas did not find any single location that compelled attention to the same degree as the locations on these lists. Note also that only one location is a label (for the six-armed Bodhisattva in Gallery 2), and only one is a panel (the Peacock Room panel noted above}.
Stops and Time in Galleries
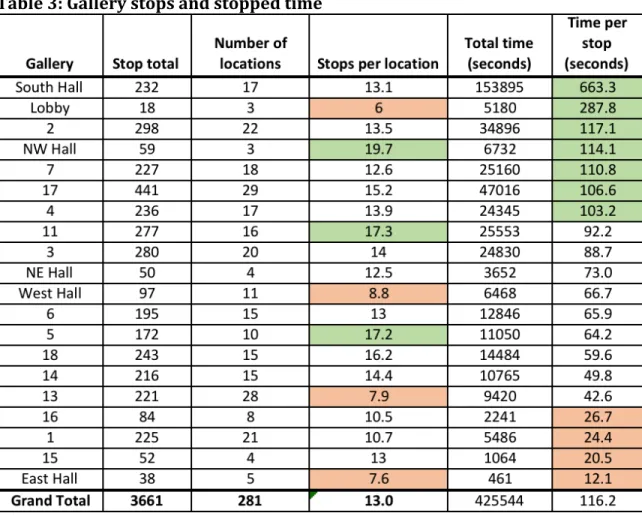
As shown in Table 3, galleries differed according to the number of stop locations identified for the study, the number of visitors who stopped at those locations, and the length of time they spent there. Most time was spent in the South Hall, which included the Peacock Room and the Courtyard, two destinations with longer
average stop times. One-third of all recorded visitor time was spent in the South Hall, because it included the Peacock Room. Stops were also relatively long in the Lobby, Northwest Hall and Galleries 2, 4, 11, and 17. The shortest stops were in Galleries 1, 15, 16, and the East Hall. The Northwest Hall and Galleries 5 and 11 had the most stops per location; East Hall, West Hall, Lobby, and Gallery 13 had the fewest stops per location.3
Table 3: Gallery stops and stopped time
3 Cells marked in green are at least one standard deviation above the mean for that statistic. Those in orange are less than one standard deviation below the mean.
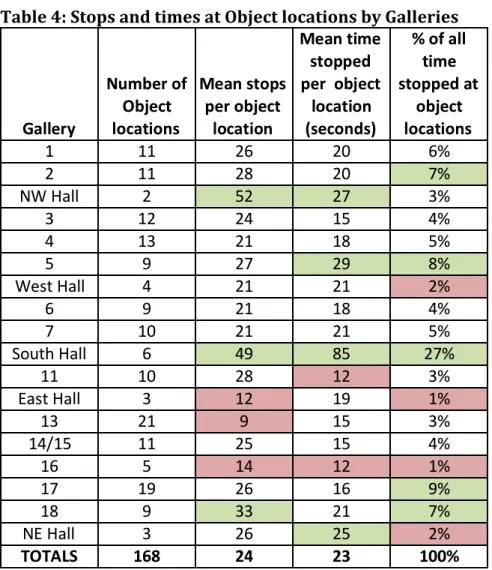
Objects and Galleries
Table 4 compares galleries, but looks only at object locations. Green highlighted figures are high and red highlighted figures are low compared to the rest.4 Table 4: Stops and times at Object locations by Galleries
Relative to the number of possibilities, more stops were being made in the
Northwest Hall (because of the guardian figure), in South Hall (Peacock Room), and Gallery 18. Fewest stops per object were in East Hall, and Galleries 13 and 16. Over one quarter (27%) of all time spent looking at objects was spent in the Peacock Room.
The guardian figures in Northwest Hall and Northeast Hall and the screens in
Gallery 5 were holding visitors longer than objects in other areas. Overall more time was spent looking at objects in Galleries 2, 5, 17, 18, and the Peacock Room. Objects in East Hall and Galleries 13 and 16 were stopped at least, and the least amount of time on average was spent with objects in West Hall, Northeast Hall, and Gallery 16.
4 High and low are defined here as a difference of one standard deviation above and below the mean, excluding the Peacock Room outlier.
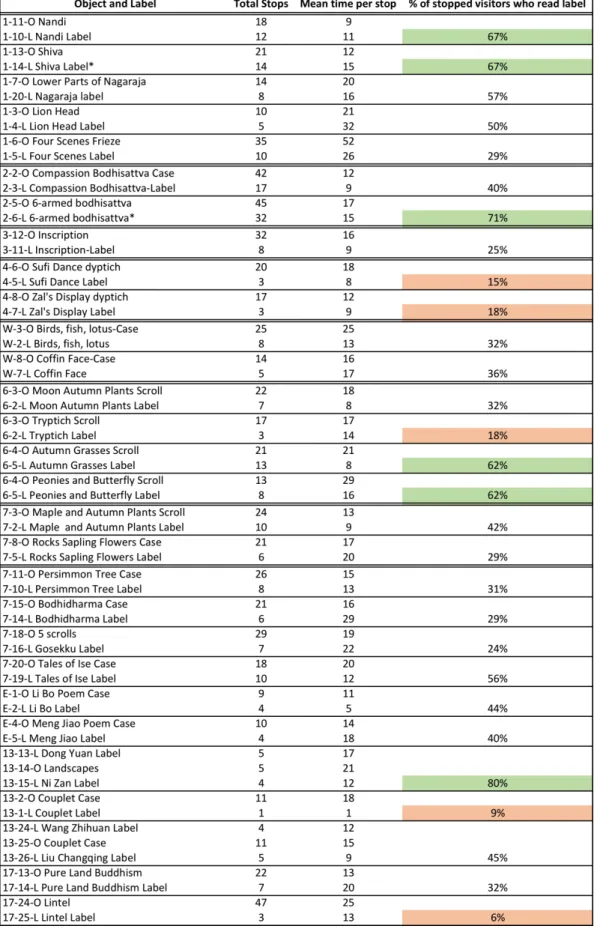
Objects and their labels
At 32 locations label texts were separate enough from the items they described that observers could determine when they were being read. Table 5 provides details. On average 30% of those who stopped at an object also read the label, and overall their time reading was 21% of their time looking. Across these locations visitors on average spent 20 seconds looking and 15 seconds reading.
Two of the labels recorded in Table 5 included color photographs (Shiva in Gallery 1, six-armed Bodhisattva in Gallery 2 – marked with asterisks in Table 5 and shown below). This might have a bearing on their relatively high percentage of readers, compared to most other labels.
The relationship between labels and objects is more complex than this summary implies. The above comparison of object and label stop times implies that visitors view the object first and then look at the label, and that everyone who reads the label has also looked at the object. These assumptions are not correct. For example, of the 32 individuals who read this Bodhisattva label, 12 read the label after they had stopped at the sculpture, 12 read it before they stopped at the sculpture, and 8 read it without stopping even three seconds at the sculpture.
The situation with the Shiva label is even more complex, since the label was not immediately adjacent to the object it described. Altogether 14 visitors stopped at the Shiva label, but only three went directly from the label to the sculpture, and no one went from the sculpture to the label. Because of the distance between them, visitors did not treat as a unit.
Labels in Galleries 6, 7 and 13 (except the Triptych label in Gallery 6) were done differently from most others in the museum – the basic data were listed in smaller type at the bottom, rather than at the top. Instead of starting with that basic data, each label had a headline title. Two of these in Gallery 6 (Grasses and Peonies) had higher levels of attraction than most other observed labels.
Table 5: Time and Stops at Object Locations and Their Associated Labels
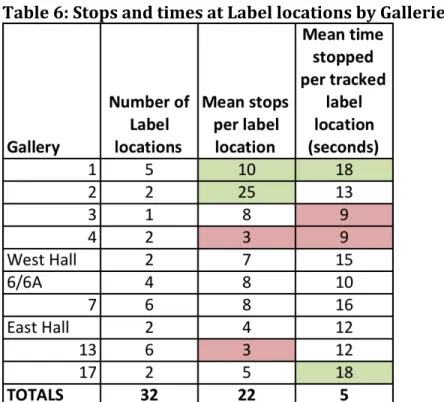
Labels and Galleries
As Table 6 indicates, visitors spent more time with the labels in Gallery 1 and Gallery 18. This is probably due not only to the objects and label content but also to the fact that these galleries were near the beginning of the visit for many people.
Among visitors entering from the Mall doors, 60% turned to the right (the direction of Gallery 1) and 40% turned left (the direction of Gallery 18).
Visitors are likely to be more inclined to give time to the first labels they read, because they are still energetic, and because they have not yet determined how much value the labels will add to their experience. Label reading is a cost and most visitors instinctively balance that effort against the return they get from the texts.
Table 6: Stops and times at Label locations by Galleries
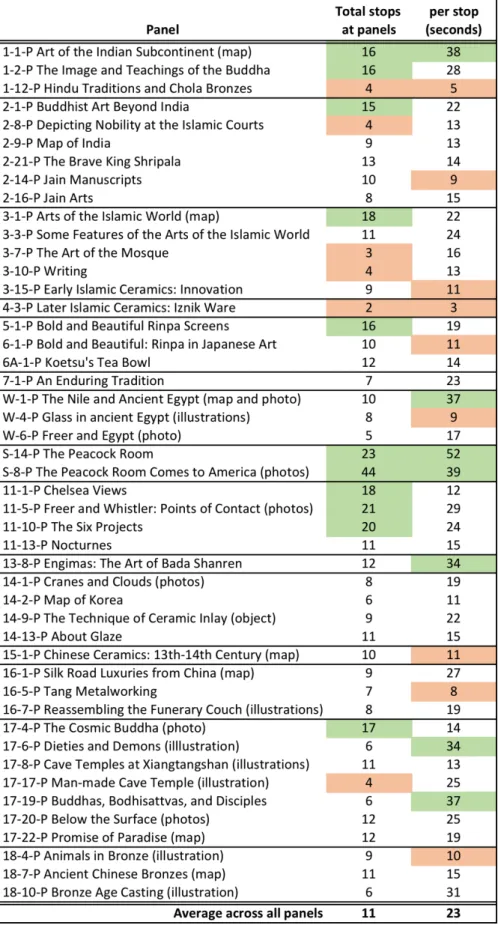
Panel Texts
There were a fair number of panel texts in the Freer – more than one for every four object locations on average, but they were not very well visited. On average only 11 people visited any one panel text –just one in twenty visitors. That is half the
percentage of visitors stopped on average at the label texts that were observed, and less than half the percentage who stopped at object locations.
Although some panels had photos, illustrations, and maps, those additional features did not seem to draw more visitors overall. The Peacock Room panels were stopped at more than any others. As with the labels, there was a tendency for the first panels encountered in Gallery 1 to attract a disproportionate number of visitors, along with the entry panels in Galleries 2, 3, and 5, as well as the panels on Whistler’s paintings in Gallery 11.
Table 7: Text Panel Stops and Times
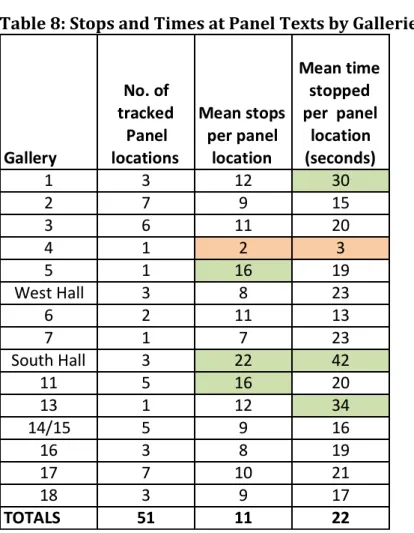
Galleries and Panel Texts
Table 8 summarizes by galleries the data in Table 7.
Table 8: Stops and Times at Panel Texts by Galleries
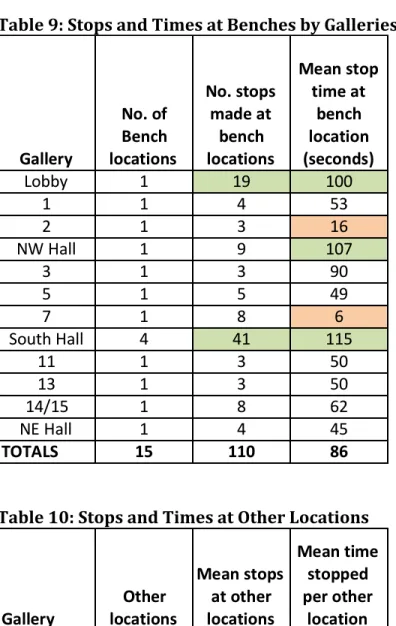
Benches and Galleries
Sitting was observed at 15 locations. Most were benches, but the Courtyard seats were also included as part of the South Hall. As a result, the South Hall and the Lobby were the locations where visitors were most likely to be seated. The Northwest Hall bench did not draw many people, but those who sat there stayed longer on average than at any of the benches in galleries. Altogether there were 110 uses of the benches, which is about half the number of visitors. See Table 9.
Other Locations
Four other locations were included in the study: the information desk in the lobby at the Mall entrance, the brochure racks on the benches in the Mall lobby, the brochure rack outside the Peacock Room, and the rack of magnifying glasses in Gallery 4. The information desk drew 44 of these visitors (19%) for an average of 50 seconds each, and 36 visitors (16%) used the brochure rack on the Lobby benches. See Table 10.
Table 9: Stops and Times at Benches by Galleries
Table 10: Stops and Times at Other Locations
Findings for Surveyed Visitors
Three out of five observed visitors (138 visitors, 60% of all observed visitors) were also surveyed at the end of their visit.
Comparisons to the Year-long Survey Data
Compared to visitors surveyed across the entire year, these 138 visitors gave the same overall experience rating (23% Superior), and reported similar especially satisfying experiences and ratings in most cases.
Only four items showed statistically significant differences between the observed visitors and the sample of Freer visitors for the entire year. Compared to all visitors the observed and surveyed visitors included more females (61% vs. 55%) and more foreign residents (20% vs. 12%), were less likely to report gaining information as an especially satisfying experience (40% vs. 53%), and rated design more highly (35%
Superior vs. 23%).
Stops
The maximum number of stops was 121. The median number of stops was 23. Half of the surveyed visitors made fewer than 22 stops and three-quarters of them made less than 32 stops, as shown in Figure 1.
Figure 1: Number of surveyed visitors by number of total stops
Time
This sample of visitors spent an average of 24 minutes in the museum (same as for all observed visitors), but the median time was shorter (21 minutes vs. 24 minutes for all observed visitors), indicating that more of them spent less time. The average time that they spent at a stop was 24 seconds. The median stop time was 12 seconds.
These statistics were affected by stops in the Peacock Room, which tended to be much longer. Four out of five of the surveyed visitors (83%) went into the Peacock Room and on average they spent 137 seconds there (2.3 minutes). The median time in the room was 87 seconds (1.5 minutes). If we exclude time spent in the Peacock Room, the average time at other stops in the museum is reduced to 20 seconds.
Average time at an object stop was 23 seconds, 20 seconds at a panel stop, 15 seconds at a label stop, and 64 seconds at a bench stop. These averages are close to those for all observed visitors except in the case of bench stops, which were shorter for those who completed surveys (64 seconds vs. 110 seconds).
Superior Overall Experience Rating
Reporting a Superior overall experience was significantly associated with each of the following:
• Reporting that the visit exceeded expectations,
• Giving Superior ratings to long texts/labels/quality of art/design/variety,
• Having been especially satisfied by:
o seeing rare things, o being moved by beauty, o enriching understanding,
o feeling an emotional connection, and
• Having a higher Idea score in IPOP.5 Behavior and Especially Satisfying Experiences
Only three of the variables related to a Superior overall experience are significantly associated with behavior that was observed in the Freer. The number of labels that a person stopped at and the length of time spent reading labels was positively
associated with enriching understanding, feeling an emotional connection, and reporting that the visit exceeded expectation.6 Total time stopped at the observed label locations varied from 3 seconds to over 4 minutes.
Feature Ratings
Observed visitors who completed surveys rated the long texts and labels relatively low (20% and 22% Superior), in comparison to their ratings for variety of the art (28% Superior), design/layout (35% Superior), and the quality of the art (47%
Superior).
Other Outcomes
Three out of five (55%) indicated that they were so engaged that they almost lost track of time, and two out of five (43%) felt that the visit exceeded their expectation.
Only one in one hundred (1%) felt that the visit had not met their expectation.
5 The dataset was not large enough to construct a statistical model that could show which of these were predictive factors independent of the others.
6 Stopping at more labels and spending more time with them was also positively associated with gaining information.
Recommendations
Improve Texts
The panel texts (“wall chats”) are very important for establishing context for the artworks. The study shows that they were not effective in attracting or engaging visitors. They could be much more visible, attractive, and engaging. In both the survey conducted as part of this study and the year-long Freer survey visitors rated their experience with texts relatively low compared to design, and the variety and quality of the art.
The labels included in this study were ones that were set somewhat apart from the objects they supported and they tended to be larger than other labels, sometimes including photographs, as well. The significant association in this data between time at label stops and higher levels of satisfying learning and emotional experiences suggests the potential for texts in the Freer.
Help Visitors with Chinese Painting
The Bada Shanren exhibition in Gallery 13 was notably less successful than other galleries in attracting and engaging visitors. While it was probably not immediately obvious to visitors that Gallery 13 was a themed exhibition, the same could be said of other galleries as well. Presumably visitors had trouble making a direct and spontaneous connection to the ink paintings and calligraphy. The works might have been more accessible to visitors if there had been a closer link to history and
emotion through more explanation, translations, and guides to closer looking.
Highlight the Nio
After the Peacock Room, the large, dynamic Nio Guardian Figure in the northwest corner drew the most attention, despite its relatively low-key display. Its companion sculpture in the northwest corner was also one of the high attraction locations.7 Size, of course, is a factor in attraction, but so, too, is the human form. The relatively
strong response to the Chinese Buddhist sculpture in Gallery 17 probably reflects a similar attraction to the human figure. The Guardian Figures have the potential to serve as effective icons of the Gallery, especially if they were to be presented in a more dramatic manner.
7 The figure in the northwest corner probably received more attention because 60% of visitors entering from the Mall turned to the right rather than to the left and were thus more likely to have noticed the sculpture facing them. They would have seen the figure in the northeast corner only in passing as they crossed the hall from Gallery 16 to Gallery 17. In support of this interpretation, it should be noted that the number of visitors who stopped at the northwest figure is 60% of the number who stopped at both.