Petty for her incredible help and cooperation throughout the five years of my Ph.D. LDSR/LDSC Linkage disequilibrium score regression LDL-C Low-density lipoprotein cholesterol LLD Lipid-lowering drug.
INTRODUCTION AND SPECIFIC AIMS
Using phenomenon-wide TWAS (PredixVU), I will investigate the clinical impact of lipid-associated genes across the phenomenon by linking genetic factors to the full medical history captured in EHRs.
4 CHAPTER II
BACKGROUND
Despite these advantages, less scientific research has focused on the genetic components of lipid traits in H/L compared to populations of European ancestry. Therefore, additional genetic studies in H/L populations should be prioritized to improve our understanding of the genetic etiology of lipid traits.
Overview
12 Subjects
HCHS/SOL
Genotyping and quality control
Samples were checked with annotated or genetically determined sex, missing call rate and batch effect. Variants were filtered by missing call rate (>2%), Mendelian error, Hardy-Weinberg equilibrium (P-value<1×10⁻⁵).
Phenotyping
Ambulatory lipid measurements collected between the ages of 18 and 75 without LLD were extracted, resulting in 2,154,820 lipid measurements in 196,263 individuals. Cases of dyslipidemia in BioVU were defined as a diagnosis of any disorder of lipoid metabolism (fecode 272) or a record of LLD between the ages of 18 and 75 years.
Phasing and Identity-by-Descent detection
It uses a two-stage approach to identify the identical shared segment: first, GERMLINE detects the completely identical matched-seed of potential identical segments using
To decrease the false positive rate in IBD detection, I restricted downstream IBD mapping analyzes to use IBD segments with a length equal to or greater than 5 cM (false positive rate: 4.6% for 5 cM and 14.7% for 2.5 cM)76.
Identity-by-Descent mapping
For rare IBD segments with fewer than ten carriers, the proportion of all patient carriers and all control carriers was compared with a theoretical expectation and whole-genome observation. For recurrent IBD segments with more than ten carriers, a logistic generalized estimating equation (GEE) was applied to examine the effect size of specific IBD.
Genomic imputation and post-imputation quality control
After determining genomic regions in which case-case pairs were significantly enriched with IBD segments, all individual IBD segments within this region were examined. Only the SNPs with imputation information score greater than 0.4 and MAF greater than 1% were used for further GReX imputation and GWAS.
Genetically Regulated Expression imputation
The imputation quality indices include the info score, the masked SNP r2 and the ratio of the observed variance of the imputed doses to the expected binomial variance. The combination statistic follows a χ2 distribution with a degree of freedom of 2k, where k represents the total number of PCs used and pi is the p-value of the PC.
Single gene and genome-wide association test
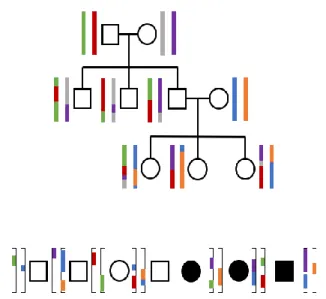
Undirected family networks were reconstructed based on first and second degree linkage only. For families with more than five members, the number and distribution of IBD segment splits was used to verify the degree of relatedness among all members within the family.

Phenome-wide association study in PredixVU
The FDR adjustment was performed for the tissue-specific model and cross-tissue model for each trait, separately, and the significance threshold applied is FDR-adjusted p-value less than 0.05. For each trait, I counted the number of lipid genes with coordinated or opposite direction of effect in the BioVU samples.
RESULTS
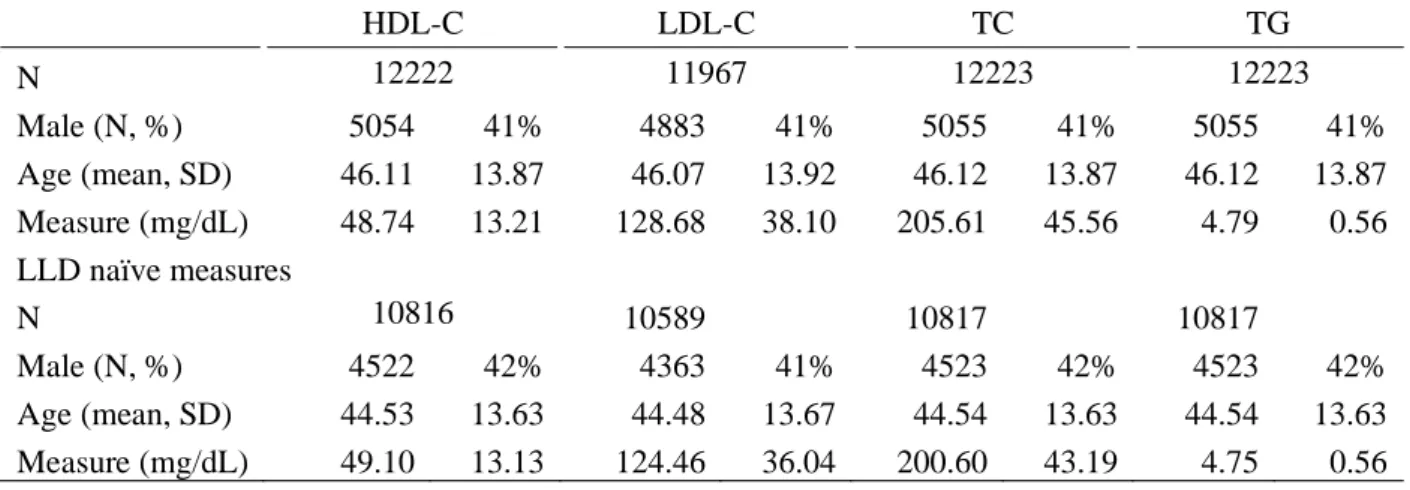
Demographic and lipids related characteristics
Identity-by-Descent detection
Matching for age, sex, country of origin and genetic ancestry, 4,241 dyslipidemia cases and the same number of controls were selected for analysis.

30 Figure 4. Number of IBD sharing pairs across whole genome in BioVU
32 Identity-by-Descent mapping
For the more frequent specific IBD segments carried by ten or more subjects, 63 of 1908 segments on chromosome 5 were found to be significantly associated with dyslipidemia (GEE model p-value <0.05), and 36 of a total of 1153 segments were important for the chromosome 22 region (Annex IV). Of the 874 more frequent segments of IBD, seventeen were found to be significantly associated with dyslipidemia (Appendix IV).
34 Figure 6. Manhattan plot IBD mapping on dyslipidemia status in BioVU
Evaluation of optimal lipid phenotyping algorithms in Electronic Health Records
For log10 TG, two different long-term averages have heritabilities slightly but not significantly higher than the longitudinal average (model 4 for REML-based and model 1 for LD-adjusted, Table 3). As indicated by these results, the longitudinal median was applied to subjects with multiple measurements in the following analyzes (Table 2).
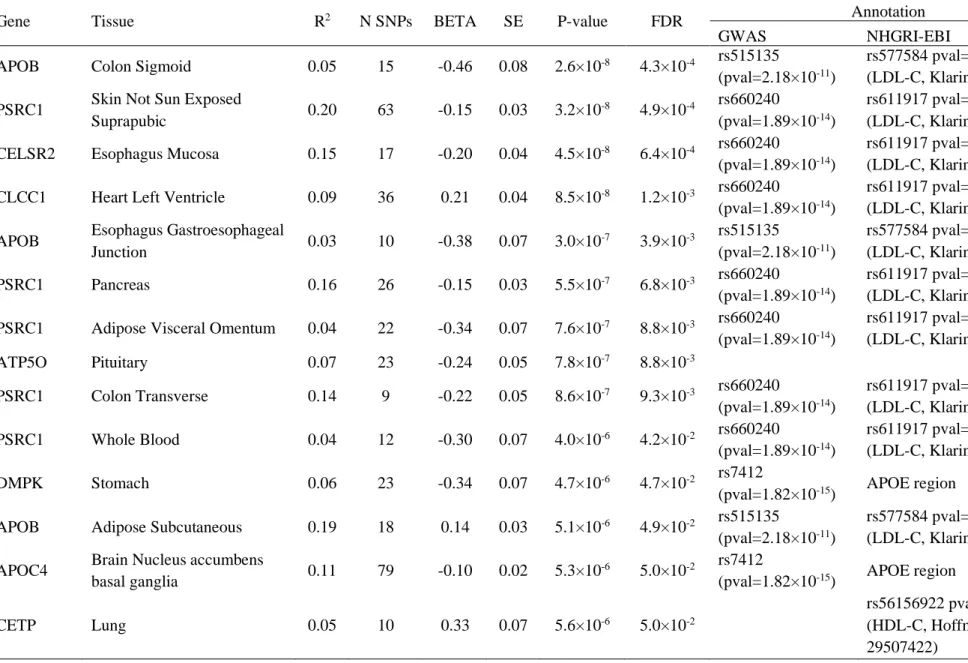
Tissue-specific genetically regulated expression analysis
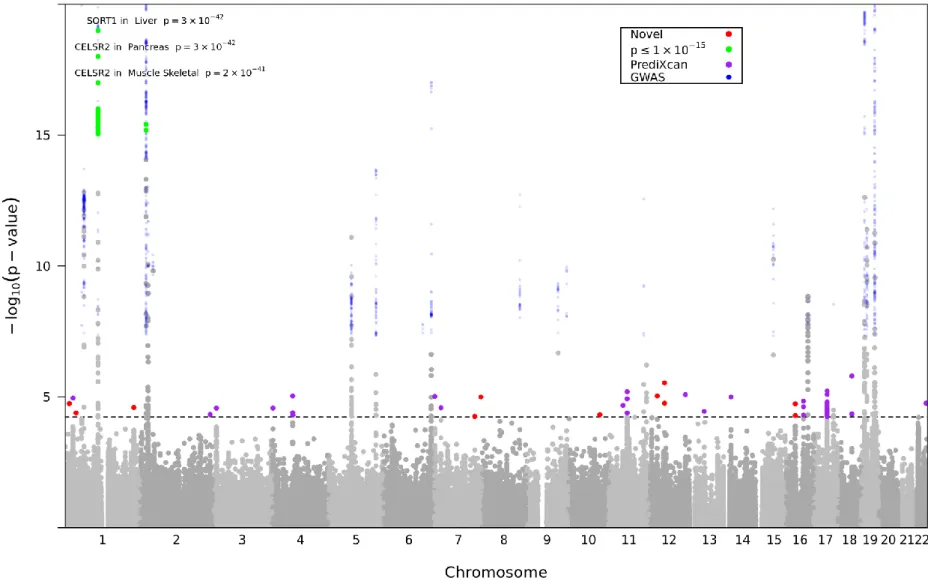
GWAS SNPs from presented population (blue); PrediXcan only genes: no GWAS SNPs ±10MB (purple); New genes: no NHGRI-EBI catalog SNPs ±1MB (red) Figure 9. GWAS SNPs of proposed population (blue); PrediXcan only genes: no GWAS SNPs ±10MB (purple); New genes: no NHGRI-EBI catalog SNPs ±1MB (red).
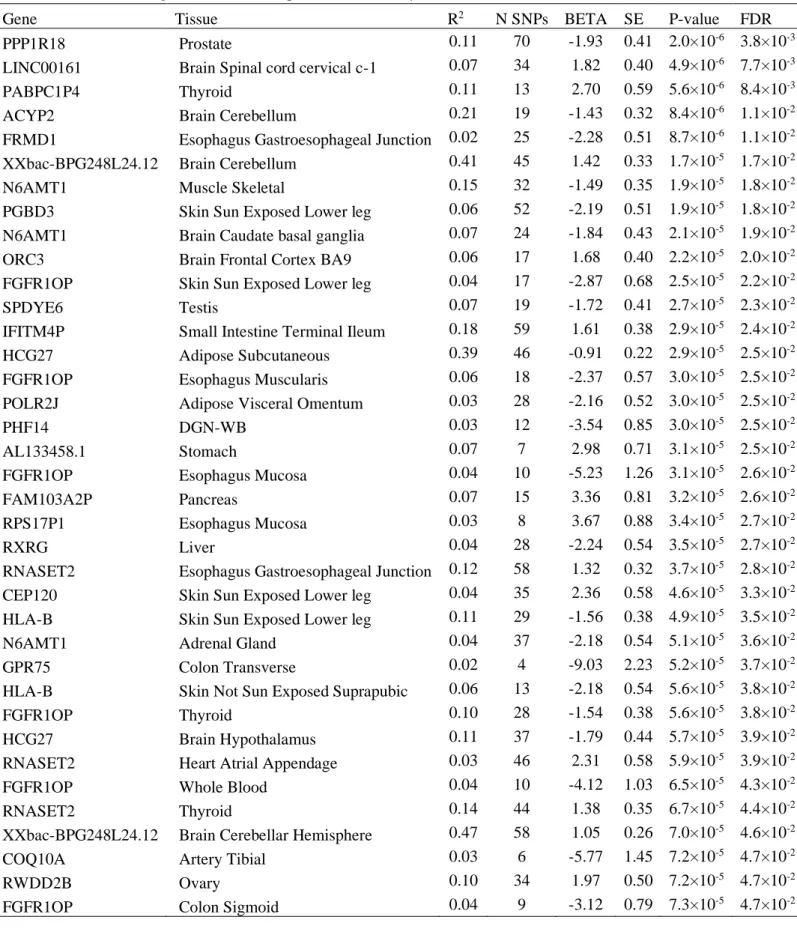
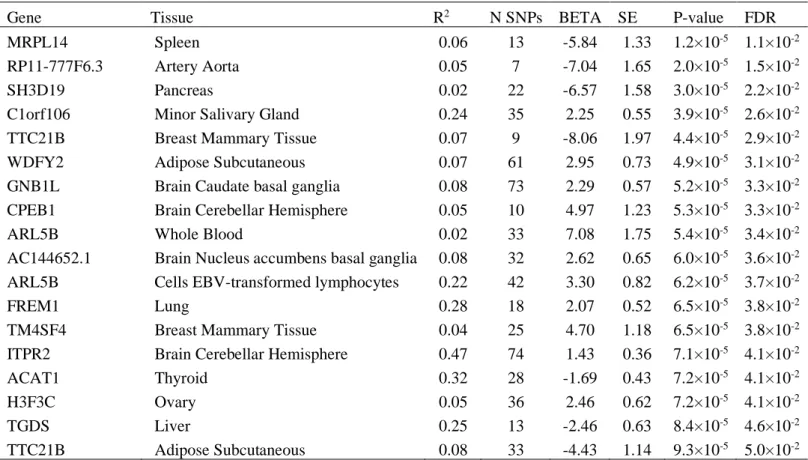
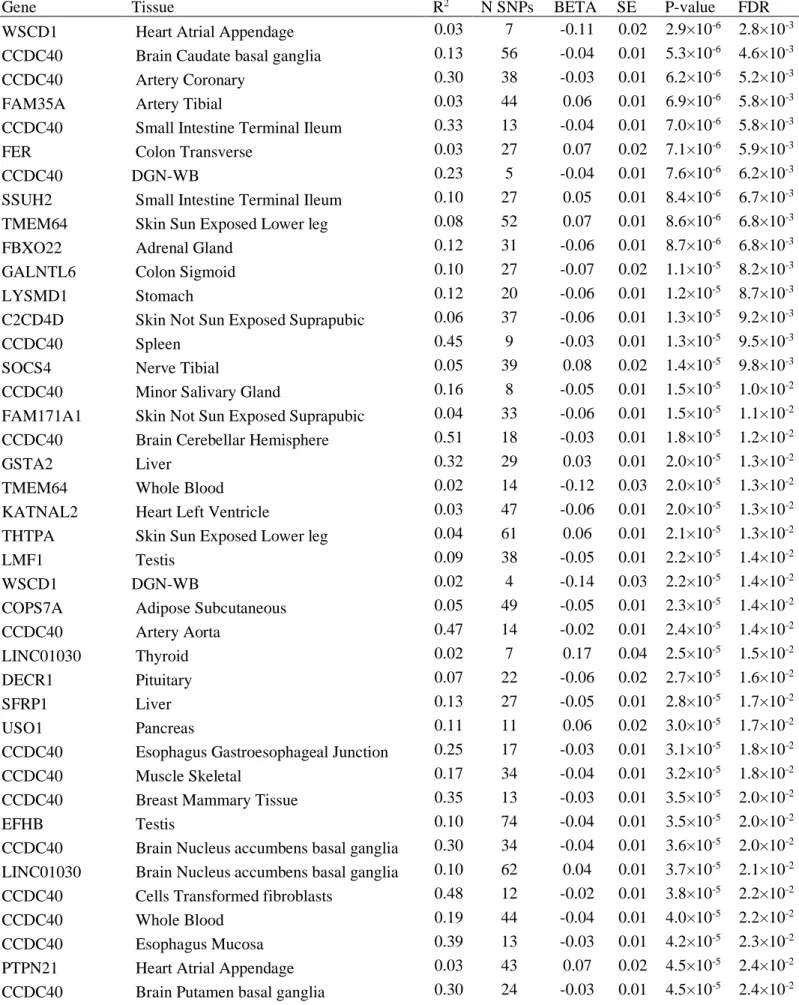
50 Table 10. Dyslipidemia significant genes from tissue-specific GReX analysis in BioVU
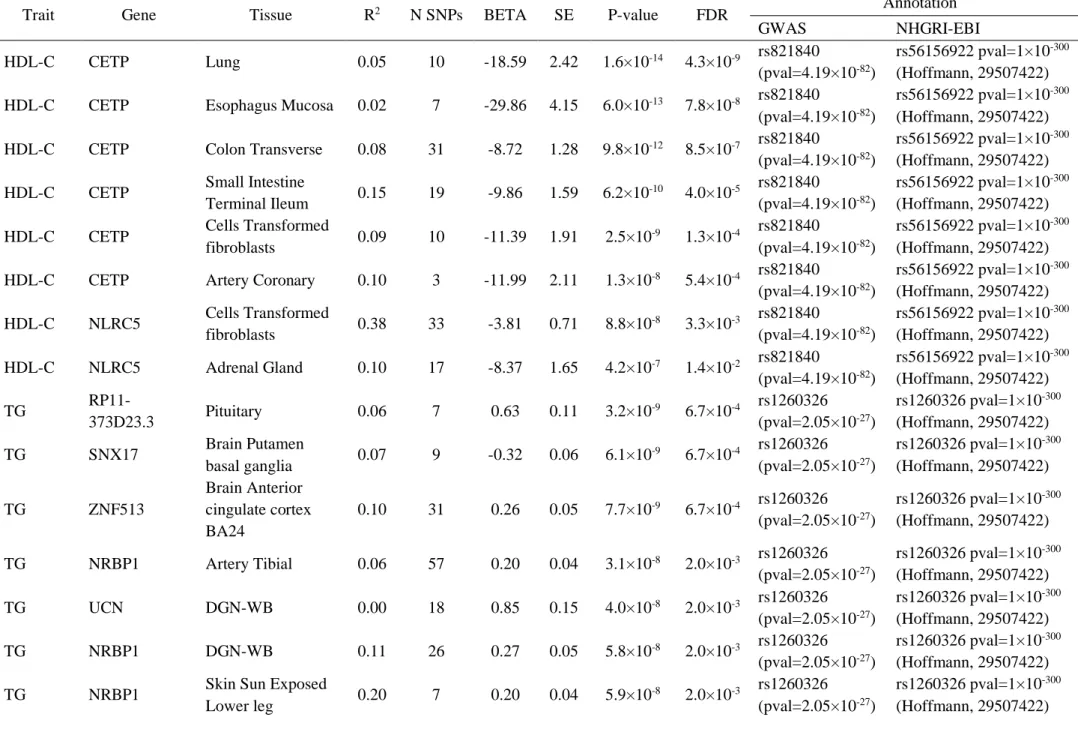
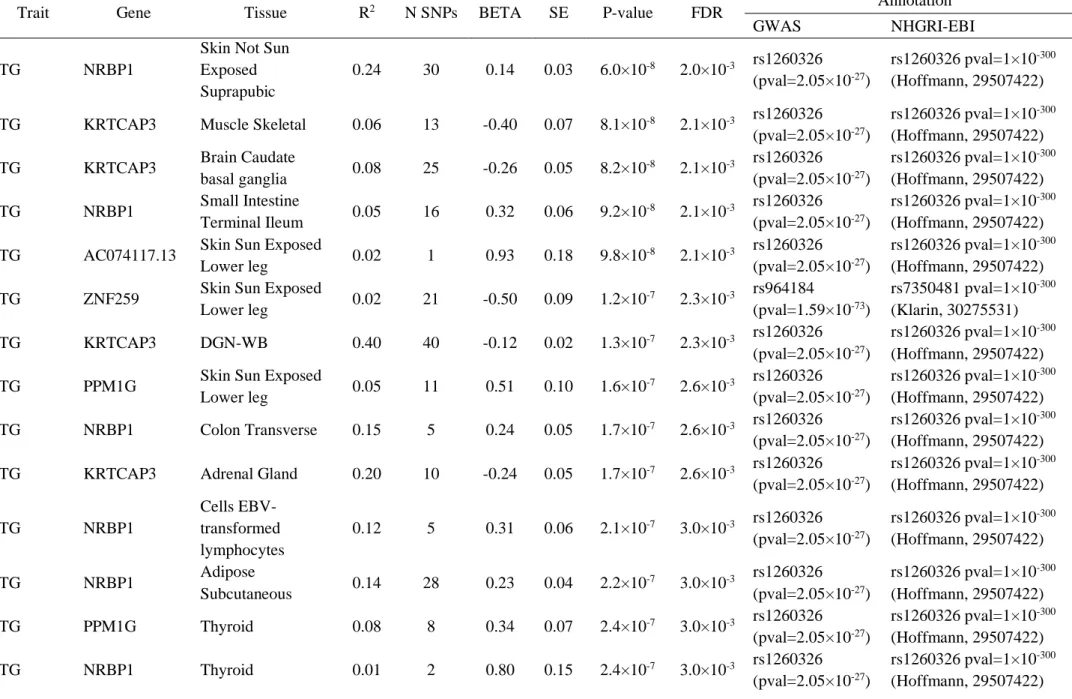
In HCHS/SOL, two genes are significantly associated with HDL-C in multiple tissues, including CETP and NLRC5; both are located near rs821840, a GWAS-significant SNP of HCHS/SOL (Fig. 14 and Table 11). Additionally, to test the effect of including drug-adjusted serum lipid measurements, I also compared the log-transformed p-values of the GEE on GReX analyzes to analogous results that included only drug-naïve measurements for both BioVU and HCHS/SOL . GWAS SNPs from presented population (blue); PrediXcan genes only: no GWAS SNPs ±10 MB (purple); New genes: no NHGRI-EBI catalog SNPs ±1 MB (red) Figure 15.
GWAS SNPs from presented population (blue); PrediXcan genes only: no GWAS SNPs ±10 MB (purple); Novel Genes: No NHGRI-EBI Catalog SNPs ±1 MB (red) Figure 18. Log-transformed p-value comparison between drug-naive measure and LLD drug measures in HCHS/SOL.
64 Cross-tissue genetically regulated expression analysis
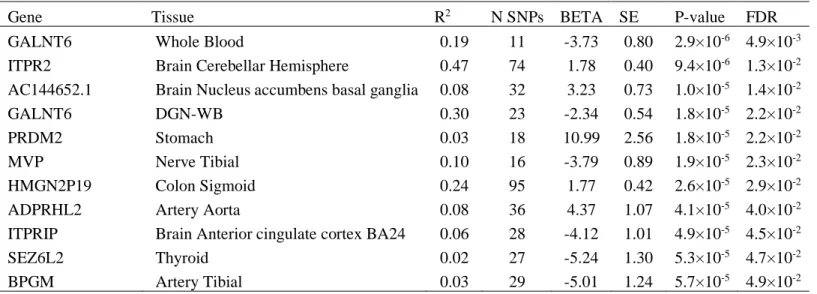
78 Table 16. Significant dyslipidemia genes from cross-tissue GReX analysis in BioVU
90 Summary of identified serum lipids related genes
Phenome-wide association study
92 Table 18. Significant phenotypes enriched with serum lipid genes
94 Table 18. Significant phenotypes enriched with serum lipid genes
DISCUSSION
I observed a lower IBD sharing rate in HCHS/SOL (82,075.5 pairs/cM compared to BioVU pairs/cM), which could be due to differences in the ancestral populations of each data set or could come from using different sampling strategies, genotyping arrays or phasing methods. In contrast, HCHS/SOL recruited participants from four different US metropolitan areas and subjects were from six different countries/regions of origin2. In addition, some genes located in the identified regions have previously been reported to be associated with lipid metabolism.
RANBP17 is a gene located in the genome-wide significant region on chromosome 5 and encodes a RAN transporter protein. In addition, use of LLD is common in the general population and this may influence genetic association results. Serum lipid levels affect and are affected by several tissues and organs in the human body.
LINC01310 is the closest coding region to the IBD mapping segment on chromosome 22 and is significantly associated with LDL-C in the all-tissue cross-sectional GReX model at BioVU. FLG is located within the IBD mapping region of chromosome 1 identified in HCSC/SOL, and is also significantly associated with TG in the cross-tissue model of all tissues in BioVU. Suicide attempt (297), bipolar disorder (296.1) and other psychiatric fecodes were also identified in the PheWAS enrichment analysis.
CONCLUSION
Together, these findings expanded our knowledge of the genetic etiology of serum lipid traits, underscore the importance of innovative statistical strategies, particularly in historically underrepresented and disproportionately disease-burdened populations, and enrich our understanding of the phenotypic consequences of variation. regulator within the genetic architecture. of serum lipids.
JAMA 308, 1775-84 (2012)
Familial ligand-defective apolipoprotein B-100: detection, biochemical characteristics and haplotype analysis of the R3531C mutation in the UK. Genetics of lipid properties: genome-wide approaches yield new biology and clues to causality in coronary artery disease. Genome-wide association study of type 2 diabetes in a sample from Mexico City and a meta-analysis of a Mexican-American sample from Starr County, Texas.
Genome-wide characterization of shared and distinct genetic components influencing blood lipid levels in ethnically diverse human populations. A systematic comparison of occurrence-wide association study data from electronic health record data and genome-wide association study data. Investigating the effects of lipid-lowering drugs: genome-wide lipid association analysis in the HyperGEN study.
Third report of the National Cholesterol Education Program (NCEP) Expert Panel on the Detection, Evaluation, and Treatment of High Blood Cholesterol in Adults (Adult Treatment Panel III) final report. The NHGRI-EBI GWAS catalog of published genome-wide association studies, targeted arrays and summary statistics 2019. Genome-wide association for abdominal subcutaneous and visceral adiposity reveals a novel locus for visceral adiposity in women.
Appendices
Lipid-lowering drugs in BioVU
Lipid lowering drugs adjustment
Metabolic traits used for annotating IBD segments Blood glucose levels
Diastolic night-day blood pressure ratio in hypertension Diastolic blood pressure response to hydrochlorothiazide in hypertension. IDL free cholesterol levels Large HDL free cholesterol levels Large LDL free cholesterol levels Medium HDL free cholesterol levels Medium VLDL free cholesterol levels Medium VLDL free cholesterol levels small Free cholesterol levels in very large features of HDL glucose homeostasis. HDL cholesterol and triglyceride levels (pleiotropy) HDL cholesterol changes in response to fenofibrate in statin-treated type 2 diabetes.
HDL cholesterol x physical activity interaction (1df test) HDL cholesterol x physical activity interaction (2df test) Hemoglobin A1c levels. LDL cholesterol x physical activity interaction (1df test) LDL cholesterol x physical activity interaction (2df test) LDL peak particle diameter (total fat intake interaction) Lipoprotein (a) - cholesterol levels. Low density lipoprotein cholesterol levels Low high density lipoprotein cholesterol levels Average diameter of HDL particles.
Mean diameter of LDL particles Mean diameter of VLDL particles Mean HDL particle concentration Mean LDL particle concentration Mean VLDL particle concentration. Multiple Sclerosis and HDL Levels (pleiotropy) Multiple Sclerosis and LDL Levels (pleiotropy) Multiple Sclerosis and Triglyceride Levels (pleiotropy) Multiple Sclerosis and Waist-to-Hip Ratio (pleiotropy) NHDL Cholesterol to HDL Cholesterol Ratio. Phospholipid levels in large VLDL Phospholipid levels in medium HDL Phospholipid levels in medium LDL Phospholipid levels in medium VLDL Phospholipid levels in small VLDL Phospholipid levels in very large VLDL Phospholipid levels in very small VLDL.
124 Postprandial triglyceride response to high fat diet meal
Waist-to-hip ratio (interaction of ever vs. never smoking) Waist-to-hip ratio (interaction of recreational physical activity) Waist-to-hip ratio (interaction of years of smoking). BMI-adjusted waist-to-hip ratio (adjusted for smoking behavior) BMI-adjusted waist-to-hip ratio (age <50). Waist-to-hip ratio adjusted for BMI (joint analysis for main effect and interaction of physical activity) Waist-to-hip ratio adjusted for.
BMI (main effects of joint analysis and smoking interaction) Waist-to-hip ratio adjusted for BMI (recessive genetic model) Waist-to-hip ratio adjusted for BMI (smoking interaction) Waist-to-hip ratio adjusted for BMI in active subjects Waist -to-hip ratio adjusted for BMI in inactive people Waist-to-hip ratio adjusted for BMI in non-smokers Waist-to-hip ratio adjusted for BMI in smokers Waist-to-hip ratio adjusted for BMI x gender interaction .
126 Appendix IV. SUGEN output of specific IBD segments
Tissue-specific GReX results of the genes significantly associated with HDL-C in BioVU
Tissue-specific GReX results of the genes significantly associated with LDL-C in BioVU
Tissue-specific GReX results of the genes significantly associated with TC in BioVU