GAS EVOLUTION AND GAS-LIQUID SEPARATOR MODELING
By
ALDEN BRACK DANIEL
Bachelor of Science in Chemical Engineering Florida State University
Tallahassee, FL 2013
Submitted to the Faculty of the Graduate College of the Oklahoma State University
in partial fulfillment of the requirements for
the Degree of
DOCTOR OF PHILOSOPHY December, 2018
GAS EVOLUTION AND GAS-LIQUID SEPARATOR MODELING
Dissertation Approved:
Dr. Clint P. Aichele Dissertation Advisor Dr. James R. Whiteley
Prof. Robert J. Agnew
Dr. David M. Lavenson
ACKNOWLEDGMENTS
I would like to thank my advisor, Dr. Clint Aichele, for his insight and guidance throughout my time at Oklahoma State University. I am also grateful for the sage council provided by my committee chair, Dr. Rob Whiteley. Additionally, I would like to thank my other committee members, Dr. David Lavenson and Prof. Rob Agnew, for their continual support and advice. I would like to express my gratitude to Dr. Sayeed Mohammad and Dr. Michael Miranda for their assistance throughout my research project. I would also like to thank Dr. Aniruddha Kelkar for his unique modeling insights and Dr. Gene Kouba for his support and guidance.
I am grateful for our industrial collaborations sponsoring my research. Fi- nancial support was initially provided by Chevron Energy Technology Company. In 2017, the Fluid Phase Kinetics (FPK) Joint Industry Project was founded at Ok- lahoma State University which continued funding for my research. Member compa- nies include Chevron Energy Technology Company, ExxonMobil Upstream Research Company, and Anadarko Petroleum Corporation.
Finally, I would like to thank my family. My mother and father have been a great source of support throughout the years. They are responsible for catalyzing my interest in the sciences in the first place. My brother, Conner, has served as a continual source of inspiration. Most of all, I would like to thank my ever-supportive wife, Rhea. Without her love and encouragement, this work would not have been possible.
Acknowledgments reflect the views of the author and are not endorsed by committee members or Oklahoma State University.
Name: ALDEN BRACK DANIEL Date of Degree: DECEMBER, 2018
Title of Study: GAS EVOLUTION AND GAS-LIQUID SEPARATOR MODELING Major Field: CHEMICAL ENGINEERING
Abstract: Gas-liquid separation is a critical unit operation for oil and gas pro- duction. While there has been a large number of studies investigating the removal of liquid droplets from the gas phase, relatively little attention has been paid to the separation of gas bubbles from the liquid phase. Understanding the liquid de- gassing process is critical as oil and gas production is pushed towards more extreme operating conditions, particularly those involving heavy oil and high pressure envi- ronments. Current degassing guidelines rely on overly simplistic assumptions and field experience. Additionally, the entering gas and liquid phases are assumed to be in thermodynamic equilibrium with one another. Any pressure drop experienced by the multiphase stream prior to entering the separator will result in excess solution gas evolving out of solution. If the separator liquid residence time is less than the time required to re-establish equilibrium, the exiting liquid stream will then contain excess dissolved gas that will evolve out of solution further downstream. The aim of this study was twofold: construct a new experiment capable of measuring gas evo- lution at high pressures and develop a modeling framework for degassing within a horizontal gas-liquid separator incorporating the experimental gas evolution findings.
A reference hydrocarbon system of methane and n-dodecane was used for the gas evolution experiments. Both rates of absorption and desorption were measured us- ing the same process conditions, confirming that both mass transfer coefficients were symmetric within the experimental error. The surface renewal theory in the form of the small eddy model was found fit the data with an average error of 12.3 %. Using the separator degassing model, separation performance of entrained gas was found to be driven primarily by the liquid viscosity as well as the overall size of the initial bubble distribution. New entrained gas separation guidelines were developed using the separator model. Removing significant amounts of excess solution gas was found to be challenging using inlet conditions that also favored entrained gas separation.
As more bubbles are separated from the liquid, the interfacial area available for mass transfer along with the net mass transfer rate also decrease.
TABLE OF CONTENTS
Chapter Page
I INTRODUCTION 1
1.1 Gas-Liquid Separation . . . 1
1.1.1 Challenges in Gas-Liquid Separation . . . 2
1.1.2 Gaps in Current Understanding . . . 4
1.2 Research Goals . . . 8
1.3 Dissertation Organization . . . 9
II GAS-LIQUID SEPARATORS 10 2.1 Conventional Gas-Liquid Separators . . . 10
2.1.1 Horizontal Separators . . . 11
2.1.2 Vertical Separators . . . 12
2.1.3 Spherical Separators . . . 13
2.1.4 Separator Selection . . . 15
2.2 Cyclone Separators . . . 17
2.3 Separator Internals . . . 19
2.3.1 Inlet Conditioning Devices. . . 19
2.3.2 Wave Breakers . . . 21
2.3.3 Foam Breakers . . . 21
2.3.4 Mist Extractors. . . 22
2.4 Separator Sizing . . . 23
2.4.1 Droplet Separation Capacity . . . 24 . . . .
. . . .
Chapter Page
2.4.2 Bubble Separation Capacity . . . 26
III BUBBLE DYNAMICS 30 3.1 Bubble Nucleation . . . 30
3.2 Bubble Growth . . . 36
3.3 Bubble Rise . . . 40
3.4 Bubble Coalescence . . . 43
3.5 Summary . . . 44
IV MASS TRANSFER 45 4.1 Gas-Liquid Mass Transfer . . . 45
4.2 Mass Transfer Theories . . . 49
4.2.1 Film Theory . . . 49
4.2.2 Penetration Theory . . . 50
4.2.3 Surface Renewal . . . 50
4.2.4 Large Eddy Model . . . 51
4.2.5 Small Eddy Model . . . 51
4.3 Summary . . . 52
V EXPERIMENTAL DEVELOPMENT 54 5.1 Previous Mass Transfer Experimental Designs . . . 54
5.1.1 Rapid vs Gradual Depressurization . . . 55
5.1.2 Batch vs Semibatch Operation . . . 57
5.1.3 Subcritical vs Supercritical Mixing . . . 57
5.2 Materials . . . 58
5.2.1 Pressure Vessel . . . 58
5.2.2 High-Pressure Pump . . . 58 . . . .
. . . .
. . . .
Chapter Page
5.2.3 Mixer . . . 59
5.2.4 Valves and Actuators . . . 60
5.3 Rapid Depressurization Experiment. . . 60
5.4 Gradual Depressurization Experiment . . . 62
5.5 Safety . . . 64
5.5.1 Hazardous Reaction Lab . . . 64
5.5.2 Purging Procedure . . . 66
5.5.3 Blast Cell Blower . . . 70
5.5.4 Hydrocarbon Sensors. . . 71
5.5.5 Emergency Shutdown . . . 71
5.6 Summary . . . 71
VI GAS EVOLUTION EXPERIMENTS 73 6.1 Gas Evolution Experimental Procedure . . . 73
6.2 Data Analysis . . . 74
6.3 Mineral Oil Properties . . . 76
6.4 SFT Mixer . . . 77
6.4.1 Initial Results. . . 78
6.5 Autoclave Mixer . . . 83
6.5.1 Results . . . 83
6.6 Summary . . . 85
VII ABSORPTION-DESORPTION EXPERIMENTS 86 7.1 Absorption vs Desorption . . . 86
7.2 Mass Transfer Modeling . . . 87
7.3 Experimental Description . . . 88
7.3.1 Test Conditions. . . 88 . . . .
. . .
Chapter Page
7.4 Absorption-Desorption Experimental Procedure . . . 89
7.5 Data Analysis . . . 92
7.6 Liquid Controlled Mass Transfer . . . 96
7.7 Error Propagation . . . 97
7.8 Results . . . 99
7.8.1 Desorption Mass Transfer . . . 99
7.8.2 Absorption Mass Transfer . . . 103
7.8.3 Mass Transfer Coefficients . . . 108
7.9 Conclusion . . . 114
VIII HORIZONTAL SEPARATOR MODELING 115 8.1 Model Development . . . 115
8.1.1 Model Assumptions . . . 117
8.1.2 Separation Algorithm . . . 118
8.1.3 Geometric Specifications . . . 124
8.1.4 Bubble Velocity Calculation . . . 126
8.1.5 Mass Transfer Properties . . . 127
8.2 Standard Model Conditions . . . 131
8.2.1 Saturated Base Case . . . 133
8.2.2 Supersaturated Base Case . . . 135
8.2.3 Numerical Stability. . . 137
8.3 Saturated Fluid Analysis. . . 139
8.3.1 Density Sensitivity Analysis . . . 139
8.3.2 Viscosity Sensitivity Analysis . . . 142
8.3.3 Inlet Bubble Density Variation . . . 144
8.3.4 Proposed Saturated Fluid Degassing Guidelines . . . 147 . . . .
Chapter Page
8.4 Supersaturated Fluid Analysis. . . 148
8.4.1 Viscosity Sensitivity Analysis . . . 148
8.4.2 Liquid Swelling . . . 152
8.4.3 Challenges in Removing Excess Solution Gas . . . 152
8.5 Model Validation . . . 156
8.5.1 Saturated Conditions . . . 156
8.5.2 Supersaturated Conditions . . . 161
8.5.3 Cocurrent Bubble Flow Prediction . . . 161
8.5.4 Bubble Velocity Calculation . . . 163
8.6 Conclusion . . . 164
IX CONCLUSION 166 9.1 Experimental . . . 166
9.2 Modeling . . . 167
X RECOMMENDATIONS 169 10.1 Mass Transfer Experiment . . . 169
10.2 Separator Modeling . . . 170
172 REFERENCES ABSORPTION-DESORPTION STANDARDOPERATINGPROCEDURE 190 A.1 Introductory Information . . . 191
A.1.1 Overview . . . 191
A.1.2 Emergency Shutdown . . . 191
. . . . . . . . . . . . APPENDICES . . . 190
APPENDIX A:
. . . .
Chapter Page
A.1.5 Personal Protective Equipment . . . 192
A.1.6 Stop Work Authority . . . 192
A.1.7 Hydrocarbon Sensor Calibration . . . 192
A.1.8 Chemical Disposal . . . 193
A.1.9 Chemical Cleanup . . . 193
A.1.10 Leak Testing . . . 193
A.1.11 Hazardous Entry . . . 194
A.1.12 Unmanned Operation with Hydrocarbon Systems . . . 194
A.1.13 Incident/Near-Miss Reporting . . . 194
A.1.14 Prior Incidents/Near-Misses . . . 195
A.2 Operating Procedure . . . 197
A.1.4 Hazardous Weather Protocol (Shelter in Place) . . . 192
A.1.3 Emergency Medical Response . . . 192
LIST OF TABLES
Table Page
1.1 API 12J degassing guidelines (API, 2009) . . . 4
2.1 API 12J degassing guidelines with liquid density . . . 27
2.2 API 12J guidelines with liquid viscosity . . . 27
3.1 Tadaki correlation constants (Tadaki, 1961) . . . 42
6.1 Physical properties of Tech 80 and Tech 500 at 25 ◦C. . . 77
7.1 Liquid density and viscosity of n-dodecane and methane diffusivity in n-dodecane at 45 ◦C as a function of pressure (Jamialahmadi et al., 2006) . . . 89
7.2 Mixing speed to energy dissipation rate conversion at different satu- ration pressures . . . 96
7.3 Measured absorption and desorption mass transfer coefficients of the methane-dodecane system . . . 110
7.4 Measured mass transfer coefficients compared to the Lamont and Scott solid surface model (Lamont and Scott, 1970) . . . 112
7.5 Measured mass transfer coefficients compared to the Lamont and Scott fluid surface model (Lamont and Scott, 1970) . . . 113
8.1 Standard model conditions . . . 132
8.2 Base case model outputs with ξ = 0 . . . 134
8.3 Base case model outputs with ξ = 0.3 . . . 136
Table Page
8.4 Required liquid residence time to reach 1% remaining gas volume at
different bubble distribution modes . . . 148
A.1 Operators . . . 190
A.2 Emergency Contacts . . . 190
A.3 Standard Operating Procedure Version. . . 190
A.4 SOP – Inspection and Set-up . . . 197
A.5 SOP – Vessel Filling . . . 198
A.6 SOP – Vessel Filling, continued . . . 199
A.7 Pre-Pressurization Preparations . . . 199
A.8 Pre-Pressurization Preparations, continued . . . 200
A.9 SOP – Initial Equilibrium . . . 200
A.10 SOP – Initial Equilibrium, continued . . . 201
A.11 SOP – Absorption . . . 201
A.12 SOP – Second Equilibrium . . . 202
A.13 SOP – Desorption . . . 202
A.14 SOP – Shut Down and Clean Up . . . 203
A.15 SOP – Shut Down and Clean Up, continued . . . 204
LIST OF FIGURES
Figure Page
1.1 Example of gas carry-under in a horizontal separator . . . 2 1.2 Schweitzer and Szebehely’s experimental setup, adapted from Schweitzer
and Szebehely (1950) . . . 6 1.3 Simplified experimental diagram of Hunt’s piston rig, adapted from
Hunt (1995) . . . 8 2.1 Schematic of a horizontal separator, adapted from Stewart and Arnold
(2008) . . . 12 2.2 Schematic of a vertical separator, adapted from Stewart and Arnold
(2008) . . . 13 2.3 Schematic of a spherical separator, adapted from Stewart and Arnold
(2008) . . . 14 2.4 Example three-stage separation process, adapted from Stewart and
Arnold (2008) . . . 16 2.5 Schematic of a GLCC separator, adapted from Erdal et al. (1997) . 18 2.6 Example of different inlet conditioning devices, adapted from Both-
amley (2013a) . . . 20 2.7 Wave breakers inside horizontal separator, adapted from Stewart and
Arnold (2008) . . . 21 2.8 Example of foam breaker inside a horizontal separator, adapted from
Arnold and Stewart (1998) . . . 22
Figure Page
2.9 Wire mesh mist extractor, reproduced with permission from Elsevier, B.V. Stewart and Arnold (2008) . . . 23 2.10 Vane mist extractor, adapted from Arnold and Stewart (1998) . . . 24 2.11 Approximate viscosity-temperature relationship for different crude
API gravities, reproduced with permission from ASTM International ASTM (2017) . . . 28 3.1 Schematic of the evolution cycle of a bubble showing nucleation,
growth at site, detachment, rise (and growth), and finally coales- cence with bulk gas-liquid interface . . . 31 3.2 Dissolved gas mole fraction as a function of pressure for a given ar-
bitrary system (units on both scales are arbitrary) . . . 32 3.3 Typical single bubble growth model schematic . . . 38 4.1 Absorption and desorption mass transfer across a gas-liquid interface 45 4.2 Graphical representation of the volumetric mass transfer coefficient
calculation . . . 48 5.1 Schematic of the window placement on the pressure vessel . . . 59 5.2 Schematic of the rapid depressurization experimental setup . . . 61 5.3 Pressure response curve of air-water system at 200 psia, reproduced
with permission from Society of Petroleum Engineers (Daniel et al., 2015) . . . 62 5.4 Schematic diagram of the gradual depressurization experimental setup 63 5.5 Exterior of the Hazardous Reactions Lab blast cell. . . 65 5.6 Gas evolution experiment located inside the blast cell . . . 65
Figure Page
5.7 Example of ternary diagram of flammable gas system (Holtappels et al., 2011) . . . 67 5.8 Ternary system with explosion limits at various pressures for air,
nitrogen and methane (Holtappels et al., 2011). . . 68 6.1 Example pressure trace for a gas evolution experiment . . . 75 6.2 SFT mixer power correlation . . . 78 6.3 Effect of viscosity and mixing on gas evolution at 500 psia and 25◦C 79 6.4 Gas evolution with SFT mixer and mixing power measurement at
500 psia and 10◦C . . . 80 6.5 Gas evolution trial replicate of Tech 500 with SFT mixer and mixing
power measurement at 500 psia and 25◦C . . . 82 6.6 Gas evolution trial replicate of Tech 80 with Autoclave mixer at 25◦C 84 6.7 Gas evolution trial replicate of Tech 500 with Autoclave mixer at 25
◦C . . . 85 7.1 Example pressure and resulting concentration change in time for a
complete absorption-desorption trial . . . 92 7.2 Normalized molar change in absorption and desorption experiments
at 500 psi (3.45 MPa) and 180 rpm . . . 93 7.3 Solubility of methane in dodecane at various pressures, data taken
from Srivastan et al. (Srivastan et al., 1992) . . . 94 7.4 Log of normalized bulk concentration vs time for absorption and
desorption at 500 psia and 180 rpm . . . 95 7.5 Desorption of methane in dodecane at 500 psia (3.45 MPa) and 45 ◦C 99 7.6 Desorption of methane in dodecane at 1,000 psia (6.89 MPa) and 45
◦C . . . 100
Figure Page
7.7 Desorption of methane in dodecane at 1,500 psia (10.3 MPa) and 45
◦C . . . 100 7.8 Desorption replicate of methane in dodecane at 1,000 psia (6.89
MPa), 100 rpm, and 45◦C . . . 101 7.9 Desorption replicate of methane in dodecane at 1,000 psia (6.89
MPa), 180 rpm, and 45◦C . . . 102 7.10 Desorption replicate of methane in dodecane at 1,500 psia (10.3
MPa), 100 rpm, and 45◦C . . . 102 7.11 Desorption replicate of methane in dodecane at 1,500 psia (10.3
MPa), 180 rpm, and 45◦C . . . 103 7.12 Absorption of methane in dodecane at 500 psia (3.45 MPa) and 45◦C104 7.13 Absorption of methane in dodecane at 1,000 psia (6.89 MPa) and 45
◦C . . . 104 7.14 Absorption of methane in dodecane at 1,500 psia (10.3 MPa) and 45
◦C . . . 105 7.15 Absorption replicate of methane in dodecane at 1,000 psia (6.89
MPa), 100 rpm, and 45◦C . . . 106 7.16 Absorption replicate of methane in dodecane at 1,000 psia (6.89
MPa), 180 rpm, and 45◦C . . . 106 7.17 Absorption replicate of methane in dodecane at 1,500 psia (10.3
MPa), 100 rpm, and 45◦C . . . 107 7.18 Absorption replicate of methane in dodecane at 1,500 psia (10.3
MPa), 180 rpm, and 45◦C . . . 107 7.19 Comparison of the measured absorption and desorption mass transfer
coefficients . . . 109
Figure Page
7.20 Effect of initial saturation pressure on the averaged absorption/desorption
mass transfer coefficients . . . 110
7.21 Effect of mixing speed on the averaged absorption/desorption mass transfer coefficients . . . 111
8.1 Schematic of the horizontal separator model discretization . . . 119
8.2 Separator cell indexing . . . 120
8.3 Separator adaptive mesh . . . 121
8.4 Bubble separation algorithm . . . 122
8.5 Multi-pass separator algorithm . . . 123
8.6 Length of bulk gas-liquid interface within the separator . . . 125
8.7 Rayleigh distribution of varying bubble modes . . . 126
8.8 Bubble density plot of base case separation with ξ= 0 . . . 134
8.9 Change in the volumetric interfacial area available for mass transfer at base case conditions withξ = 0 . . . 135
8.10 Bubble density plot of base case separation with ξ= 0.3 . . . 137
8.11 Percent bubbles removed as a function of variable height and time steps . . . 137
8.12 Percent bubble volume removed as a function of variable height and time steps . . . 138
8.13 Percent solution gas removed as a function of variable height and time steps . . . 139 8.14 Sensitivity analysis of the effect of liquid density and bubble distri-
bution mode with no supersaturation on percent bubbles removed . 140
Figure Page
8.15 Sensitivity analysis of the effect of liquid density and bubble dis- tribution mode with no supersaturation on percent bubble volume removed . . . 141 8.16 Sensitivity analysis of the effect of liquid density and bubble distri-
bution mode with no supersaturation on percent gas volume remaining141 8.17 Sensitivity analysis of the effect of liquid viscosity and bubble distri-
bution mode with no supersaturation on percent bubbles removed . 142 8.18 Sensitivity analysis of the effect of liquid viscosity and bubble dis-
tribution mode with no supersaturation on percent bubble volume removed . . . 143 8.19 Sensitivity analysis of the effect of liquid viscosity and bubble distri-
bution mode with no supersaturation on percent gas volume remaining143 8.20 Horizontal separator inlet depicting the worst-case, base-case and
best-case bubble density variations . . . 145 8.21 Effect of separator residence times on inlet gas volume remaining on
liquid viscosity of 100 cP . . . 145 8.22 Effect of separator residence times on inlet gas volume remaining on
liquid viscosity of 500 cP . . . 146 8.23 Effect of separator residence times on inlet gas volume remaining on
liquid viscosity of 1000 cP . . . 146 8.24 Sensitivity analysis of the effect of liquid viscosity and bubble distri-
bution mode with supersaturation on percent bubbles removed . . . 149 8.25 Sensitivity analysis of the effect of liquid viscosity and bubble distri-
bution mode with supersaturation on percent bubble volume removed149 8.26 Sensitivity analysis of the effect of liquid viscosity and bubble distri-
Figure Page
8.27 Sensitivity analysis of the effect of liquid viscosity and bubble distri- bution mode with supersaturation on percent gas volume remaining 150 8.28 Change in the effective liquid volume with changing supersaturation
ratio . . . 152 8.29 Sensitivity analysis of the effect of the entrained gas fraction and
bubble distribution mode with supersaturation on percent solution gas removed . . . 153 8.30 Effect of the percent liquid fill with supersaturation on percent solu-
tion gas removed . . . 154 8.31 Effect of the liquid residence time with supersaturation on the percent
solution gas removed . . . 155 8.32 Comparison of the Slettebø model to the current model attr= 60 s 157 8.33 Comparison of the Slettebø model to the current model attr= 45 s 157 8.34 Comparison of the Slettebø model to the current model attr= 30 s 158 8.35 Comparison of the Slettebø model to the current model attr= 15 s 158 8.36 Comparison of the Slettebø model to the current model across of a
range of liquid residence times . . . 159 8.37 Algorithm used in Slettebø’s model bubble velocity calculation . . . 160 8.38 Final solute concentration vs liquid Reynolds number: Comparison
between experimental data and separator model results . . . 162 8.39 Comparison of the separator model bubble velocity calculation to the
Stokes equation and Davies and Taylor velocity correlation . . . 164 A.1 SOP P&ID . . . 205 A.2 SOP P&ID Legend . . . 206
NOMENCLATURE
A . . . Surface area [m2]
a . . . Volumetric interfacial area [m2/m3] C . . . Concentration [mol/L]
CD . . . Drag coefficient
D . . . Diffusion coefficient [m2/s]
d . . . Diameter [m]
de/dh . . . . Bubble shape factor f . . . Frequency [1/s]
g . . . Gravitational acceleration [m/s2] H . . . Henry’s law constant [Pa]
h . . . Height [m]
J . . . Flux [mol/(m2·s)]
k . . . Mass transfer constant [m/s]
Ks . . . Souders-Brown coefficient [m/s]
L . . . Length [m]
M . . . Morton number
M W . . . . Molecular weight [g/mol]
N . . . Number frequency n . . . Moles [mol]
Np . . . Power number P . . . Pressure [Pa]
p . . . Partial pressure [MPa]
Pd . . . Probability density
Q . . . Volumetric flow rate [m3/s]
R . . . Ideal gas constant [J/(mol·K)]
r . . . Radius [m]
Re . . . Reynolds number Sc . . . Schmidt number SG . . . Specific gravity Sh . . . Sherwood number T . . . Temperature [K]
t . . . Time [s]
V . . . Volume [m3] v . . . Velocity [m/s]
W . . . Work [J]
x . . . Mole fraction
xeg . . . Entrained gas fraction Subscripts/Superscripts
∗ . . . Equilibrium condition 0 . . . Initial condition ave . . . Average
b . . . Bulk
c . . . Critical value g . . . Gas phase
i . . . Vertical vessel indexing (through space) int . . . Interface
j . . . Horizontal vessel indexing (through time) k . . . Element-wise indexing for a given (i, j) position l . . . Liquid phase
m . . . Mode r . . . Residence s . . . Stirred tank σ . . . Variability
t . . . Terminal settling ves . . . Vessel
Greek Symbols
δ . . . Film thickness [m]
. . . Energy dissipation rate [m2/s3] µ . . . Dynamic viscosity [Pa·s]
ν . . . Kinematic viscosity [m2/s]
ω . . . Mixing speed [s−1] ρ . . . Density [kg/m3] σ . . . Surface tension [N/m]
θ . . . Angle [rad]
ξ . . . Supersaturation ratio
CHAPTER I
INTRODUCTION
1.1 Gas-Liquid Separation
Gas-liquid separation is a critical unit operation in crude oil production. Flow from a petroleum reservoir results in a complex mixture of gases and liquids with a range of different physical properties. Typically, in upstream oil and gas operations, the gases and liquids in the multiphase stream must be first separated from one another before any additional processing can be done. Separating these multiphase fluids present numerous challenges, where any issues in design and operation of the separators creates bottlenecks requiring equipment adjustments downstream. These alterations add operating costs, increase downtime and/or reduced throughput, all of which result in lost value. Properly designing separators in the first place is of great importance since the cost of making repairs to a poorly functioning separator can often far exceed the initial cost of the separator itself (Bymaster et al., 2011).
Gas-liquid separators are tasked with separating both gases from the liquids and liquids from the gases. Poor phase separation can thus be classified into two distinct categories. Liquid droplets present in the exiting gas stream is termed liquid carry-over (LCO). On the other hand, gas bubbles present in the exiting liquid stream is known as gas carry-under (GCU) (Lavenson et al., 2016). A properly designed gas-liquid separator will ensure adequate separation of both gas and liquid phases while minimizing the total size requirement of the separator itself. An example of poor phase separation, specifically gas carry-under, can be seen in Figure 1.1. If
Figure 1.1: Example of gas carry-under in a horizontal separator
entrained gas phase in the liquid will not sufficiently separate. The resulting flow through the liquid outlet will then contain undesirable gas bubbles.
1.1.1 Challenges in Gas-Liquid Separation
As oil exploration and production ventures into more extreme conditions, gas- liquid separation is made more challenging. New developments in subsea processing, heavy oil production, and high-pressure separation require a more thorough under- standing of how this separation process occurs.
Subsea processing refers to the active handling and treatment of produced flu- ids at the seabed (McClimans et al.,2006;Fantoft et al.,2004). The aspects of subsea processing that have received the most attention for their potential value proposition include: multiphase boosting, liquid pumping, gas compression, and gas-liquid sep- aration. By performing the fluid processing at the seabed instead of on an offshore platform, operating costs from pumping and/or compressing can be saved. Perform- ing the gas-liquid separation at subsea conditions also has the potential to mitigate the risk of hydrate formation by avoiding the thermodynamic envelope where they may be formed (Di Silvestro et al., 2011). The rigors of technical designs required
to capture these opportunities necessitate a quantitative understanding of each sub- sea unit operation. Gas-liquid separation is one of the first bottlenecks in subsea processing and merits a critical assessment.
Increasingly, compact separation technologies are seen as the most viable solu- tion for subsea separation. The smaller design reduces manufacturing, transportation, and installation costs (Baker et al., 1990; Bymaster et al., 2011; Gomez et al., 1999;
Kristiansen et al., 2016; Rosa et al., 2001). Conventional separation vessels must be made thicker and heavier in order to sustain subsea pressures, while installation and loading requirements dictate further limitations on size and weight. The retriev- ability of the unit becomes a large concern as well. For example, the first subsea separation unit for water reinjection placed at the Troll oil field in the North Sea was so large that retrieving the unit in the case of malfunction would not be possi- ble (Horn et al., 2003). While these concerns may not completely disqualify a larger conventional design, the project economics may point more favorably towards smaller designs. Moreover, in typical offshore facilities, compact technologies are attractive due to minimal space requirements. Additionally, compact separators are also advan- tageous in retrofit applications. The lack of moving parts also adds to the simplicity of the design. The compact architecture results in reduced liquid residence times in the separator, thereby making it challenging to ensure that these separators meet specifications regarding gas carry-under with the liquids and liquid carry-over with the gas needed for safe downstream processing.
Heavy oil production represents another area where gas-liquid separation is be- ing pushed to its extreme. Heavy oils are by definition highly viscous, typically defined as having an API gravity less than 20◦ (Zaba et al.,1988). Degassing these heavy oils has been shown to pose a larger challenge compared to conventional crude oils (Laven- son et al.,2016). Overly conservative separator designs can result in excessively large separator costs. Reducing the separator footprint and optimizing separators already
in place are key in order for heavy oil production to remain competitive.
1.1.2 Gaps in Current Understanding
While gas-liquid separation is considered a mature technology in many realms, there are still important unanswered questions regarding the performance of separa- tors. There has been substantial work to understand how liquid carry-over affects sep- aration performance and how these concerns can be addressed and modeled (Chirinos et al.,n.d.;Mantilla,2008;Paras and Karabelas,1991;Viles,1993). Gas carry-under, however, has been largely neglected in the literature, though the consequences down- stream are no less important than those related to liquid carry-over.
Traditionally, sizing gas-liquid separators requires the use of either the Souders- Brown approach or droplet settling theory to ensure that droplets present in the overhead gas phase have sufficient time to settle within the limits of a separators residence time, thus minimizing liquid carry-over (Bothamley, 2013a,b,c). Designing separators to minimize gas carry-under, on the other hand, is largely left to simple rules of thumb and field experience. For example, the American Petroleum Institute’s design criterion for gas-liquid separators, known as API 12J, recommends different liquid retention times based on the API gravity of the oil (API,2009). These design guidelines can be seen in Table 1.1. Similar application-based approaches to separa- tor retention time recommendations are also presented in the 12th edition of GPSA Engineering Data Book (GPSA, 2004), although these recommendations have been removed in the most recent edition (GPSA, 2016).
Table 1.1: API 12J degassing guidelines (API,2009) Oil Gravity [◦API] Retention Time [min]
35 1
20 – 30 1 – 2
10 – 20 2 – 4
While the above degassing recommendations may work for simple, well-understood
systems, these guidelines are much too simplistic for many cases, especially when per- forming separation with viscous oils. As liquid viscosities increase, bubble velocities decrease making it more challenging to achieve good separation and minimize gas carry-under. Traditionally, only entrained bubbles are considered as a source of gas carry-under; however in viscous systems, the role of solution gas potentially contribut- ing to gas carry-under should also be considered (Lavenson et al., 2017).
Increased liquid viscosities are often associated with lower mass transfer coef- ficients (Lockemann and Schil¨under, 1995; Song et al., 2014). If a viscous gas-liquid multiphase dispersion experiences a pressure drop prior to entering a gas-liquid sep- arator, there is a possibility that mass transfer rates will not be fast enough for the fluid to attain equilibrium within the separator’s residence time. As such, the solution exiting the liquid stream may still be supersaturated with gas. This excess dissolved gas will eventually evolve out of the liquid phase downstream of the separator and present itself as unexpected gas carry-under. The mass transfer due to excess solution gas is also known as gas evolution.
Gas evolution out of a supersaturated solution can significantly contribute to gas carry-under in gas-liquid separators if not properly accounted for. The problem of gas carry-under due to gas remaining dissolved in the liquid is expected to become magnified with either increasing liquid viscosities and/or smaller separator residence times. The higher the operational pressure of a gas-liquid separator, the more po- tential there is for the evolution of solution gas to become a problem. This is due to the fact that more gas is solubilized in the liquid as the pressure of the system increases. All gas-liquid separator design criteria to date, implicitly assume that the entering fluid is in equilibrium with the gas and the time required for separation is only needed to account for the rise of entrained bubbles out of the liquid.
There have been few studies investigating the rate of gas evolution out of hydrocarbon systems from a macroscopic perspective. Of the few studies found,
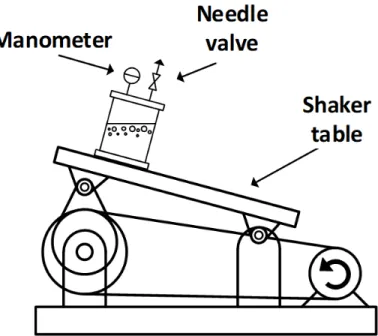
Figure 1.2: Schweitzer and Szebehely’s experimental setup, adapted fromSchweitzer and Szebehely (1950)
Schweitzer and Szebehely were the first to measure the rate of gas evolution out of liquids of different kinematic viscosities, including lubricating oils and other hydro- carbons (Schweitzer and Szebehely, 1950). Their experimental apparatus, shown in Figure1.2, consisted simply of a pressure vessel mounted on a shaker table.
Starting with a saturated liquid at some initial saturation pressure, the over- head gas is slowly leaked out in order to avoid bubble nucleation before the supersatu- rated state is reached. Once the supersaturated solution is established, the container is closed and the shaker table is turned on. The agitated liquid disrupts the pseudo- equilibrium of the supersaturated solution. The gas then evolves out of solution and reestablishes a new equilibrium in the overhead volume. They measured pressure changes in the bulk vapor using a manometer connected to the overhead vapor space.
As bubbles form in solution, the volume of the liquid phase increases, compressing the bulk vapor and thereby increasing pressure. Moreover, as the gas reaches the gas-liquid interface, it will add moles of gas to the overhead vapor space resulting in a pressure increase until a new equilibrium is established.
Schweitzer and Szebehely found that the time required for gas evolution in- creased roughly with increasing liquid kinematic viscosity (Schweitzer and Szebehely, 1950). While simple in design, the experiment suffered from several shortcomings.
Gas evolution was performed at atmospheric pressure and neither the supersatura- tion ratio (i.e. driving force) or the gas-liquid interfacial area during the mixing were quantified. By only measuring the rate of pressure change and not accounting for how much gas was initially dissolved in solution, it is not possible to distinguish whether an increase or decrease in the gas evolution rate was due to an increased driving force or the different liquid properties mediating the rate of mass transfer. Finally, only air was used as the gas phase. The choice of the gas phase is important since different species have the potential to impact the rate of gas evolution one way or another.
Hunt also experimentally studied the evolution of gas out of hydrocarbon sys- tems (Hunt, 1995). In her thesis work, Hunt used a custom piston rig to perform gas evolution tests in a manner similar to Schweitzer and Szebehely, though with a few key differences. A simplified schematic of the piston rig used in her studies can be seen in Figure1.3. Instead of slowly depressurizing the liquid, followed by initiating the gas evolution with mechanical agitation, the piston is quickly drawn back using hydraulic fluid, simulating a more instantaneous pressure drop. The rapid change in pressure initiates the gas evolution and the pressure recovery back to equilibrium is recorded.
Figure 1.3: Simplified experimental diagram of Hunt’s piston rig, adapted fromHunt (1995)
The advantage of using of a piston to perform the depressurization instead of allowing the gas to escape through a valve is that the experiment avoids having to deconvolute gas evolution from any transience associated with potential choked flow through a valve. The disadvantage, however, is that the maximum pressure the internal volume can withstand is limited by the piston’s seal. While Hunt performed experiments using different hydrocarbon gases and liquids, fluid agitation within the vessel was only possible using pulsed liquid jets on the side of the vessel. Furthermore, the experiments were limited to a maximum pressure of 435 psia (3.0 MPa).
1.2 Research Goals
The primary goal of this research is to develop a new gas evolution experiment capable of measuring the rates of solution gas leaving a supersaturated solution at
high pressures and different rates of liquid mixing. The experiment must be capable of using hydrocarbons in both the gas and liquid phases. Using a reference hydrocarbon system of n-dodecane as the liquid phase and methane as the gas phase, a theoretical mass transfer model is validated for the system.
The second goal of this research is to use the experimentally validated mass transfer model and develop a horizontal separator modeling framework to allow for degassing predictions at different process conditions. The horizontal separator de- gassing model must allow for the prediction of gas carry-under due to both entrained gas and excess solution gas in the liquid inlet. Using the horizontal separator model, the effect of gas evolution on separation performance is evaluated.
1.3 Dissertation Organization
The first chapter in this dissertation provides the motivation for the study of gas evolution and its relation to separator degassing. Chapter2provides an overview of separator technology to date. Background of bubble dynamics and gas-liquid mass transfer are provided in Chapters 3 and 4, respectively. Chapter 5 goes over the gas evolution experimental development and gas evolution results are presented in Chapter 6. By further refining the experimental procedure, both rates of absorption and desorption are measured using a reference hydrocarbon system and presented in Chapter 7. The horizontal separator model development and results are presented in Chapter 8. Finally, the study conclusion and recommendations are summarized in Chapters 9 and 10.
CHAPTER II
GAS-LIQUID SEPARATORS
Gas-liquid separators are used to separate a multiphase stream into gaseous and liquid components. The separationprocess istwo-fold: gases are separatedfrom theliquidsandliquidsareseparatedfromthegases. Awelldesignedseparatorshould be able to separate both phases from one another within the desired specifications.
Gas-liquid separators are generally categorized as either two-phase or three-phase separators. Two-phase separators are responsible for separating a single gas phase from a single liquid phase. Three-phase separators, on the other hand, are tasked withseparatingasinglegasphaseaswellastwoimmiscibleliquids fromone another.
Within the oiland gas industry, three-phaseseparators are commonly used when an inlet streamconsists significantamounts of gas, oil, and water.
If there isa highratio of gases toliquids inthe streambeing separated, these separators are sometime calledgas scrubbers. Gas-liquidseparators are also referred to as traps when the fluid being handled comes directly from the wellhead. Other names for gas-liquid separators include: stage separator, knockout vessel, expansion vessel,amongst others(Lake andArnold,2007). Thoughthe conditionsunder which separation isperformed vary fromone case to another, the generaldesign considera- tions for theseseparators remains the same.
2.1 Conventional Gas-Liquid Separators
Conventional gas-liquid separators rely on gravity to separate phases of dif- ferent densities. As the multiphase stream flows through the separator, buoyancy
propels bubbles of entrained gas towards the overhead gas phase while the weight of liquid droplets in the gas phase drives them towards the bulk liquid. With enough time, both phases will completely separate from one another.
Conventional separators generally contain three distinct sections responsible for the separation: an inlet conditioning section, gravity settling section, and a mist extraction section (Stewart and Arnold, 2008). The inlet conditioning section gen- erally consists of a device placed at the separator inlet that preconditions the flow, often performing the bulk of the separation. The gravity settling section is required to allow both the gas and liquid phases to stratify as they flow through the separa- tor. Here, the droplets fall out of the gas overhead and the entrained bubbles rise out of the bulk liquid. Prior to exiting the separator, the gas phase usually passes through a mist extraction section as well. The mist extractor is tasked with removing smaller droplets that did not have the chance to re-enter the liquid during its time in the gravity settling section (Arnold and Stewart, 1998). Gas-liquid separators are usually designed in three different configurations: horizontal, vertical and spherical.
2.1.1 Horizontal Separators
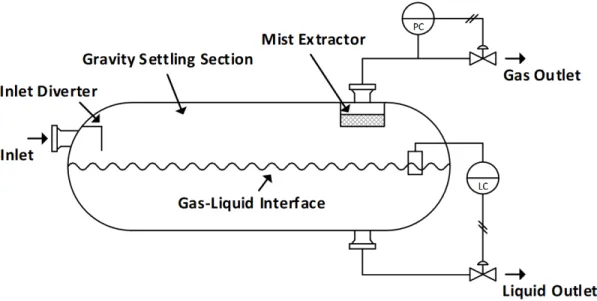
A schematic of a horizontal gas-liquid separator is presented in Figure 2.1.
The multiphase stream enters the separator at the inlet and passes through the inlet conditioning device, shown here as a diverter plate. The stream flows through the gravity settling section where the liquid accumulates at the bottom and the gas at the top. Within this section, the liquid is given time to rid itself of any entrained or dissolved gas present within the liquid. This process is known as degassing. The time the overhead gas phase remains in the gravity settling section gives liquid droplets a chance to fall out of the gas stream. As it exits, the gas passes through the mist extractor. Mist extractors are usually composed of wire mesh, plates or vanes used to enhance coalescence of smaller droplets still present in the gas stream. Separators
Figure 2.1: Schematic of a horizontal separator, adapted from Stewart and Arnold (2008)
will usually have a liquid level control, shown in the figure as LC. The level control regulates the exiting liquid flow rate to maintain a stable liquid level within the separator. Also, the pressure controller, shown in the figure as PC, regulates the exiting gas flow rate to maintain a constant pressure within the vessel.
2.1.2 Vertical Separators
Vertical separators usually contain the same internals as the horizontal separa- tor, but are instead positioned vertically as the name implies. An example schematic of a vertical gas-liquid separator is shown in Figure 2.2. Similar to the horizontal separator, the multiphase stream enters through the inlet and passes through the inlet conditioning device. The liquid flows downwards towards the exit at the bot- tom of the separator while the gas exits through the top. The gas exits through the mist extractor to remove droplets too small to be separated from the overhead gas phase while in the gravity settling section. As with the horizontal separator, verti- cal separators usually have liquid level and pressure controls that regulate the liquid and gas flow rates, respectively. The main difference between horizontal and vertical
Figure 2.2: Schematic of a vertical separator, adapted fromStewart and Arnold(2008) separators is how the bulk liquid flows relative to the entrained gas. Within horizon- tal separators, the liquid flow is normal to the direction of the entrained gas flow.
Vertical separators, on the other hand, require that any entrained gas flows against the downward flow of the liquid. This makes liquid degassing more challenging in a vertical separator than what it would otherwise be in a horizontal separator.
2.1.3 Spherical Separators
Spherical separators, an example of which is shown in Figure 2.3, are less common than either horizontal or vertical separators. As name implies, the spherical separator is contained within a sphere. In essence, a spherical separator is a vertical separator that has been shrunk down so that there are no vertical walls left within the design, only the end caps. Within this design, the multiphase inlet enters through the top of the separator and is diverted to the sides of the vessel by a dished head.
Figure 2.3: Schematic of a spherical separator, adapted from Stewart and Arnold (2008)
As the liquid collects within the liquid collection section, the bulk phases separate and the liquid stream exits through an opening in the separator’s side below the gas- liquid interface. The gas being separated from the liquid exits the separator through the mist extractor then subsequently through the gas outlet down the middle of the separator.
The rationale for designing gas-liquid separators as a sphere stems from the fact that spheres are the most efficient method of containing pressure. In theory, spherical separators were designed to take advantage of the best characteristics of both horizontal and vertical separators, however in practice they exhibit some of the worst separation performance (Stewart and Arnold, 2008). Spherical separators also have very limited surge capacity and are difficult to both size and operate. As such, spherical separators will not be further considered here.
2.1.4 Separator Selection
The process of selecting between a horizontal and vertical separator for a given application requires an understanding of the benefits and drawbacks offered by each design. As a general rule of thumb, vertical separators are usually used when the gas-liquid ratio is high while horizontal separators are used when the gas-liquid ratio is low, though there are many other design considerations that must be accounted for.
Horizontal separators are generally acknowledged to have better separation properties compared to vertical separators (Lake and Arnold, 2007). In a horizontal separator, the flow direction of the phase being separated (either liquid droplets in the gas phase or gas bubbles in the liquid phase) is not countercurrent to the flow of the bulk phase outlet. Liquid droplets fall perpendicular to the bulk gas phase flow while the bubbles rise perpendicular to the liquid flow. This means that the net velocity of the phase being separated is not metered by the flow of the bulk phase exiting the separator. Horizontal separators are also best suited for liquid-liquid separation where the liquid phase is further split into two different streams.
Potentially foaming liquids are best handled by a horizontal separator. As the liquid flows through a horizontal separator, the bulk phases are allowed to stratify physically within that space. Any foam generated at the inlet of the horizontal separator will also have the separator’s liquid residence time to decay and hopefully completely dissipate. Since new interfacial area between the bulk gas and liquid phases in a vertical separator is not generated as the liquid flows through the vessel, any foam formation at the vessel’s inlet has a much higher chance of accumulating and potentially interfering with the separation performance.
Vertical separators, on the other hand, are best suited when the overall liq- uid flow is low. Vertical separators occupy less plan area than what an equivalent horizontal separator would require. This aspect is especially important in situations
Figure 2.4: Example three-stage separation process, adapted fromStewart and Arnold (2008)
where available area is at a premium, such as offshore platforms or existing refiner- ies. Vertical separators also offer considerable advantages when it comes to solids handling, since the liquid outlet can be placed directly at the center of the vessel bot- tom. This can help mitigate sand buildup within the separator (Arnold and Stewart, 1998). Finally, vertical separators offer greater surge capacity compared to horizontal separators.
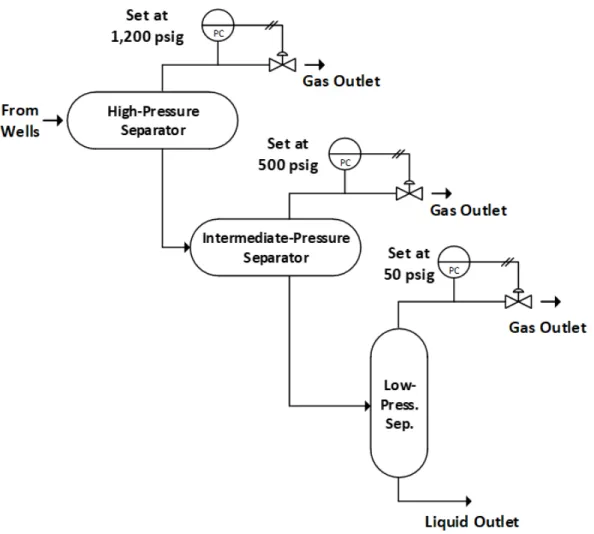
The pressure at which the gas-liquid separation is to be performed may also play a significant role in the selection of the vessel design. If the hydrocarbon stream has a pressure drop prior to entering the separator (or within the separator itself), some amount of dissolved gas will come out of solution. Vessels where a significant
amount of solution gas is expected to come out are often referred to as flash vessels, though they are identical in form to the aforementioned separators. Since liquid degassing is usually the separation bottleneck in these high pressure units, these separators are typically horizontal in orientation. As example of this can be seen the three-stage separation process shown in Figure 2.4.
2.2 Cyclone Separators
As petroleum production has been pushed to more remote and extreme en- vironments, there has been increased interest in separator vessels that are smaller in size compared to conventional separators. Cyclone separators can be viewed as a more compact alternative to conventional gas-liquid separators. Cyclone separators, also referred to as compact separators, are separators that rely on centrifugal forces as the driving force for phase separation instead gravity alone. Cyclone separators func- tion by swirling the incoming gas-liquid multiphase stream. This swirling produces a centrifugal force that drives the denser liquid phase towards the separator walls while the less-dense gas phase remains in the center. The centrifugal acceleration gener- ated by cyclone separators can exceed the acceleration produced by gravity alone by up to three orders of magnitude (Austrheim, 2006). The increased driving force for separation allows cyclone separators to be smaller and lighter than traditional separators.
Cyclone separators come in a variety of different configurations. An example of a popular cyclone separator, the Gas-Liquid Cylindrical Cyclone (GLCC) can be seen in Figure 2.5 (Kouba and Shoham, 1996). The GLCC functions by feeding the multiphase gas-liquid stream through an inclined inlet section which then enters tangentially to the separator. Due to the angle of the inlet, the gas-liquid stream is swirled around the body of the separator, promoting separation of the two phases.
The liquid flows down the separator wall towards the liquid exit and the gas flows
Figure 2.5: Schematic of a GLCC separator, adapted from Erdal et al. (1997) upwards towards the gas exit. The GLCC is known as a tangential flow centrifugal separator since the inlet flow enters the main separator body tangentially. Axial flow separators, on the other hand, swirl the liquid along the same axis as the inlet flow by passing the multiphase stream over a helical vane.
Although cyclone separators have a size advantage over conventional gas-liquid separators, they are not commonly employed in production operations. The centrifu- gal force which is required for separation, is very sensitive to the gas and liquid flow rates. Variability in the inlet flow will more than likely result in poor separation ef- ficiencies. Also, the energy consumed by the swirling of the gases and liquids results in a pressure drop that is larger than what would otherwise be expected in a con- ventional separator. This pressure drop could result in higher pumping/compression cost further downstream. Lastly, the design of cyclonic separators is often proprietary, making it difficult for engineers to model and operate these separators.
2.3 Separator Internals
Conventional gas-liquid separators can be equipped with various separator internals in attempt to increase the separation efficiency. Separator internals help promote better separation by more evenly distributing the stream flow, increasing coalescence of both droplets and bubbles, as well as mitigating conditions that are detrimental to good separation. Conditions that involve foaming, liquid waves within the separator, or solid deposition should be avoided if good separation efficiencies are to be maintained.
2.3.1 Inlet Conditioning Devices
The purpose of inlet conditioning devices is to reduce the momentum of the inlet stream flowing into the separator (Bahadori,2014). This decrease in the stream momentum right at the beginning of the separator usually performs the initial bulk gas-liquid separation as well as preconditions the distribution of the gas flow. Ideally, droplet shearing is also minimized within this region to avoid droplet breakup into smaller droplets. There are many different types of inlet conditioning devices, as seen in Figure 2.6.
The diverter plate and dished head function by rapidly changing the direction of the inlet flow. By imposing a sudden change in the direction of the flow, the denser liquid phase with a higher momentum compared to the gas phase strikes the plate, accumulates, and falls to the bottom of the vessel. The less-dense gas phase tends to flow around the plate and disengage from the liquid. The benefit of the diverter plate-type inlet conditioning devices is that they are relatively simple to design and install.
The reversed pipe or half-pipe configuration also consist of a relatively simple design. The reversed pipe is simply a piece of pipe that redirects the flow towards
Figure 2.6: Example of different inlet conditioning devices, adapted from Bothamley (2013a)
the separator. The disadvantage of pipe-type inlet conditioning devices is that they have the potential to further entrain gas into the liquid.
More complex inlet conditioning devices include inlet vanes and inlet cyclones, both relying on centrifugal forces to enhance separation. Inlet vanes consist of a series of curved fins that divert the flow outward into the separator. The curvature of the vanes promotes inertial impact of liquid droplets while the gas flows around them.
Cyclonic inlet conditioning devices generate the centrifugal forces by swirling the in- let stream tangentially, similar to the behavior standalone cyclone separators seen in Section 2.2. The same disadvantages apply to centrifugal inlet conditioning devices as previously mentioned for standalone cyclone separators, namely: the separation performance is sensitive to the inlet flow and the resulting separation produces a rela- tively high pressure drop. The advantage of using centrifugal-type separators as inlet conditioning devices as opposed to standalone units is that if the inlet conditioning device fails to properly separate the gas and liquid phases, the phase separation can
Figure 2.7: Wave breakers inside horizontal separator, adapted from Stewart and Arnold (2008)
still occur within the vessel volume, mitigating to some extent the sensitivity to the flow rate. New separator designs typically employ either vanes or centrifugal inlet conditioning devices (Bothamley, 2013a).
2.3.2 Wave Breakers
Large horizontal separators often require wave breakers to prevent sloshing within the vessel. These anti-wave elements usually consist of perforated baffles po- sitioned along the length of the separator. The baffles help minimize disturbances to the liquid flow and are particularly useful in three-phase separation. An example of these wave breakers can be seen in Figure 2.7.
2.3.3 Foam Breakers
Foaming has the potential to greatly reduce the capacity of gas-liquid separa- tors due to the increased residence times required to dissipate the foam. If foam is still present at the end of a separator’s residence time, the foam can be pulled into the separator outlet, potentially jeopardizing equipment not meant to handle foam further downstream. Foam breakers assist in foam mitigation by forcing the foam
Figure 2.8: Example of foam breaker inside a horizontal separator, adapted from Arnold and Stewart (1998)
through a series of parallel plates. These closely spaced plates, as shown in Figure 2.8, expose the foam to additional surface area, breaking up the foam as it is dragged across the surface of the plate.
2.3.4 Mist Extractors
As the gas flows through the separator, droplets too small to be separated within the bulk of the separator will still be present in the exiting gas stream. To ensure as much of this fine mist is captured as possible, mist extractors are often employed at the gas outlet. Like the inlet conditioning device, there are a variety of different mist extractors available. Common mist extractor designs include wire mesh, vane packs, as well as cyclones.
Wire mesh mist extractors, as the name implies, is a mesh of knitted wires through which the exiting gas stream is passed. Wire meshes are also the most common mist extractors found in production operations (Stewart and Arnold,2008).
The knitting of the wires allows the meshes to have a large surface area and void fraction. The effectiveness of the wire mesh is dependent largly on the gas velocity being in the proper range. If the gas velocity is too low, the fine droplets will simply drift through the mesh without colliding with any of the wire elements. If the gas
Figure 2.9: Wire mesh mist extractor, reproduced with permission from Elsevier, B.V. Stewart and Arnold (2008)
velocity is too high, liquid droplets that collided with the wires will be re-entrained into the gas phase. An example of a wire mesh can be seen in Figure 2.9.
Vane mist extractors function in a similar manner to wire meshes, though parallel plates are instead used as a source of surface area available for droplet colli- sion. Within a vane pack, these parallel plate contain directional changes, impinging droplets onto the surface where they coalesce and fall to the liquid collection area.
An example of a vane mist extractor can be seen in Figure2.10.
Mist extractors are susceptible to plugging if the liquid stream is prone to solid deposition. Bypass lines or removing the mist extractor entirely may be needed to rectify the issue if the plugging is acute (Lyons, 2009).
2.4 Separator Sizing
When sizing a separator, the capacity of the separator in both the gas and liquid phases must be considered. Proper sizing of a gas-liquid separator is contingent on allowing the liquids to sufficiently separate from the gas phase and the gases to
Figure 2.10: Vane mist extractor, adapted fromArnold and Stewart (1998) sufficiently separate from the liquid phase. Both the droplet and bubble separation capacities can be considered independently. Since liquid degassing is the main focus of this research, only horizontal separators will be considered here.
2.4.1 Droplet Separation Capacity
The residence time of the gas phase within the separator can be calculated by dividing the vessel length,Lves, by the gas phase velocity, vg,
tr,g= Lves
vg (2.1)
Within the gravity separation section of the gas-liquid separator, a droplet can be considered separated if it is large enough to travel from the gas inlet to the liquid surface within the residence time of the gas phase (Bothamley,2013b). If the vertical height between the droplet inlet and the liquid surface is taken as hg, the minimum droplet velocity required for separation can be calculated using
vt = hgvg
Lves (2.2)
where vt is the terminal droplet velocity. This terminal droplet velocity is then dependent on the size of the droplet as well as the physical properties of the liquid and gas phases. Performing a force balance on a droplet in an upward flowing gas stream, the terminal settling velocity of the droplet can be calculated
vt= s
4gd(ρl−ρg)
3CDρg (2.3)
The drag coefficient, CD, is known to be a function of the Reynolds number of a droplet in the gas phase. The Reynolds number is thus defined as
Reg = dvρg µg
(2.4) If the droplet Reynolds number is Reg < 1, the droplet is said to be in the Stokes flow regime. The droplet drag coefficient can then be calculated using
CD= 24
Reg (2.5)
For droplets with Reynolds numbers larger than 1, but less than 1000, the drag coefficient correlation formulated by Putnam can be used (Putnam, 1961)
CD = 24
Reg 1 + Re2/3g
6
!
(2.6) This range in droplet Reynolds number is usually sufficient to characterize the droplet velocities in most separator applications (Austrheim, 2006). Combining Equations 2.2 and 2.3, the smallest droplet diameter expected to be completely sep- arated can be found, d100. All droplets larger than this diameter are assumed to be completely separated within the gravity settling region of the separator. Only droplets smaller than d100 are assumed to persist in the exiting gas stream. When designing a separator, the vessel diameter and/or vessel length can be adjusted to
ensure droplets of a given size are separated.
2.4.2 Bubble Separation Capacity
Historically, sizing separators for an adequate bubble separation capacity has been done using the API 12J guidelines shown in Table 1.1. For a given crude API gravity, the API 12J guidelines will recommend a liquid residence time range required for adequate bubble separation. There is reason to believe, however, that these guidelines represent an oversimplification of the degassing process since the only variable assumed to significantly effect liquid degassing is the API gravity of the oil.
The API gravity of a crude oil is generally known since the quality of a crude is mainly evaluated based on this metric (Riazi, 2005). Higher API gravity oils have a lower specific gravity which also usually correlates to lower aromatic content, lower pour point, lower viscosity and lower carbon-to-hydrogen weight ratio. Higher API crudes are considered lighter while lower API crudes are considered heavier. The API gravity of an oil can be directly calculated from the specific gravity at 60 ◦F.
◦API = 141.5
SG −131.5 (2.7)
where the specific gravity at 60◦F is defined as
SG = ρoil
999 [kg/m3] (2.8)
Taking the average of the API gravities and the recommended residence times, and converting the API gravities to liquid densities, the API 12J guidelines can then be seen in Table 2.1. Here it is shown that increased liquid densities should re- quire larger residence times. From a physical perspective, these results are somewhat confounding. For a bubble rising in liquid, the bubble velocity is a function of the bubble’s buoyancy in the liquid, assuming no bubble growth within the medium. This
velocity can be calculated using Equation 2.3 in an analogous process to the droplet velocity calculation. According to this equation, holding all else constant, higher liq- uid densities should result in faster bubble velocities. Faster bubble velocities would then in turn require less liquid residence time to be separated. This reasoning is in contradiction to the results shown in Table2.1.
Table 2.1: API 12J degassing guidelines with liquid density Oil Density
[◦API]
Specific Gravity
Density [kg/m3]
Retention Time [min]
35 0.85 849 1
25 0.90 903 1.5
15 0.97 965 3
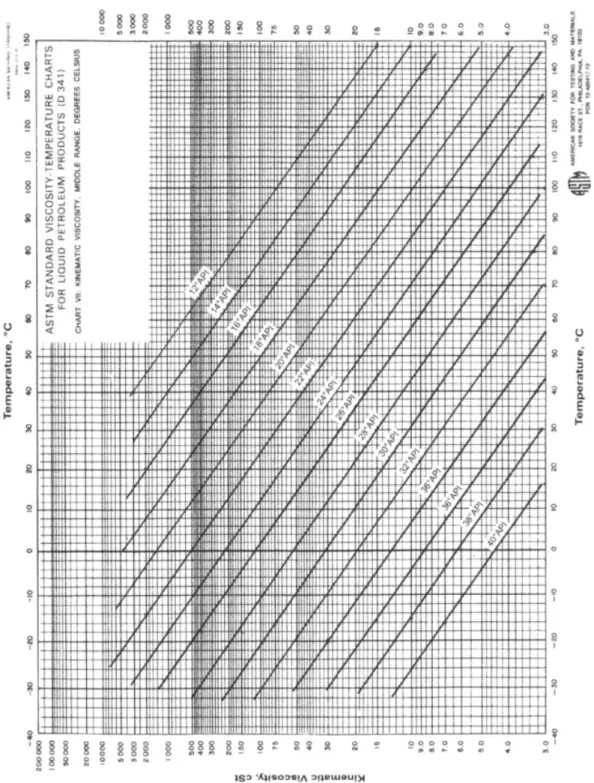
While the API gravity of a crude oil is defined from the specific gravity, the API gravity is known to correlate with the liquid viscosity as well. The chart in Figure2.11depicts the approximate kinematic viscosity and temperature correlation used by the American Society for Testing and Materials (ASTM) for different crude oil API gravities. Using this correlation, approximate kinematic viscosities can be found at 60 ◦F (15.6 ◦C). Converting to dynamic viscosities, these values are listed in Table 2.2.
Table 2.2: API 12J guidelines with liquid viscosity Oil Density
[◦API]
Density [kg/m3]
Kinematic Viscosity [cSt]
Dynamic Viscosity [cP]
Retention Time [min]
35 849 5.0 4.2 1
25 903 130 120 1.5
15 965 5000 4800 3
Assuming a bubble is within the Stokes flow regime, the bubble velocity will vary in proportion to the liquid viscosity by a factor of v ∝ µ−1/2. Assuming that the residence time requirement of the liquid is inversely proportional to the bubble velocity, the liquid residence time will be proportional to the liquid viscosity by a factor of tr ∝ µ1/2. With the rapid increase in dynamic liquid viscosities shown in
Figure 2.11: Approximate viscosity-temperature relationship for different crude API gravities, reproduced with permission from ASTM International ASTM (2017)
Table 2.2, the associated liquid residence time increases do not adhere to the previ- ously stated proportionality. Although viscosity correlations in the low API gravity range are known to be unreliable (Riazi,2005), these conclusions further indicate that the API 12J guidelines may be poorly suited for some conditions, particularly more viscous oils.
While other degassing guidelines exist, most are not particularly quantitative, especially if gas evolution is to be considered in conjunction with entrained gas bubbles rising out of the liquid. The GPSA Engineering Data Book, for example, recommends that the velocity of a single 200µm bubble within the fluid of interest be calculated and multiplied by the liquid residence time within the separator. If the bubble rise is greater than the liquid height, it can be assumed that resulting liquid would contain a free gas volume of less than 1% (GPSA, 2016). There is however, no quantitative evidence provided for this assertion.
Bothamley also recommended that a version of the droplet separation capacity calculation seen in Section 2.4.1 be employed for bubbles in the liquid phase instead (Bothamley,2013b). This method requires the estimation of a bubble size distribution due to a liquid jet plunging into a bulk liquid, an estimation of the volume of entrained gas, and calculation of the bubble velocities using Equations2.1–2.3replacing the gas with the liquid phase physical properties. While more quantitative than the previously presented degassing guidelines, the gas and liquid phase entering the separator are still assumed to be at equilibrium with one another. If gas evolution is to be accounted for within horizontal separator designs, the transient liquid concentration must be considered as well as changes to the total gas-liquid interfacial area over time. In order to create a better understanding of the degassing process with the occurrence of gas evolution, the dynamics of bubbles in liquids must first be considered.
CHAPTER III
BUBBLE DYNAMICS
The following material in Sections 3.1 to 3.4 has been reproduced in part with permission fromElsevier, B.V. [Lavenson, D. M., Kelkar, A. V., Daniel, A. B., Mohammad,S.A.,Kouba,G.,Aichele,C.P.(2016). ”Gasevolutionrates-Acritical uncertainty in challenged gas-liquid separations” Journal of Petroleum Science and Engineering,147, 816-828].
Gas evolution,inthe presentcontext, refers tothe process of evolutionto the bulkgasphaseofinitiallydissolvedgasfromsolution. Theentirelifecycleofabubble beingproducedbyexcesssolutiongas,startingfromnucleation,throughdetachment, growth, rise, and coalescence is shown in Figure 3.1. Gas evolution rates are thus expected to depend on the rates of bubble nucleation, growth, rise and coalescence atbulk gas-liquidinterface.
3.1 Bubble Nucleation
Given the definition provided for the evolution of solution gas, it is appro- priate to begin with an examination of the literature on bubble nucleation. Bubble nucleationis awell-studied field due tothe several academic and industrial intersec- tions-boiling,cavitation,thebeverageindustry, electrolysis, andmore(Carey,1992;
Ghiaasiaan, 2007). Bubbles are generated due todisruptions inthe thermodynamic equilibriumstateof thesystem asaresultof eithersuper-heatingorsupersaturation.
A supersaturatedstate isa prerequisite for gas evolution inthe contextof gas-liquid separators. Gas bubbles in the liquid will form as a result of a phase change occur-
Figure 3.1: Schematic of the evolution cycle of a bubble showing nucleation, growth at site, detachment, rise (and growth), and finally coalescence with bulk gas-liquid interface
ring in the system that is driven by the super-saturated condition. While superheated systems have their relevance in certain applications, this review and discussion will henceforth use the broader term of supersaturation to describe systems of interest.
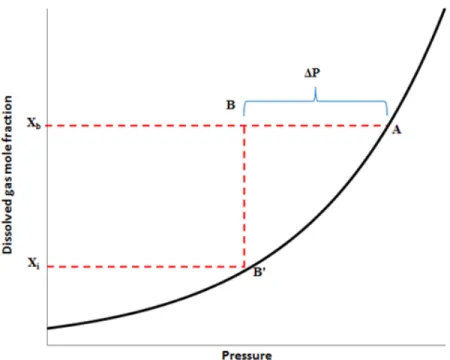
The driving force of bubble formation is the degree of supersaturation. Con- sider first a hypothetical gas-liquid system at saturation with some mole fraction,xb, of dissolved gas in the liquid phase at a given temperature and pressure, condition A.
Suppose the same system is now depressurized isothermally some ∆P to a new state B, resulting in a supersaturated liquid. The liquid will release gas to reach a new saturation mole fraction, xi, of dissolved gas until it again reaches the equilibrium solubility curve at B. This process is illustrated in Figure3.2.
Lubetkin (Lubetkin and Blackwell, 1988) defines the supersaturation ratio,ξ, as
Figure 3.2: Dissolved gas mole fraction as a function of pressure for a given arbitrary system (units on both scales are arbitrary)
ξ= xb
xi −1 (3.1)
In supersaturated systems, bubbles emerge from so-called nuclei in various sizes. At radii below a certain critical value,Rc, bubbles will tend to collapse, while for radii equal to or greater than the critical value, they will tend to grow and participate in the gas evolution cycle. This critical radius is defined using the Laplace equation
∆P = 2σ
Rc (3.2)
where