RESEARCH ARTICLE
Comparative genomics reveals
insights into avian genome evolution and adaptation
Guojie Zhang,1,2*†Cai Li,1,3*Qiye Li,1,3Bo Li,1Denis M. Larkin,4Chul Lee,5,6 Jay F. Storz,7Agostinho Antunes,8,9Matthew J. Greenwold,10Robert W. Meredith,11 Anders Ödeen,12Jie Cui,13,14Qi Zhou,15Luohao Xu,1,16Hailin Pan,1Zongji Wang,1,17 Lijun Jin,1Pei Zhang,1Haofu Hu,1Wei Yang,1Jiang Hu,1Jin Xiao,1Zhikai Yang,1 Yang Liu,1Qiaolin Xie,1Hao Yu,1Jinmin Lian,1Ping Wen,1Fang Zhang,1Hui Li,1 Yongli Zeng,1Zijun Xiong,1Shiping Liu,1,17Long Zhou,1Zhiyong Huang,1Na An,1 Jie Wang,1,18Qiumei Zheng,1Yingqi Xiong,1Guangbiao Wang,1Bo Wang,1
Jingjing Wang,1Yu Fan,19Rute R. da Fonseca,3Alonzo Alfaro-Núñez,3Mikkel Schubert,3 Ludovic Orlando,3Tobias Mourier,3Jason T. Howard,20Ganeshkumar Ganapathy,20 Andreas Pfenning,20Osceola Whitney,20Miriam V. Rivas,20Erina Hara,20
Julia Smith,20Marta Farré,4Jitendra Narayan,21Gancho Slavov,21Michael N Romanov,22 Rui Borges,8,9João Paulo Machado,8,23Imran Khan,8,9Mark S. Springer,24
John Gatesy,24Federico G. Hoffmann,25,26Juan C. Opazo,27Olle Håstad,28 Roger H. Sawyer,10Heebal Kim,5,6,29Kyu-Won Kim,5Hyeon Jeong Kim,6 Seoae Cho,6Ning Li,30Yinhua Huang,30,31Michael W. Bruford,32
Xiangjiang Zhan,32,33Andrew Dixon,34Mads F. Bertelsen,35Elizabeth Derryberry,36,37 Wesley Warren,38Richard K Wilson,38Shengbin Li,39David A. Ray,26‡
Richard E. Green,40Stephen J. O’Brien,41,42Darren Griffin,22Warren E. Johnson,43 David Haussler,40Oliver A. Ryder,44Eske Willerslev,3Gary R. Graves,45,46
Per Alström,47,48Jon Fjeldså,46David P. Mindell,49Scott V. Edwards,50
Edward L. Braun,51Carsten Rahbek,46,52David W. Burt,53Peter Houde,54Yong Zhang,1 Huanming Yang,1,55Jian Wang,1Avian Genome Consortium,§ Erich D. Jarvis,20†
M. Thomas P. Gilbert,3,56†Jun Wang1,55,57,58,59
†
Birds are the most species-rich class of tetrapod vertebrates and have wide relevance across many research fields. We explored bird macroevolution using full genomes from 48 avian species representing all major extant clades. The avian genome is principally characterized by its constrained size, which predominantly arose because of lineage-specific erosion of repetitive elements, large segmental deletions, and gene loss.
Avian genomes furthermore show a remarkably high degree of evolutionary stasis at the levels of nucleotide sequence, gene synteny, and chromosomal structure. Despite this pattern of conservation, we detected many non-neutral evolutionary changes in protein-coding genes and noncoding regions. These analyses reveal that pan-avian genomic diversity covaries with adaptations to different lifestyles and convergent evolution of traits.
W
ith ~10,500 living species (1), birds are the most species-rich class of tetrapod vertebrates. Birds originated from a the- ropod lineage more than 150 million years ago during the Jurassic and are the only extant descendants of dinosaurs (2,3). The earliest diversification of extant birds (Neornithes) oc- curred during the Cretaceous period. However, the Neoaves, the most diverse avian clade, later underwent a rapid global expansion and radiation after a mass extinction event ~66 million years ago near the Cretaceous-Paleogene (K-Pg) bound- ary (4,5). As a result, the extant avian lineages exhibit extremely diverse morphologies and rates of diversification. Given the nearly complete global inventory of avian species, and the immense col- lected amount of distributional and biological data, birds are widely used as models for investigating evolutionary and ecological ques-tions (6,7). The chicken (Gallus gallus), zebra finch (Taeniopygia guttata), and pigeon (rock dove) (Columba livia) are also important model organisms in disciplines such as neuroscience and developmental biology (8). In addition, birds are widely used for global conservation priorities (9) and are culturally important to human so- cieties. A number of avian species have been do- mesticated and are economically important. Farmed and wild water birds are key players in the global spread of pathogens, such as avian influenza virus (10).
Despite the need to better understand avian genomics, annotated avian genomic data was previously available for only a few species: the domestic chicken, domestic turkey (Meleagris gallopavo) and zebra finch (11–13), together with a few others only published recently (14–16). To build an understanding of the genetic complex-
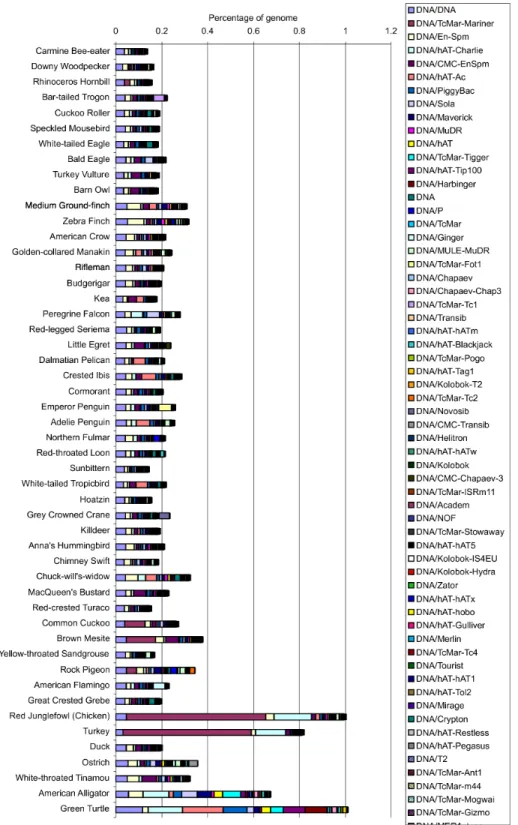
ity of birds and to investigate links between their genomic variation and phenotypic diversity, we collected and compared genome sequences of these and other avian species (48 species total), representing all 32 neognath and two of the five palaeognath orders (Fig. 1) (17), thus representing nearly all of the major clades of living birds (5).
Results
Sequencing, assembly, and annotation We used a whole-genome shotgun strategy to generate genome sequences of 45 new avian species (18), including two species representing two orders within the infraclass Paleognathae [common ostrich (Struthio camelus) and white- throated tinamou (Tinamus guttatus)], the other order within Galloanserae [Peking duck (Anas platyrhynchos)], and 41 species representing 30 neoavian orders (table S1) (19). In combination with the three previously published avian ge- nomes (11–13), the genome assemblies cover 92%
(34 of 37) of all avian orders (the three missing orders belong to the Paleognathae) (17). With the exception of the budgerigar (Melopsittacus undulatus), which was assembled through a multiplatform (Illumina/GS-FLX/PacBio) approach (20), all other new genomes were sequenced and assembled with Illumina (San Diego, CA) short reads (Fig. 1) (18). For 20 species, we pro- duced high (>50×) coverage sequences from multiple libraries, with a gradient of insert sizes and built full-genome assemblies. For the re- maining 25 species, we generated low (~30×) coverage data from two insert-size libraries and built less complete but still sufficient assem- blies for comparative genome analyses. These de novo (18) genome assemblies ranged from 1.05 to 1.26 Gb, which is consistent with estimated cytology-based genome sizes (21), suggesting near complete genome coverage for all species. Scaf- fold N50 sizes for high-coverage genomes ranged from 1.2 to 6.9 Mb, whereas those for lower- coverage genomes were ~48 kb on average (table S2). The genomes of the ostrich and budgerigar were further assembled with optical maps, in- creasing their scaffold N50 sizes to 17.7 and 13.8 Mb, respectively (20,22).
We annotated the protein-coding sequences using a homology-based method for all genomes, aided by transcriptome sequencing for some spe- cies (18). To avoid systematic biases related to the use of different methods in annotations of pre- viously published avian genomes, we created a uniform reference gene set that included all genes from the chicken, zebra finch, and human (23). This database was used to predict protein gene models in all avian genomes and American alligator (Alligator mississippiensis) (24). All high-coverage genomes were predicted to con- tain ~15,000 to 16,000 transposable element-free protein-coding genes [table S3 and annotation files in (19)], similar to the chicken genome (~15,000).
Despite the fragmented nature of the low- coverage genomes leading to ~3000 genes like- ly missing or partially annotated, it was still possible to predict 70 to 80% of the entire catalog of avian genes.
SCIENCE sciencemag.org 12 DECEMBER 2014•VOL 346 ISSUE 6215 1311
on December 11, 2014www.sciencemag.orgDownloaded from on December 11, 2014www.sciencemag.orgDownloaded from on December 11, 2014www.sciencemag.orgDownloaded from on December 11, 2014www.sciencemag.orgDownloaded from on December 11, 2014www.sciencemag.orgDownloaded from on December 11, 2014www.sciencemag.orgDownloaded from on December 11, 2014www.sciencemag.orgDownloaded from on December 11, 2014www.sciencemag.orgDownloaded from on December 11, 2014www.sciencemag.orgDownloaded from on December 11, 2014www.sciencemag.orgDownloaded from
Broad patterns of avian genome evolution Although many fishes and some amphibians have smaller genomes than birds, among amniotes, birds have the smallest (21). The genomes of mammals and nonavian reptiles typically range from 1.0 to 8.2 Gb, whereas avian genomes range from 0.91 in the black-chinned hummingbird (Archilochus alexanderi) to a little over 1.3 Gb in the common ostrich (21). A number of hypothe- ses have been proposed for the smaller avian ge- nome size (25–28). Here, we document key events that have likely contributed to this smaller ge- nome size.
The proliferation and loss of transposable ele- ments (TEs) may drive vertebrate genome size evolution (29–31). Consistent with the zebra finch and galliformes genomes (11–13,32), almost all avian genomes contained lower levels of repeat elements (~4 to 10% of each genome) (table S4) than in other tetrapod vertebrates (for example, 34 to 52% in mammals) (33). The sole outlier was the downy woodpecker (Picoides pubescens), with TEs representing ~22% of the genome, derived mainly from species-specific expansion of LINE (long interspersed elements) type CR1 (chicken repeat 1) transposons (fig. S1). In contrast, the average total length of SINEs (short interspersed elements) in birds has been reduced to ~1.3 Mb, which is ~10 to 27 times less than in other reptiles [12.6 Mb in alligator; 34.9 Mb in green sea turtle (Chelonia mydas)], suggesting that a deficiency of SINEs occurred in the common ancestor of birds.
We compared the average size of genomic ele- ments of birds with 24 mammalian and the three
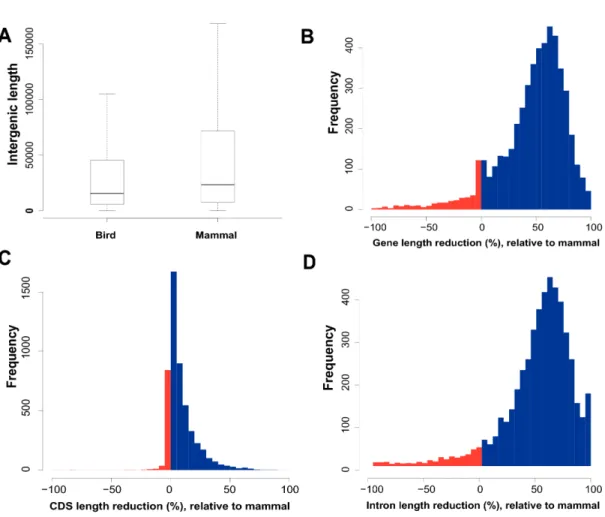
nonavian reptile genomes. Avian protein-coding genes were on average 50 and 27% shorter than the mammalian and reptilian genes, respectively (Fig. 2A). This reduction is largely due to the short- ening of introns and reduced intergenic distances that resulted in an increased gene density (Fig. 2A).
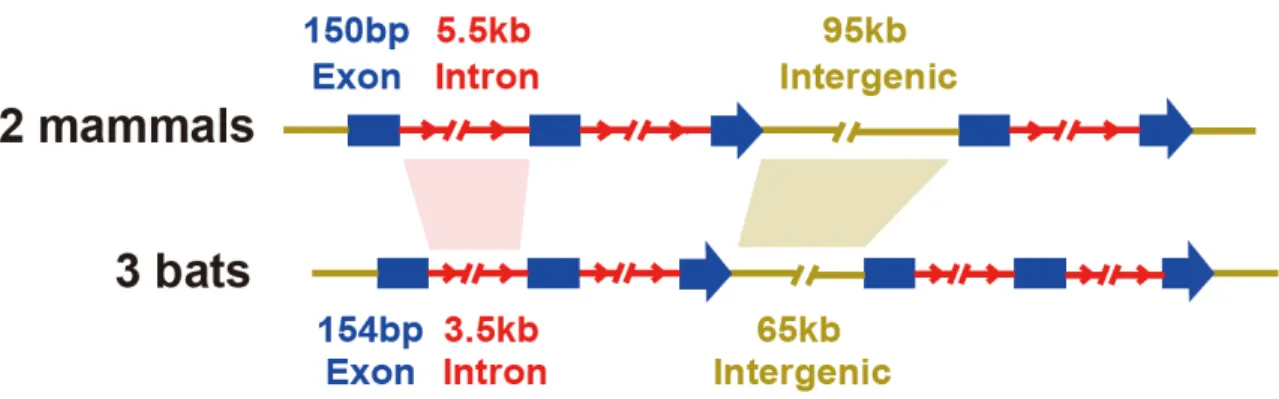
Such genomic contraction has also evolved conver- gently in bats (fig. S11), the only flying mammalian group. The condensed genomes may represent an adaptation tied to rapid gene regulation required during powered flight (34,35).
To further investigate whether avian genome size reduction is due to a lineage-specific reduction in the common avian ancestor of birds or expan- sion in other vertebrates (36), we performed an- cestral state reconstructions of small [<100 base pairs (bp)] deletion events across an alignment of four representative well-assembled avian and three reptile genomes (18) and found that the avian ancestral lineage experienced the largest num- ber of small deletion events—about twice the number in the common ancestor of birds and cro- codiles (fig. S12). In contrast, many fewer small deletion events occurred in modern avian lineages (fig. S12).
We next created a gene synteny map between the highest-quality assembled avian genome (ostrich) and other reptile genomes to docu- ment lineage-specific events of large segmental deletions (18). We detected 118 syntenic blocks, spanning a total of 58 Mb, that are present in alligator and turtle genomes but lost in all birds (table S8). In contrast, ~8x and ~5x fewer syn- tentic blocks were missing in alligator (14 blocks, 9 Mb) and turtle (27 blocks, 8 Mb) relative to green
anole, respectively, confirming the polarity of ge- nome size reduction in birds (table S8). The large segmental losses in birds were skewed to losses from chr2 and chr6 of the green anole (fig. S13).
Two of the green anole’s 12 pairs of microchro- mosomes, LGd and LGf, were completely missing in birds, with no homologous genes found within the avian genomes. Most of these lost segments were located at the ends of chromosomes or close to the centrosomes (fig. S13). Furthermore, lost seg- ments were enriched at apparent breakpoints of the avian microchromosomes (Fig. 2B and fig.
S13). These findings imply that the large segmen - tal losses may be a consequence of chromosomal fragmentation events in the common ancestor of birds giving rise to additional microchromosomes in modern birds.
The large segmental deletions in birds con- tain at least 1241 functional protein-coding genes (table S9), with each lost segment containing at least five contiguous genes. The largest region lost in birds was a 2.1-Mb segment of the green anole chr2, which contains 28 protein-coding genes (Fig. 2B). Overall, at least 7% of the green anole macrochromosomal genes were lost through segmental deletions in birds. Although gene loss is a common evolutionary process, this massive level of segmental deletion has not been previ- ously observed in vertebrates. Over 77% of the 1241 genes present in the large segmentally de- leted regions have at least one additional paralog in the green anole genome, a level higher than the overall percentage of genes with paralogs in the green anole genome or avian genomes (both at ~70%). This suggests that birds may
1312 12 DECEMBER 2014•VOL 346 ISSUE 6215 sciencemag.org SCIENCE
1China National GeneBank, Beijing Genomics Institute (BGI)–Shenzhen, Shenzhen, 518083, China.2Centre for Social Evolution, Department of Biology, Universitetsparken 15, University of Copenhagen, DK-2100 Copenhagen, Denmark.3Centre for GeoGenetics, Natural History Museum of Denmark, University of Copenhagen, Øster Voldgade 5-7, 1350 Copenhagen, Denmark.4Royal Veterinary College, University of London, London, UK.5Interdisciplinary Program in Bioinformatics, Seoul National University, Seoul 151-742, Republic of Korea.6Cho and Kim Genomics, Seoul National University Research Park, Seoul 151-919, Republic of Korea.7School of Biological Sciences, University of Nebraska, Lincoln, NE 68588, USA.8Centro de Investigación en Ciencias del Mar y Limnología (CIMAR)/Centro Interdisciplinar de Investigação Marinha e Ambiental (CIIMAR), Universidade do Porto, Rua dos Bragas, 177, 4050-123 Porto, Portugal.9Departamento de Biologia, Faculdade de Ciências, Universidade do Porto, Rua do Campo Alegre, 4169-007 Porto, Portugal.10Department of Biological Sciences, University of South Carolina, Columbia, SC, USA.11Department of Biology and Molecular Biology, Montclair State University, Montclair, NJ 07043, USA.12Department of Animal Ecology, Uppsala University, Norbyvägen 18D, S-752 36 Uppsala, Sweden.13Marie Bashir Institute for Infectious Diseases and Biosecurity, Charles Perkins Centre, School of Biological Sciences and Sydney Medical School, The University of Sydney, Sydney, NSW 2006, Australia.14Program in Emerging Infectious Diseases, Duke-NUS Graduate Medical School, Singapore 169857, Singapore.15Department of Integrative Biology University of California, Berkeley, CA 94720, USA.16College of Life Sciences, Wuhan University, Wuhan 430072, China.17School of Bioscience and Bioengineering, South China University of Technology, Guangzhou 510006, China.18BGI Education Center,University of Chinese Academy of Sciences, Shenzhen, 518083, China.19Key Laboratory of Animal Models and Human Disease Mechanisms of Chinese Academy of Sciences and Yunnan Province, Kunming Institute of Zoology, Kunming, Yunnan 650223, China.20Department of Neurobiology, Howard Hughes Medical Institute, Duke University Medical Center, Durham, NC 27710, USA.21Institute of Biological, Environmental and Rural Sciences, Aberystwyth University, Aberystwyth, UK.22School of Biosciences, University of Kent, Canterbury CT2 7NJ, UK.23Instituto de Ciências Biomédicas Abel Salazar (ICBAS), Universidade do Porto, Portugal.
24Department of Biology, University of California Riverside, Riverside, CA 92521, USA.25Department of Biochemistry, Molecular Biology, Entomology and Plant Pathology, Mississippi State University, Mississippi State, MS 39762, USA.26Institute for Genomics, Biocomputing and Biotechnology, Mississippi State University, Mississippi State, MS 39762, USA.27Instituto de Ciencias Ambientales y Evolutivas, Facultad de Ciencias, Universidad Austral de Chile, Valdivia, Chile.28Department of Anatomy, Physiology and Biochemistry, Swedish University of Agricultural Sciences, Post Office Box 7011, S-750 07, Uppsala, Sweden.29Department of Agricultural Biotechnology and Research Institute for Agriculture and Life Sciences, Seoul National University, Seoul 151-742, Republic of Korea.30State Key Laboratory for Agrobiotechnology, China Agricultural University, Beijing 100094, China.31College of Animal Science and Technology, China Agricultural University, Beijing 100094, China.32Organisms and Environment Division, Cardiff School of Biosciences, Cardiff University, Cardiff CF10 3AX, Wales, UK.33Key Lab of Animal Ecology and Conservation Biology, Institute of Zoology, Chinese Academy of Sciences, Beijing 100101 China.34International Wildlife Consultants, Carmarthen SA33 5YL, Wales, UK.35Centre for Zoo and Wild Animal Health, Copenhagen Zoo, Roskildevej 38, DK-2000 Frederiksberg, Denmark.36Department of Ecology and Evolutionary Biology, Tulane University, New Orleans, LA, USA.37Museum of Natural Science, Louisiana State University, Baton Rouge, LA 70803, USA.38The Genome Institute at Washington University, St. Louis, MO 63108, USA.39College of Medicine and Forensics, Xi’an Jiaotong University, Xi’an, 710061, China.40Department of Biomolecular Engineering, University of California, Santa Cruz, CA 95064, USA.41Theodosius Dobzhansky Center for Genome Bioinformatics, St. Petersburg State University, St. Petersburg, Russia.42Nova Southeastern University Oceanographic Center 8000 N Ocean Drive, Dania, FL 33004, USA.43Smithsonian Conservation Biology Institute, National Zoological Park, 1500 Remount Road, Front Royal, VA 22630, USA.44Genetics Division, San Diego Zoo Institute for Conservation Research, 15600 San Pasqual Valley Road, Escondido, CA 92027, USA.45Department of Vertebrate Zoology, MRC-116, National Museum of Natural History, Smithsonian Institution, Post Office Box 37012, Washington, DC 20013-7012, USA.46Center for Macroecology, Evolution and Climate, the Natural History Museum of Denmark, University of Copenhagen, Universitetsparken 15, DK-2100 Copenhagen O, Denmark.47Key Laboratory of Zoological Systematics and Evolution, Institute of Zoology, Chinese Academy of Sciences, 1 Beichen West Road, Chaoyang District, Beijing 100101, China.48Swedish Species Information Centre, Swedish University of Agricultural Sciences, Box 7007, SE-750 07 Uppsala, Sweden.49Department of Biochemistry &
Biophysics, University of California, San Francisco, CA 94158, USA.50Department of Organismic and Evolutionary Biology and Museum of Comparative Zoology, Harvard University, 26 Oxford Street, Cambridge, MA 02138, USA.51Department of Biology and Genetics Institute, University of Florida, Gainesville, FL 32611, USA.52Imperial College London, Grand Challenges in Ecosystems and the Environment Initiative, Silwood Park Campus, Ascot, Berkshire SL5 7PY, UK.53Division of Genetics and Genomics, The Roslin Institute and Royal (Dick) School of Veterinary Studies, The Roslin Institute Building, University of Edinburgh, Easter Bush Campus, Midlothian EH25 9RG, UK.54Department of Biology, New Mexico State University, Box 30001 MSC 3AF, Las Cruces, NM 88003, USA.55Macau University of Science and Technology, Avenida Wai long, Taipa, Macau 999078, China.56Trace and Environmental DNA Laboratory, Department of Environment and Agriculture, Curtin University, Perth, Western Australia, 6102, Australia.57Department of Biology, University of Copenhagen, Ole Maaløes Vej 5, 2200 Copenhagen, Denmark.58Princess Al Jawhara Center of Excellence in the Research of Hereditary Disorders, King Abdulaziz University, Jeddah 21589, Saudi Arabia.59Department of Medicine, University of Hong Kong, Hong Kong.
*These authors contributed equally to this work.†Corresponding author. E-mail: [email protected] (G.Z.); [email protected] (E.D.J.); [email protected] (M.T.P.G.); [email protected] (J.W.)
‡Present address: Department of Biological Sciences, Texas Tech University, Lubbock, TX 79409, USA. §Avian Genome Consortium authors and affiliations are listed at the end of this paper.
A F L O C K O F G E N O M E S
have undergone functional compensation in their paralogous gene copies, reducing selection against the loss of these segmental regions. We predict that the loss of functions associated with many genes in the avian ancestor may have had a profound influence on avian-specific traits (table S11).
Conservative mode of genome evolution With ~2/3 of avian species possessing ~30 pairs of microchromosomes, the avian karyotype ap- pears to be distinctly conserved because this phenotype is not a general feature of any other vertebrate group studied to date (37). We as- sessed the rates of avian chromosomal evolution among the 21 more fully assembled genomes (scaffold N50 > 1 Mb) (table S2) (18). From the
alignment of chicken with the other 20 avian genomes, plus green anole andBoa constrictor(38), we identified homologous synteny blocks (HSBs) and 1746 evolutionary breakpoint regions (EBRs) in different avian lineages and then estimated the expected number of EBRs (18) and the rates of genomic rearrangements, using a phylogenetic total evidence nucleotide tree (TENT) as a guide (5). We excluded the turkey genome after de- tecting an unusually high fraction of small lineage- specific rearrangements, suggesting a high number of local misassemblies. Of the 18 remaining non– Sanger-sequenced genomes (table S2), the esti- mated rate of chimeric scaffolds that could lead to false EBRs was ~6% (39).
The average rate of rearrangements in birds is
~1.25 EBRs per million years; however, bursts of
genomic reorganization occurred in several avian lineages (fig. S15). For example, the origin of Neog- nathae was accompanied by an elevated rate of chromosome rearrangements (~2.87 EBRs per million years). Intriguingly, all vocal learning spe- cies [zebra finch, medium-ground finch (Geospiza fortis), American crow (Corvus brachyrhynchos), budgerigar, and Anna’s hummingbird (Calypte anna)] had significantly higher rates of rearrange- ments than those of close vocal nonlearning rela- tives [golden-collared manakin (Manacus vitellinus), peregrine falcon (Falco peregrinus) and chimney swift (Chaetura pelagica)] [phylogenetic analysis of varianceFstatistic (F) = 5.78,P= 0.0499] and even higher relative to all vocal nonlearning species (F= 15.03,P= 0.004). This may be related to the larger radiations these clades experienced relative to most other bird groups. However, the golden-collared manakin, which belongs to suboscines (vocal non- learners) that have undergone a larger radiation than parrots and hummingbirds, has a low rear- rangement rate.
We next compared microsynteny (local gene arrangements), which is more robust and ac- curate than macrosynteny analyses for draft assemblies (18). We compared with eutherian mammals, which are approximately the same evolutionary age as Neoaves and whose genome assemblies are of similar quality. We examined the fraction of orthologous genes identified from each pair of two-avian/mammalian genomes, on the basis of syntenic and best reciprocal blast matches (18). Birds have a significantly higher percentage of synteny-defined orthologous genes than that of mammals (Fig. 2C). The fraction of genes retained in syntenic blocks in any pairwise comparison was linearly related with evolution- ary time, by which the overall level of genome shuffling in birds was lower than in mam- mals over the past ~100 million years (Fig.
2C). This suggests a higher level of constraint on maintaining gene synteny in birds relative to mammals.
The apparent stasis in avian chromosome evo- lution suggests that birds may have experienced relatively low rates of gene gain and loss in mul- tigene families. We examined the intensively studied gene families that encode the various a- andb-type subunits of hemoglobin, the tetra- meric protein responsible for blood oxygen trans- port in jawed vertebrates (40). In amniotes, the a- andb-globin gene families are located on dif- ferent chromosomes (40) and experienced high rates of gene turnover because of lineage-specific duplication and deletion events (41). In birds, the size and membership composition of the globin gene families have remained remark- ably constant during ~100 million years of evo- lution, with most examined species retaining an identical complement (Fig. 2D). Estimated gene turnover rates (l) ofa- andb-globin gene fam- ilies were over twofold higher in mammals than birds (l = 0.0023 versus 0.0011, respectively).
Much of the variation in the aviana-globin gene family was attributable to multiple indepen- dent inactivations of theaD-globin gene (Fig.
2D), which encodes thea-chain subunit of a
SCIENCE sciencemag.org 12 DECEMBER 2014•VOL 346 ISSUE 6215 1313
Downy Woodpecker Carmine Bee-eater Rhinoceros Hornbill Bar-tailed Trogon Cuckoo Roller Speckled Mousebird Barn Owl
Turkey Vulture White-tailed Eagle Bald Eagle
Red-legged Seriema Peregrine Falcon Budgerigar Kea Rifleman
Golden-collared Manakin American Crow
Zebra Finch
Medium Ground-finch White-tailed Tropicbird Sunbittern
Red-throated Loon Emperor Penguin Adelie Penguin Northern Fulmar Great Cormorant Crested Ibis Little Egret Dalmatian Pelican Hoatzin
Grey-crowned Crane Killdeer
Red-crested Turaco MacQueen's Bustard Common Cuckoo Chuck-will’s-widow Anna’s Hummingbird Chimney Swift American Flamingo Great-crested Grebe Pigeon
Yellow-throated Sandgrouse Brown Mesite
Peking Duck Turkey Chicken
White-throated Tinamou Common Ostrich High-coverage
Low-coverage Sanger sequenced
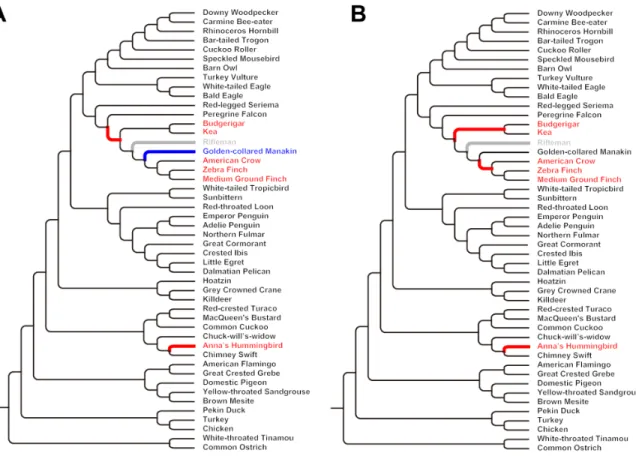
Fig. 1. Avian family tree and genomes sequenced.The phylogenomic relationships of the 48 avian genomes from (5), with Sanger-sequenced (black), high-coverage (dark red), and low-coverage (light red) genomes denoted.
1314 12 DECEMBER 2014•VOL 346 ISSUE 6215 sciencemag.org SCIENCE
Divergence Time (Mya)
0 50 100 150 200
75 11 19 21 0.43
0 0 0 0
Z 18 13 12 16
Location in Chicken chr (Mb)
Location in Lizard chr2 (Mb)
0
Lizard Turtle Alligator Birds
50
identity pseudo
0 100
144bp2.1kb 49kb
151bp4.3kb 91kb Exon Intron Intergenic Birds
Mammals
146bp3.1kb 61kb Reptiles
3.1k 61kb
Syntenic percentage (%)
50 60 70 80 90
25 50 75 100
50 60 70 80
Birds Mammals
Mammalian Hb clusters
α β
Avian Hb clusters
-globin -globin β-globin α-globin
~ 115 Ma
~100 Ma Hba-π Hba-αD Hba-α
Hbb-ρ Hbb-β Hbb-β Hbb-ε A
H A
Pseudogene
Hbb-η
Hbb-γ Hbb-δ Hbb-β Hba-ζ Hba-α Hba-α Hba-θ Hbb-ε
D A
White-throated Tinamou Common Ostrich Turkey Chicken Peking Duck Pigeon Chimney Swift Anna’s Hummingbird Hoatzin
Common Cuckoo Crested Ibis Little Egret Adelie Penguin Emperor Penguin Killdeer
Downy Woodpecker Bald Eagle Peregrine Falcon Zebra Finch
Golden-collared Manakin Medium Ground-finch American Crow
Human Owl Monkey Mouse Lemur Mouse Rat Guinea Pig Rabbit
Cow
Dog Horse
Armadillo Elephant Tenrec Shrew Pygmy Hedgehog Cat Flying Fox Little Brown Bat Dolphin Pika Tree Shrew
Hyrax
Fig. 2. Genome reduction and conservation in birds.(A) Comparison of average size of introns, exons, and intergenic regions within avian, reptilian, and mammalian genomes. (B) Synteny plot and large segmental deletions between green anole chromosome 2 and multiple chicken chromosomes.
Colored bars and lines indicate homologous blocks between two species;
black bars indicate location of large avian-specific segmental deletions, which are enriched at the breakpoints of interchromosome rearrangements. (Bottom) An example of a large segmental deletion in birds (represented by ostrich genes). Homologous genes annotated in each species are shown in small boxes. The color spectrum represents the percent identity of homologous genes with the green anole. (C) Distribution of gene synteny percentages identified for phylogenetically independent species pairs of various divergence ages. Dots indicate the percentage of genes remaining in a syntenic block in
pairwise comparisons between two avian or mammalian species. Box plots indicate that the overall distributions of the synteny percentages in birds and mammals are different (Pvalue was calculated by using Wilcoxon rank sum test with phylogenetically independent species pairs). (D) Chromosomal or- ganization of thea- andb-globin gene clusters in representative avian and mammalian taxa. These genes encode thea- andb-type subunits of tetra- meric (a2b2) hemoglobin isoforms that are expressed at different ontoge- netic stages. In the case of thea-like globin genes, birds and mammals share orthologous copies of theaD- andaA-globin genes. Likewise, the avianp- globin and the mammalianz-globin genes are 1:1 orthologs. In contrast, the genes in the avian and mammalianb-globin gene clusters are derived from independent duplications of one or moreb-like globin genes that were in- herited from the common ancestor of tetrapod vertebrates (90,91).
A F L O C K O F G E N O M E S
hemoglobin isoform (HbD) expressed in both embryonic and definitive erythrocytes (42). Be- cause of uniform and consistent differences in oxygen-binding properties between HbD and the major adult-expressed hemoglobin isoform, HbA (which incorporates products ofaA-globin) (42), the inactivations ofaD-globin likely contrib- ute to variation in blood-oxygen affinity, which has important consequences for circulatory oxygen transport and aerobic energy metabo- lism. Overall, the globin gene families illustrate a general pattern of evolutionary stasis in birds relative to mammals.
Genomic nucleotide substitution rates vary across species and are determined through both neutral and adaptive evolutionary processes (43). We found that the overall pan-genomic back- ground substitution rate in birds (~1.9 × 10⁻³ substitutions per site per million years) was lower than in mammals (~2.7 × 10⁻³substitution per site per million years) (Fig. 3A). However, the substitution rate estimates also exhibited inter- ordinal variation among birds (Fig. 3A). There
was a positive correlation between the substi- tution rate and the number of species per order [coefficient of determination (R2) = 0.21,P= 0.01, Pearson’s test with phylogenetically indepen- dent contrasts] (Fig. 3B and fig. S19), evidenc- ing an association with rates of macroevolution (44). For example, Passeriformes, the most di- verse avian order, exhibited the highest evolu- tionary rate (~3.3 × 10⁻³substitutions per site per million years), almost two times the average of Neoaves (~2 × 10⁻³substitutions per site per million years, Fig. 3A). Landbirds exhibited an average higher substitution rate than that of waterbirds (landbirds, ~2.2 × 10⁻³substitutions per site per million years; waterbirds, ~1.6 × 10⁻³ substitutions per site per million years), which is consistent with the observation that landbirds have greater net diversification rates than those of waterbirds (7). Among the landbirds, the pre- datory lineages exhibited slower rates of evolu- tion (~1.6 × 10⁻³substitutions per site per million years), similar to that of waterbirds. Moreover, the three vocal learning landbird lineages (parrots,
songbirds, and hummingbirds) are evolving faster than are nonvocal learners (Fig. 3A). Overall, our analyses indicate that genome-wide variation in rates of substitution is a consequence of the avian radiation into a wide range of niches and associated phenotypic changes.
Selective constraints on functional elements
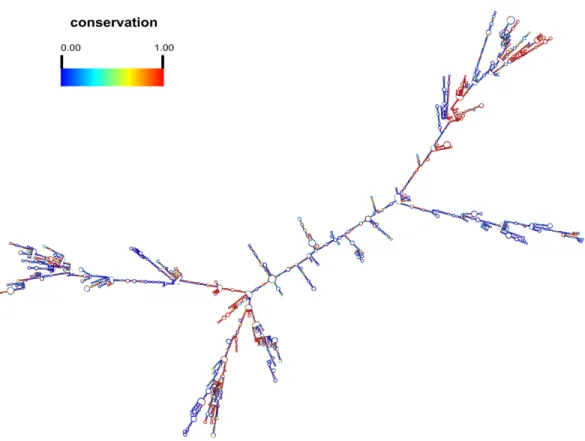
Conservation of DNA sequences across distant- ly related species reflects functional constraints (45). A direct comparison of 100-Mb orthologous genomic regions revealed more regions evolving slower than the neutral rate among birds (Fig.
3C) than mammals (46), which is consistent with the slower rate of avian mitochondrial sequence evolution (47). We predicted 3.2 million highly conserved elements (HCEs) at a resolution of 10 bp or greater spanning on average 7.5% of the avian genome, suggesting a strong functional constraint in avian genomes. Functional anno- tations revealed that ~12.6% of these HCEs were associated with protein-coding genes, whereas
SCIENCE sciencemag.org 12 DECEMBER 2014•VOL 346 ISSUE 6215 1315
Mammal cons.
Bird cons.
Bird HCEs Mammal HCEs
Mammal cons.
Bird cons.
Gene MID1
TFBS
Substitution rate
0 0.2 0.4 0.6 0.8 1.0 0
0.2 0.4 0.6 0.8 1.0
Bird phastCons score
Mammal phastCons score
Low High
0.01%
1.57%
9.2%
3.79% 8.41%
48.29%
21.97%
3.39%
3.35%
0.01%
Exon Intron
Intergenic ncRNA 2k flanking
Avian specific HCEs
HCEs shared by birds and mammals Mammals
Birds
PalaeognathaeGalloanserae Neoaves
PasseriformesWater BirdsLand Birds Birds of Prey
Vocal Learners
Density
A
B
D C
E
Chr1
128300kb 128330kb 128360kb 128390kb 128420kb 128440kb
CAGATCGTAGGCTAG
0 1 0 1
HOXA5
Pdx1
0 1
SOX10
GATA2 NFIC IRF1 Prrx2ETS1
CGAAAGGT
0 1 0
1 0 1 0.0010
0.0015 0.0020 0.0025 0.0030 0.0035 0.0040
•
•
•
•
•
•
•
•
• •
•
•
•
•
•
•
•
•
•
•
•
•
•
•
• •
•
•
• •
Accipitriformes
Anseriformes
Apodiformes
Caprimulgiformes
Cariamiformes Charadriiformes
Coliiformes Columbiformes
Coraciiformes Cuculiformes
Falconiformes
Galliformes
Gaviiformes Gruiformes
Musophagiformes
Opisthocomiformes Pelecaniformes
Phaethontiformes Phoenicopteriformes
Podicipediformes Procellariformes
Psittaciformes
Pteroclidiformes Sphenisciformes
Strigiformes
Struthioniformes
Tinamiformes Trogoniformes
0 10 100 1k 10k
0.0010 0.0015 0.0020 0.0025 0.0030 Substitution rate
Number of Species
Passeriformes
40 50 60 70 80 90 Piciformes
(mya)
Fig. 3. Evolutionary rate and selection constraints.(A) Substitution rate in each lineage was estimated by the comparison of fourfold degenerate (4d) sites in coding regions, in units of substitutions per site per million years.
Waterbirds and landbirds are defined in (5). (B) Correlation between average substitution rates and number of species within different avian orders.
Divergence times were estimates from (5). The fit line was derived from least square regression analysis, and the confidence interval was estimated by
“stat_smooth”in R. The units of thexaxis are numbers of substitutions per site per million years. The correlation figure with phylogenetically indepen-
dent contrasts is provided in the supplementary materials. (C) Density map for comparison of conservation levels between pan-avian and pan-mammalian genomes, on the basis of the homologous genomic regions between birds and mammals. Conservation levels were quantified by means of PhastCons basewise conservation scores. (D) HCEs found in both mammalian and avian genomes (smaller pie piece) and those that are avian-specific (larger pie piece). (E) MID1 contains abundant avian-specific HCEs in the upstream and downstream regulatory regions. Many regulatory motif elements are identified in these avian-specific HCEs. Cons., conservation level.
the majority of the remaining HCEs were located in intron and intergenic regions (Fig. 3, D and E).
These HCEs enabled us to identify 717 new protein- coding exons and 137 new protein-coding genes, with 77% of the latter supported by the deep transcriptome data (table S17). Deep transcrip- tome sequencing also enabled us to annotate 5879 candidate long noncoding RNA (lncRNA) genes, of which 220 overlapped HCEs with a coverage ratio of >50% (table S18) (18).
Because HCEs may have different functions in different lineages, we separated the HCEs into two categories: bird-specific and amniote HCEs (shared by birds and mammals). Among the bird- specific HCEs, we identified 13 protein-coding genes that were highly conserved in birds but divergent in mammals (table S19). One of the most conserved was the sperm adhesion gene,SPAM1, which mediates sperm binding to the egg coat (48).
This gene, however, was under positive selection driven by sperm competition in mammalian species (49). Noncoding HCEs play important roles in the regulation of gene expression (50); thus, we com- pared the transcription factor binding sites in the ENCODE project (51) with the HCEs and found that the avian-specific HCEs are significantly associated with transcription factors functioning in metabolism (table S20), whereas amniote core HCEs are enriched with transcription factors functioning in signal regulation, stimulus re- sponses, and development (table S21).
To investigate evolutionary constraints on gene regions, we calculated dN/dS [the ratio of the number of nonsynonymous substitutions per non- synonymous site (dN) to the number of synony- mous substitutions per synonymous site (dS)]
for 8295 high-quality orthologs. Consistent with the fast-Z sex chromosome hypothesis (52), the evolutionary rate of Z-linked genes was signif- icantly higher than autosome genes (Fig. 4A).
This is most likely driven by the reduction of ef- fective population size (Ne) of Z-linked genes— because the Neof Z chromosome is only 3/4 of that of autosomes—as well as by male sexual selection (52). Furthermore, consistent with the fast-macro hypothesis, the overall rate of macro-
chromosomal genic evolution is higher than that of microchromosomes (Fig. 4A), which is prob- ably due to differences in the recombination rates and genic densities between macro- and micro- chromosomes in birds (53).
We also examined the dN/dSratio of each avian Gene Ontology (GO) category for com- parison with mammals and within birds. Those involved in development (such as spinal cord development and bone resorption) are evolving faster in birds, and those involved in the brain function (such as synapse assembly, synaptic vesicle transport, and neural crest cell migration) are evolving faster in mammals (tables S23 and S24). Genes involved in oxidoreductase activity were relatively rapidly evolving in the Palaeog- nathae clade that contains the flightless ratites (Fig. 4B and table S25). The fast evolving GOs in the Galloanserae participate in regulatory func- tions (Fig. 4B and table S26). In Neoaves, genes
involved in microtubule-based processes were the fastest evolving (Fig. 4B and table S27). We speculate that these differences could be caused by relaxed selective constraints or positive selec- tion in different lineages.
Genotype-phenotype convergent associations: Evolution of vocal learning With the availability of genomes representing all major modern avian lineages and their revised phylogenetic relationships (5), it becomes possible to conduct genome-wide association studies across species with convergent traits. We focused on vocal learning, which given our phylogenetic analyses is inferred as having evolved independently, either twice, in hummingbirds and the common ancestor of songbirds and parrots, or three times (5,54). All three groups have specialized song-learning forebrain circuits (song nuclei) not found in vocal nonlearners (Fig. 5A) (55).
1316 12 DECEMBER 2014•VOL 346 ISSUE 6215 sciencemag.org SCIENCE
0.0 0.1 0.2 0.3 0.4 0.5 0.6 0.7
p < 2.2e-16 p < 2.2e-16
Macro Micro Z
dN/dS
oxidation−reduction process positive regulation of locomotion positive regulation of signaling primary metabolic process regulation of localization regulation of metabolic process cellular component biogenesis cell cycle regulation of response to stimulus regulation of cellular component biogenesis mating regulation of cellular component organization regulation of signaling regulation of cellular process regulation of biological process establishment of localization transmembrane transport chromosome segregation maintenance of location cell cycle process microtubule−based process
0 200
p-value 0 10-510-10
Neoaves
Galloanserae
Palaeognathae
#gene Fig. 4. Selection constraints on
genes.(A) Box plot for the distribution of dN/dSvalues of genes on avian macrochromosomes, microchromosomes, and the Z chromosome.
Pvalues were calculated with Wilcoxon rank sum tests. (B) GO categories in Neoaves, Galloanserae, and Palaeognathae showing clade-specific rapid evolutionary rates. Red bars,Pvalue of significance; blue bars, number of genes in each GO.
DM
Av
NIf
Hindbrain XII
DLM
Cerebellum
Cerebrum
Thalamus
Midbrain trachea & syrinx
muscles
HVC
RA
Area X LMAN
26 4 2
1 1
7
20 10
10 3
2 Song nucleus with DEGs
LMO
Exon Intron Intergenic 5’ 10k 3’ 10k 5.17%
27.7%
48.5%
9.06%
9.58%
Multiple sequence alignment
1.85%
22.6%
54.2%
11.3%
10.0%
Vocal learner accelerated element Fig. 5. Convergent molecular changes among vocal learning birds. (A) Songbird brain diagram showing the specialized forebrain song-learning nuclei (yellow) that controls the production (HVC and RA) and acquisition (LMAN and Area X) of learned song (55).
Gray arrows indicate connections between brain regions; red and blue (thick) arrows in- dicate relative numbers of genes with increased or decreased specialized expression in zebra finch song nuclei and with convergent accelerated coding sequences (left numbers of 66 total) or convergent amino acid substitutions (right numbers of 6). Genes expressed in more than one song nucleus are counted multiple times.
RA, robust nucleus of the arcopallium; LMAN, lateral magnocellular nucleus of the anterior nidopallium; Area X, Area X of the striatum; and HVC, a letter-based name. (B) Classification of vocal learner-specific accelerated elements, compared with the background alignment of 15 avian species.
A F L O C K O F G E N O M E S