FACTOR ANALYSIS FOR CORRUPTION PREVENTION IN CENTRAL JAVA
Provita Wijayanti 1
Dept. of Accounting, Faculty of Economics, UNISSULA, Semarang, Indonesia [email protected]
[email protected] Rustam Hanafi 2
Dept. of Accounting, Faculty of Economics, UNISSULA, Semarang, Indonesia [email protected]
Siti Sumiati 3
Dept. of Management, Faculty of Economics, UNISSULA, Semarang, Indonesia
Abstract
This research aims to analyze factors influencing corruption Prevention in Central Java. This study is an empirical study using convenience sampling for data collection. The data is acquired by performing survey to 150 government auditors in Audit Board of the Republic of Indonesia and Financial and Development Supervisory Agency in Central Java, Regional Supervisor Inspectorate Central Java, and Supervisor Inspectorate Semarang. The data analysis uses factor analysis to see the main factor influencing corruption Prevention in Central Java according to Government auditor in Central Java. The findings show that the main factor influencing the auditing quality in government audit for corruption Prevention such as: 1. The factor of supervisory infrastructure in Government Performance, 2. The factor of Management Control System of Government Audit Board, and 3. The factor of Government Personal Auditor.
Keywords: Supervisory Infrastructure, Management Control System, Personal Auditor, Corruption Prevention
BACKGROUND
Corruption is a problem for any country in the world as it endangers the governmental governance factor and governmental economic and impacts on poverty (Chetwynd et al, 2003). Data of Corruption in Indonesia can be seen from various sources, one of them is from Transparency International (TI), an anti-corruption community that releases Corruption Perception Index (CPI). Based on CPI 2015 released by transaparancy.org, Indonesia ranks 88 out of 168 countries with a score of 36. Indonesian score increases by 2 points from the previous year and then ranks 19. Transparency International Indonesia states that the increased rating indicates a progress in corruption Prevention in Indonesia, yet Indonesia is still included in Countries with most vulnerable to corruption, especially in law and politic enforcement sectors (Transparency International Indonesia, 2006 in Yuliyana and Setyaningrum, 2016).
The result of a survey conducted by the Political and Economic Risk Consultancy (PERC) states that by 2015 Indonesia is number 2 of the most corrupt countries with score 8.09 out of 16 investment destinations in Asia Pacific. The survey was conducted on 900 expatriate respondents in Asia. Perception is measured using scale 0 to 10. 0 (zero) is the best score and 10 (ten) is the worst score. This value is almost equal to the score of Indonesia in 2010, such as 9.07 and ranks as number 1 most corrupt country in Asia Pacific. The cause of fraud, according to KPMG Fraud, Bribery and Corruption Survey 2013 conducted in Australia and New Zealand in 2012 is the weak Internal control, the second factor is the exclusion of the existing internal control system and the factor of fraud detection is the existence of internal control (KPMG, 2013 in Nurhasanah , 2016). This is in line with the results of research conducted by Zang et al (2007) which states that an effective internal control reduces the tendency of fraud in an organization. Therefore, the existence and the implementation of internal control system are substantial to prevent/ reduce fraud.
In Indonesia, there are three factors that support the existence of Good Government Governance. The first aspect is government performance monitoring by the people and House of Representatives. Second, the aspect of controlling, that is the government mechanism to guarantee the achievement of organizational purposes. Third, the aspect of inspection, that is inspection or auditing by internal and external auditor (Mardiasmo, 2006). Every institution/
organization in Indonesia generally has had internal control system shown by monitoring conducted by internal audit in every organization. The role of government internal audit is substantial because it has duty to monitor the effectiveness of internal control system so it can
detect the risk of fraud and corruption ( Kongrungchok & Stanton, 2014; Baltaci & Yinmaz, 2006 in Nurhsanah, 2016).
Internal audit system has important role in evaluating and improving the effectiveness of internal control and governance process (Ricard, 2009; Chabrak & Daidj, 2007;
Srichunpech, 2005). To increase the vital role of internal audit in corruption Prevention, KPK (Corruption Eradication Commission) participates in optimizing internal auditor apparatus of ministry/ organization in order to be brave to report corruption. Since the establishment of KPK tp to October 2013, Directorate of Public Complain of KPK has only received 12 information from internal audit (KPK, 2013). There are two categories of head of Internal Audit in Indonesia, such as Inspector General Ichelon I and Inspectore Echelon I (Regulation No. 39, 2008), thus, KPK takes place in supporting the optimaztion of internal auditor apparatus of ministry/ organization through organizational structure equation in order to make internal auditor apparatus of ministry/ organization has more authority in reporting corruption.
Research about government audit organization structure and its effect on the consequence of economic and corruption is still scarce (Blume & Voight, 2011) so this study can contribute in internal audit organization structure in Indonesia and its consequence on corruption. Internal audit cannot be separated from internal auditor as internal regulatory apparatus roles to help the head of ministry/organization in monitoring the management of state budget in every ministry/organization. Every ministry/organization manage different state budget, some of them manage large state budget, while some of them manage small state budget. To monitor the management of public budget well, internal regulatory apparatus really depends on the amount. However, the needs of the emount of internal auditor has not been fulfilled (BPKP, 2014b), as it is proved from the existence of ministry/organization that have not implement the functional of auditor, for instance Consultative Assembly, the Attorney General, etc (BPKP, 2014a).
The previous research about the correlation of internal controllinh and corruption in companies listed in China Stock Exchange is the research of Ge, et al (2014). The independent variable in this research is internal control strength which is measured by calculating the score of discretionary accruals and the amount of restatements of financial statement, while the dependent variable is fraud/corruption measured by calculating the use of other depts among corporates, the travel and entertainment costs, and the disclosure of corruption to public by the management. The findings show that companies with strong internal control will spend small entertainment and travel costs, the higher the internal
control, the lower the corruption disclusure in companies which are not state-owned will be.
However, in state-owned companies the study of Ge, et al states that the stronger internal control, the higher the corruption disclosure will be. A study which discuss about internal audit and its correlation with failure in detecting fraud/corruption is the study of Kongrungchok & Stanton (2014). The study uses questionnaires sent to 120 internal auditors in Regional Government in North Thailand by focusing on systemic aspects on why internal audit is not effective in edtecting fraud. The findings show that 95,10% of internal audits in Regional Government in North Thailand are not supported by training peocess of risk assessment. Internal auditor also as few experience in auditing, while the result of interview states that there is incentive psychology of fraud, that is a pressure of promotion and remuneration prospects used as administrator pressure and overside bodies so their fault will not be seen.
Then, other research fron Indonesia is conducted by Dewi (2014) which acquire an evidence of tendention difference of conducting accounting fraud between individual with low moral reasoning level and high moral reasoning level, in a condition that there is internal control and there is no internal control. Population in this research is all head of sub department (Echelon Functionary IV) of regional government of Bali. The findings show that individual tendency to perform fraud in accounting is in a condition where there is no internal control. A research about the effect of organizational size on corruption is a controversial (Liu & Lin, 2012). There are studies which proves that the larger the organizational size, the higher the tendency of corruption will be (Liu & Lin, 2012; Ali & Isse, 2003) and the larger the organizational size the lower the tendency of corruption will be (Fisman & Gatti, 2002)..
Therefore, it is important to know the effect of organizational size on corruption cases, especially in Indonesia.
Up to present, researches about corruption in Indonesia use cross country data. There are a few studies use analysis unit of regional government. This study aims to give empirical evidence of the main factor contributing on corruption prevention according to government auditor in Central Java. Central Java is chosen as research sample as it has the most corruption case in 2014.
LITERATURE REVIEW Factors Leading to Corruption
Corruption is part of fraud. Risk of fraud adopted by SAS No. 99 is based on theory of risk factor of fraud by Cressey (1953). The theory of risk factor of fraud states that there are three situations why people do fraud, such as pressure, opportunity, and rationalization.
Pressure means that there is incentive/pressure/needs to do fraud. Pressure may cover almost all things, including lifestyle, economic demand, etc., including financial and non-financial.
Opportunity covers situation which opens chances enabled fraud to occur. The opportunity enabling fraud occurs because a week internal controlling, ineffective management monitoring, or authority abuse. Therefore, organization has to build effectiveness of internal controlling and provide fraud detection, so employees cannot do fraud. Rationalization covers attitude, character or a set of ethical values that enable certain parties to do fraud, or people in certain environment that gives pressure to rationalize fraud (AICPA, 2012). Corruption in public sector is a misuse of public funds for private purposes. It is often described as a condition that worsens poverty (low income, poor health and education). Corruption has a direct consequence on the factors of governance and economy that will finally lead to poverty (Chetwynd et al, 2003).
The model is also called as "governance model" in which factors of governance is related to corruption. Governance capacity negatively affects corruption. Corruption may reduce the capacity of governance which then affects the improvement of poverty.
The above studies are about corruption that threatens democracy and governance by weakening public participation and political institutions, and by inhibiting the growth of economy towards democracy (Johnston, 2000). Corruption affects the quality of government service and infrastructure of education and health sectors (Mauro, 2002; Gupta et al, 2000;
Gupta et al, 1998). Good governance (with control on corruption) is associated with poverty prevention (Kaufman & Kraay, 2002; World Bank, 2000). The causes of corruption are as follows: (a) The low accountability of an institution/state, (b) Low salary, (c) Robust of monopoly, (d) The strong level of discretion, (e) lack of transparency, (f) The power of people affected, (g) rambling regulation (Javaid, 2010).
Factors of Fraud Prevention
Prevention of Fraud in general is an activity implemented by the management in terms of establishing policies, systems and procedures that help to ensure that the necessary actions have been carried out by directors board, management and other personnel of
companies to be able to provide adequate confidence in three main objectives, such as: the reliability of financial statement, the effectiveness and efficiency of operations and compliance with laws and regulations (COSO, 1992 in Amrizal, 2004). Fraud prevention factors are as follows:
1. Build a good Internal Control Structure
COSO (The Committee of Sponsoring Organizations the Treadway Commission) in September 1992 in Amrizal (2004) introduces a broader framework of control than the accounting control which is traditional and include risk management such as internal control consisting of five (5) interrelated components as folows:
a. Control Environment sets the style of an organization, influencing the control consciousness of its people. Control environment is the foundation for all the components of internal control, provides discipline and structure. Control environment includes:
1. Integrity and Ethical Values 2. Commitment on competence
3. Participation of commissioners and auditing committee 4. The management of philosophy and operating style 5. Organizational structure
6. Assignment of authority and responsibility 7. Policies and practices of human resources
b. Risk assessment is entity identification and analysis of relevant risks to achieve its objectives, form a basis for determining how risks should be managed.
c. Standard control (Control Activities) is policy of procedure that helps to ensure that management direction is implemented.
d. Information and communication e. Monitoring
2. Streamline control activities including performance review, information processing, physical control and segregation of duties.
3. Improve organizational culture by implementing principles of Good Corporate Governance (GCG), such as the principle of Fairness, Transparency, Accountability, responsibility, Morality, reliability, and commitment (Saifuddin, 2000 in Amrizal 2000).
4. Streamline the internal audit function.
Another reference related to factors of corruption prevention by Kuntadi (2016) are summarized in the acronym of SiKENCUR that includes: 1) The strong and clean leadership
system, 2) Internalization of value and culture of anti-fraud, 3) Main framework of anti-fraud governance, 4) Effectiveness of policy and regulation enforcement, 5) Neutralization of fraud risk through prevention devices, 6) Early search and find cases of cheating, 7) Investigate quickly and thoroughly fraud, and 8) Routine to monitor, evaluate and report the effectiveness of SiKencur.
RESEARCH FRAMEWORK
According to Jansen & Glinow (1985) in Malone and Roberts (1996), an individual behavior is reflections of personality whereas situational factors that occur when it will encourage someone to make a decision. From that argument, it can be concluded that the audit dysfunctional behavior can be caused by personal characteristics of auditors (internal factors) as well as situational factors when performing an audit (external factors). This study will identify the characteristics of personal factor auditor and audit environmental factors from the standpoint of government auditor for corruption prevention. In a simple framework research framework can be described in Figure 1.
Figure 1. Factors that Influence Corruption Prevention RESEARCH DESIGN
Population and Sample
Population in this study is government auditor in Central Java. Selection of sample uses convenience sampling method. The data used in this study is primary data in a form of questionnaire responses from government auditors in Central Java related to corruption prevention factors. The number of obtained samples is 150 respondents from regulatory inspectorate Central Java, Regional Supervising Inspectorate Semarang, Board of Audit Agency Central Java and Financial and Development Supervisory Agency Central Java. The research data are tested using factor analysis to identify the main factors of corruption prevention in Central Java.
condition of existing location
Model of Corruption Prevention Identification of factors to prevent corruption:
1. Factor of Personal Auditor 2. Factor of Audit environment
Definition of Operational Variable
This study uses factor analysis which identifies important factors for corruption prevention in the perspective of government auditor in Central Java, such as:
1. Personal Auditor Factor, is a factor considered from auditor personality standpoint, for instance: Repair of auditor personal factor: Education, competence, independence, and professional and organizational commitments (Wijayanti and Rustam, 2015).
2. Audit Environment Factor, is a factor considered from audit environment standpoint, such as: improvement of the authority of government audit institutions and management control system of government audit institutions, improvement of synergy among government audit institutions, assistance in the preparation of LKPD (financial statement of local government), and the government internal monitoring Apparatus (APIP) that have not optimally played role as supervisor both in the implementation of financial management and in reviewing financial statement of local government (LKPD). Factor of legislation provisions that are not yet completed and are not likely long lasting triggers instability of the implementation of regional financial reformation. Factor of the low effectiveness of follow-up on the results of the examination of representative institution that have monitoring function and factors audit procedures are not fully implemented.
(Wijayanti and Rustam, 2015).
Data Analysis Technique
Factor analysis is a multivariate statistics technique used to define the structure of a data matrix and analyze the structure of correlation in a large number of variables (test score, test item, and questionnaire response) by defining a set of similarity variable or dimension or also known as factor. Factor analysis is used to find a way to resume information contained in the original variables (previous) into a set of new dimensions or variate (factor) (Ghozali, 2006).
Procedures of factor analysis include the following steps:
a. Problem Formulation
Problem in this study are identifying and classifying the factors related to corruption.
b. Rate of factor analysis assumption
Factor analysis requires that the data matrix should have enough correlation. Factor analysis assumes that the value of correlation is above 0.30 with SPSS partial correlation value is known from anti-image correlation matrix containing negative partial correlation. Another assumption of factor analysis is to know the overall
correlation matrix. Correlation among variables is known from Bartlett's test of Sphericity test, and if the result is significant, the correlation matrix will have significant correlation with a number of variables. Test on Measure of Sampling Quasi (MSA) can also be used to view the inter-correlation among variables. MSA value varies from 0-1, factor analysis requires MSA value ≥ 1. Kaiser-Meyer Olkin (KMO) method can also be used to determine the adequacy of data in the factor analysis. KMO method is used to measure the adequacy of the overall sampling and sampling of each indicator.
c. Factor Extraction
Factor Extraction is a method used to reduce the data from several indicators to generate fewer factors that can explain the observed correlation among indicators.
This study uses Principal Components Analysis (PCA) method or main component analysis which is the simplest method in conducting extraction factor. PCA forms linear combination of indicators observed. Each initial variable has a variance value correlated to the variability of each respondent response. The amount of variance of variables X1 is explained or forwarded by existing factors (Factor 1 and Factor 2) which is called communality.
d. Factor Rotation
Factor Rotation is used to interpret factor and to clarify variables included in particular factor. Factor Rotation method used in this study is Varimax with Kaiser Normalization, which is a method of orthogonal rotation used to minimize the number of indicators that have a high factor loading in each factor.
e. Factor Interpretation
After obtaining a number of valid factors, interpretation is then conducted to names of factors. Factor Interpretation can be done by knowing variables that shape it.
Interpretation is done by judgment.
FINDINGS AND DISCUSSION
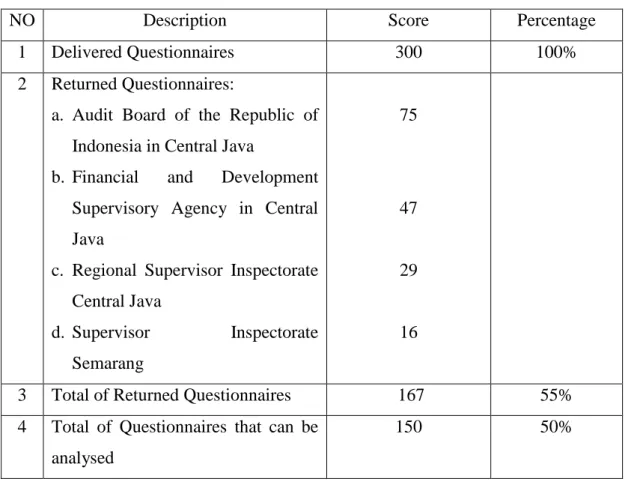
The research data are collected by distributing as many as 300 questionnaires to respondents from auditors of BPK and BPKP in representative office in Central Java, auditors of Supervisory Inspectorate in provinces and districts and municipalities in Central Java. The delivery time is in May 2015. The number of questionnaires returned is as many as 167 questionnaires. Of this amount, questionnaires that are completely filled out and can be used for data processing are as many as 150 questionnaires. Thus, the response rate from
questionnaires distributed is 50%. This means that the actual response rate is higher than the previously predicted response rate that amounts 30%. Total number of delivery and return of the questionnaire in this study is described in Table 1.
Table 1. Total Number of Delivery and Return Questionnaire
NO Description Score Percentage
1 Delivered Questionnaires 300 100%
2 Returned Questionnaires:
a. Audit Board of the Republic of Indonesia in Central Java
b. Financial and Development Supervisory Agency in Central Java
c. Regional Supervisor Inspectorate Central Java
d. Supervisor Inspectorate Semarang
75
47
29
16
3 Total of Returned Questionnaires 167 55%
4 Total of Questionnaires that can be analysed
150 50%
Source: Primary Data 2016 Respondent Demography
The number of respondents used for data processing in this study is as many as 150 people. General overview of the respondents profile is as follows: male respondents are 69 people (46.7%), female respondents are 70 people (46.7%), and respondents who did not specify their gender are 10 people (6.7%). Respondents who are D3/Diploma are people 12 (8%), while Barchelor degree are as many as 96 people (64%), master degree are as many as 33 people (22%), those who have completed doctoral degree are as many as 1 (0.7%) and those who do not include their educational background are 8 people (5,3%). Respondents who are associate expert auditors are 13 people (8.7%), young expert auditors are 63 people (42%), primary expert auditors are 39 people (26%), supervising auditors are 9 people (6%), advanced executive auditors are as many as 2 people (1.3%), executive auditors are 4 people (2.7%) and auditors who did not fill their position are 20 people (13.3%). Therefore, the total
respondents are 150 people with 69 respondents (46%) from BPK Central Java, 44 respondents (29.3%) from BPKP Central Java, 25 respondents (16.7%) from IPDA Central Java, and 12 respondents (8%) from IPDA Semarang. The total respondents responses that can be processed are 150 people.
Results of Test on Factor analysis of Corruption Prevention
Based on the results of SPSS output from 9 (nine) factors suspected to be the cause of corruption which are answered by 150 respondents in the questionnaire, it is obtained the following results:
1. Variable Feasibility Analysis
a. Determinant of Correlation Matrix
Result of Determinant of Correlation Matrix is 0.285. This value is far from 0 (zero), so the correlation matrix among variables is stated as not related.
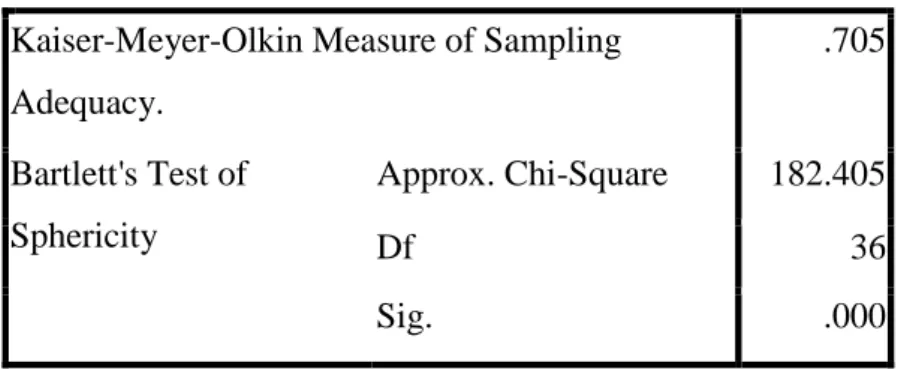
b. Kaiser Meyer Olkin Measure of Sampling (KMO)
Table 2. Results of KMO and Bartlett's Test KMO and Bartlett's Test
Kaiser-Meyer-Olkin Measure of Sampling Adequacy.
.705
Bartlett's Test of Sphericity
Approx. Chi-Square 182.405
Df 36
Sig. .000
Kaiser Meyer Olkin Measure of Sampling (KMO) is an index of comparison on distance between correlation coefficient and partial correlation coefficient. If the sum of the partial correlation coefficient quadrant of all pairs of variables is smaller than the sum of correlation coefficient quadrant, it will result a value which is closed to 1 (one). KMO score is considered as sufficient if it is more than 0.5. The results show that Kaiser Meyer Olkin Measure of Sampling score is 0.705. Thus, KMO meets the requirements because it has score above 0.5. The result of calculation with SPSS generate Bartlett Test of Sphericity value of 182.405 with a significance of 0.000.
Thus, Bartlett Test of Spehricity meets the requirements due to significance score that is below 0.05 (5%).
c. Measures of Sampling Adequacy (MSA)
MSA requirement test is conducted to 9 (nine) variables. The result is shown in Anti Image Correlation row with sign "a". For example, "HR" value of MSA = 0.680 where > 0.5 means that "HR" meets the requirement of MSA. Of 9 (nine) variables, all are qualified to be used to analyze the factors on the next steps.
2. Factor Extraction
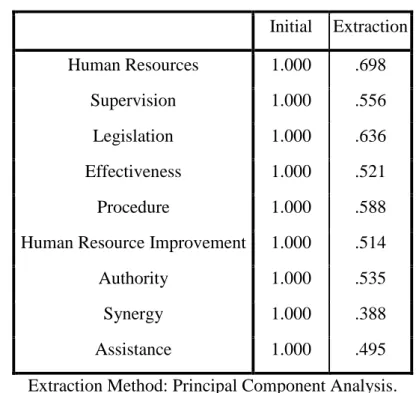
Extraction of factors done to determine the value of communality is shown in Table 3.
Table 3. Results of communality Communalities
Initial Extraction
Human Resources 1.000 .698
Supervision 1.000 .556
Legislation 1.000 .636
Effectiveness 1.000 .521
Procedure 1.000 .588
Human Resource Improvement 1.000 .514
Authority 1.000 .535
Synergy 1.000 .388
Assistance 1.000 .495
Extraction Method: Principal Component Analysis.
Based on Table 3, there are 7 (seven) of 9 (nine) variables tested that meet the requirements of communality that have greater value than 0.5 (communality > 0.5). If there is a variable with value <0.5 in Extraction communalities table, then the variable will not be eligible for communality and must be removed from the test. Then, the test should be repeated from begining without including variables that is not qualified.
Variables that are removed or extracted are synergy and assistance variables.
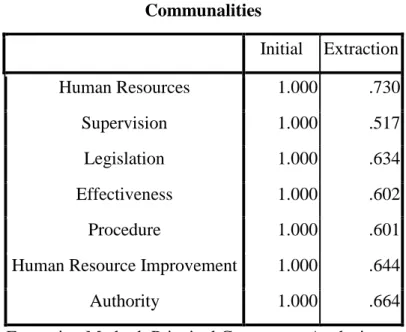
After re-extraction, analysis with seven (7) qualified variables of communality requirements is done and illustrated in Table 4.
Table 4. Results of Post-Extraction Crime Communalities
Initial Extraction
Human Resources 1.000 .730
Supervision 1.000 .517
Legislation 1.000 .634
Effectiveness 1.000 .602
Procedure 1.000 .601
Human Resource Improvement 1.000 .644
Authority 1.000 .664
Extraction Method: Principal Component Analysis.
Table 4 shows that after repeating without synergy and assistance variables, the value of Determinant: 0.453. KMO: 0.662, Bartlett Test of Sphericity: 115.412 with sig:
0,000. Then, the requirements of KMO and Bartlett Test of Sphericity are fulfilled, and the value of MSA shows that all seven variables tested meet the requirements of communality that is greater than 0.5 (communality > 0.5). Communality value indicates how much a variable can explain factors. For example, HR value is 0.730, meaning that the variable can explain the human resources factor as many as 73.0%. It is similar for other variables, in which all are > 50%. Therefore, it can be concluded that all variables can explain factors.
3. Factor Rotation
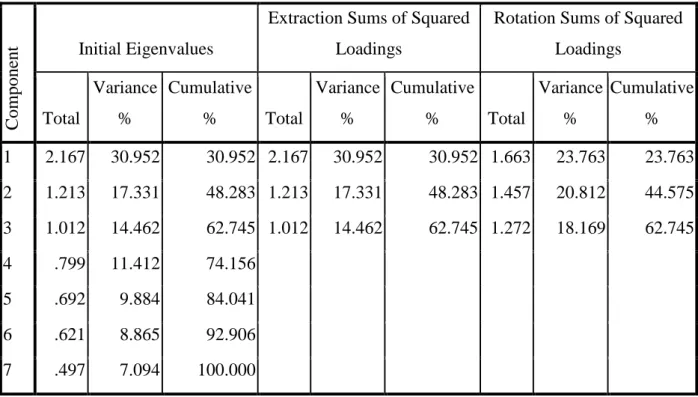
Factor Rotation is conducted to determine factors that are likely to be formed. Factor Rotation, seen from Total Variance Explained, is useful to determine what factors might be formed. The result of Total Variance Explained test shows that there are seven components that can represent the variables. Next is to consider "Initial Eigenvalues"
value of the seven components that have value > 1 (one) (see Table 5).
Table 5. Results Total Variance Explained
Component
Initial Eigenvalues
Extraction Sums of Squared Loadings
Rotation Sums of Squared Loadings
Total
Variance
%
Cumulative
% Total
Variance
%
Cumulative
% Total
Variance
%
Cumulative
% 1 2.167 30.952 30.952 2.167 30.952 30.952 1.663 23.763 23.763 2 1.213 17.331 48.283 1.213 17.331 48.283 1.457 20.812 44.575 3 1.012 14.462 62.745 1.012 14.462 62.745 1.272 18.169 62.745 4 .799 11.412 74.156
5 .692 9.884 84.041
6 .621 8.865 92.906
7 .497 7.094 100.000
Based on Table 5, in the column "Component" it is known that there are 7 (seven) components that can represent the variables. In the column "Initial Eigenvalues", it has determined that the value is 1 (one) by SPSS. Variance can be explained by factor 1 is 2.167/7 x 100% = 30.952, by factor 2 is 1.213/7 x 100% = 17.331, while by factor 3 is 1.012/7 x 100% = 14.462. Thus, total of the three factors will be able to explain the variable as many as 30.952% +17.331% = 62.745% + 14.462%. Therefore, since the value of Eigenvalues has been set as 1 (one), then the total value to be taken is > 1, namely component 1, 2 and 3.
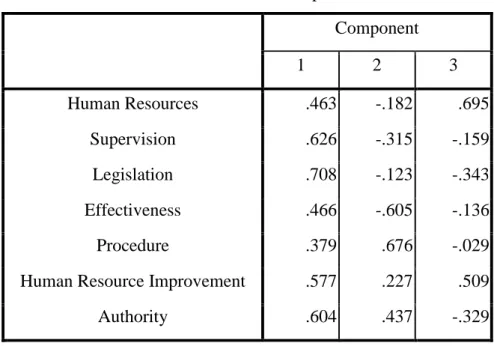
After knowing that the maximum factor that may be formed is 3 factor, then it can be performed determination on which variable will go into which factor, whether it is factor 1, 2 or 3. How to determine that is by seeing the table of Component Matrix to show how big a variable correlated with factors that will be formed.
Table 6. Matrix Component
Component
1 2 3
Human Resources .463 -.182 .695
Supervision .626 -.315 -.159
Legislation .708 -.123 -.343
Effectiveness .466 -.605 -.136
Procedure .379 .676 -.029
Human Resource Improvement .577 .227 .509
Authority .604 .437 -.329
Extraction Method: Principal Component Analysis.
a. 3 components extracted.
According to Table 6, it is known that the factor "Human Resources" is correlated as many as 0.463 with factor 1, -0.182 with factor 2 and 0.695 with factor 3. The determination of inclusion is by looking at the largest correlation value. In Table 6, it has been sorted from the largest value to the smallest per factors. Supervision is correlated with factor 1 with amount 0.691, so did Legislation: 0.707 and 0.740 effectiveness. The most correlated with factor 2 is Authority: 0.759 and procedure: 0,751. While Human Resources with correlation of 0.832 and Human Resources improvement with correlation of 0.720 are more correlated with factor 3. It can be concluded that members of each of factor are as follows:
Factor 1: Effectiveness, Legislation, and Supervision Factor 2: Authority and Procedure
Factor 3: Human Resources and Human Resources improvement 4. Factor Interpretation
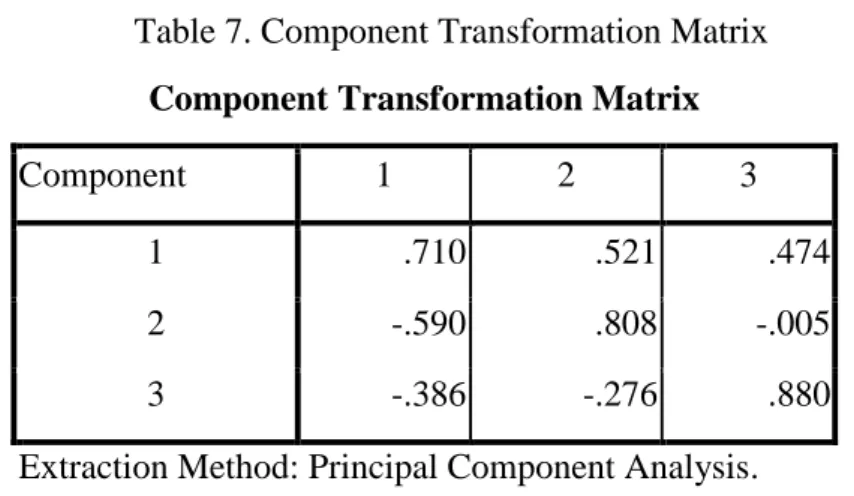
After obtaining a number of valid factors, it is prformed an interpretation on the name of factors. Interpretation of factors can be done by knowing the variables that shape it. Interpretation is done by judgment. Interpretation of factors is based on the final result by seeing Table 7 as follows:
Table 7. Component Transformation Matrix Component Transformation Matrix
Component 1 2 3
1 .710 .521 .474
2 -.590 .808 -.005
3 -.386 -.276 .880
Extraction Method: Principal Component Analysis.
Rotation Method: Varimax with Kaiser Normalization.
Table 7 shows that in component 1, the correlation value is 0.710 > 0.5, component 2: 0.808 > 0.5 and component 3: 0.880 > 0.5. Because all components are > 0.5, then three factors formed can be said as precise in summarizing the seventh existing variable.
These three factors are:
a. Factor 1 is the effectiveness of follow-up on the examination results of representative bodies that have Supervision function, the provisions of the legislation are not yet completed, and internal government monitoring Apparatus (APIP) has not optimally served.
b. Factor 2 is the authority of government audit institutions and management control systems of government audit institutions and factor of audit procedure is not fully implemented.
c. Factor 3 is the competence of human resources and Human Resources improvement of internal auditors and external auditors.
Once the factors are formed, it is necessary to give a new label which is representative for the variables included in each factor: Factor 1 (Government Performance Monitoring Infrastructure, 30.952%), Factor 2 (Management Control System of Government Audit Institution, 17.331%), Factor 3 (Competence of Government Auditors, 14.462%).
CONCLUSION
1. Based on the results of factor analysis, it is obtained three main factors that affect the prevention of corruption in central Java. These factors become a basis in formulating a model of corruption prevention in Central Java. They are 1) Government
Performance Monitoring Infrastructure, 2) Management Control System of Government audit institution, and 3) Competency of Government Auditor.
2. The results of this study prove that the most important factor in corruption prevention is factor of government performance monitoring infrastructure that focuses on the importance of legislation, the importance of internal auditors and legislature's oversight. These results support the concept of Good Government Governance according to Mardiasmo (2006), supporting the theory of factors in preventing corruption from Amrizal (2004) and Kuntadi (2016), as well as supporting research results of Kongrungchock & Stanton, 2014; Baltaci and Yinmaz 2006; Richard, 2009;
Chabrac and Daidj, 2007; Srichunpech, 2005).
3. The results of this study can still be passed on to reveal more variables of Government Performance Monitoring Infrastructure, management control systems and factor of personal auditor by connecting them with variables of behavioural dysfunctional of audit and auditing quality.
REFERENCE
Transparansi Internasional Indonesia. (2015). Setiap Tahun Indeks Korupsi Indonesia Meningkat. Diakses dari www.ti.or.id
KPMG. (2013). KPMG Forensic- Survey of fraud, bribery and corruption in Australia and New Zealand 2012.
Zang, Y., Zhou, J., & Zhou, N. (2007). Audit Committee Quality, Auditor Independence, and Internal Control Weaknesses. Journal of Accounting and Public Policy, 26. 300–327.
Mardiasmo. (2006). Perwujudan Transparansi dan Akuntabilitas Publik melalui Akuntansi Sektor Publik: Suatu Sarana Good Governance. Jurnal Akuntansi Pemerintah, 2(1).
Kongrungchok, A., & Stanton, P. (2014). Limitations of Thai Local Government Internal Auditing in Detecting Risks. Proceedings of the First Asia-Pacific Conference on Global Business, Economics, Finance and Social Sciences (AP14Singapore Conference) ISBN: 9781-941505-15-1. Paper ID: S454.
Baltaci, M., & Yilmaz, S. (2006). Keeping an Eye on Subnational Governments: Internal Control and Audit at Local Levels. The International Bank for Reconstruction and Development/ the World Bank. USA. Stock No. 37257.
Ricard, P. (2009). Report of the Chairman of the Board of Directors on Internal Control and Risk Management of Pernod Ricard in France, Journal of Corporate Governance and Internal Control (Reference Document 2008-2009), 1534.
Chabrak, N. & Daidj, N. (2007).“Enron: Widespread Myopia‟, Critical Perspectives On Accounting, 18, 539-557.
Srichunpech, S. (2005). The Roles of Internal Auditors with Fraud in Organizations. Journal of Business Chulalongkorn Criticisms, 104(2) (April-June), 48-59.
Komisi Pemberantasan Korupsi Republik Indonesia. (2013). Laporan Tahunan KPK Tahun 2012.
Undang-Undang Nomor 39 Tahun 2008 tentang Kementerian Negara.
Blume, L. & Voigt, S. (2011). Does organizational design of supreme audit institutions matter? A cross-country assessment. European Journal of Political Economy, 27, 215–
229.
Badan Pengawasan Keuangan Pembangunan, (2014b). Meningkatkan Kompetensi APIP dengan Diklat Auditor Ahli. Diakses dari www.pusbinjfa.bpkp.go.id/bali/
berita/read/11845/25.
Badan Pengawasan Keuangan Pembangunan, (2014a). Profil Auditor Per 30 Juni 2014.
Diakses dari www.pusbinjfa.bpkp.go.id/ halaman/16.
Ge, W., Li, Z., Liu, Q., & McVay, S. (2014). The Effect of Internal Control on Corporate Corruption: Evidence from China. National Natural Science Foundation of China.
Project Nos. 71332008.
Dewi, G. A. K. (2014). Pengaruh moralitas individu dan pengendalian internal pada kecurangan akuntansi (studi eksperimen pada pemerintah daerah Provinsi Bali).
Program pascasarjana Universitas Udayana. Thesis.
Liu, J., & Lin, B. (2012). Government auditing and corruption control: Evidence from China’s provincial panel data. China Journal of Accounting Research, 5, 163186.
Ali, A. M., & Isse, H. S., (2003). Determinants of economic corruption: a cross-country comparison. Canto Journal, 22 (3), 449– 466.
Fisman, R., & R. Gati, 2001. Decentralization and corruption: Evidence across countries.
Journal of Public Economics, 83, 867-893.
Cressey, D. R. (1953). Application and Verification of The Differential Association Theory.
Journal of Criminal Law and Criminology, 43, 43-52.
American Institute Certified Public Accountant (AICPA), (2002). Statement on Auditing Standards No.99: Consideration of Fraud. Diakses dari www.aicpa.org.
Chetwynd, E., Chetwynd, F., & Spector, B. (2003). Corruption and Poverty: A Review of Recent Literature. Management Systems International. Washington DC. USA
Johnston, M. (2000). Corruption and Democracy: Threats to Development, Opportunities for Reform. Paper prepared for Department of Political Science, Colgate University.
Mauro, P. (2002). The Effects of Corruption on Growth and Public Expenditure. Chapter 20 in Heidenheimer and Johnston. 2002.
Gupta, S., Hamid, D., & Erwin, T. (2000). Corruption and the Provision of Health Care and Education Services. IMF Working Paper 00/116.
Gupta, S., Hamid, D., & Rosa, A. T. (1998). Does Corruption Affect Income Equality and Poverty?. IMF Working Paper 98/76.
Kaufmann, D., & Kraay, A. (2002). Governance Matters II, Updated Indicators for 2000/01.
World Bank Policy Research Working Paper 2772.
World Bank. (2000). Anti-Corruption in Transition: A Contribution to the Policy Debate.
Javaid, U. (2010). Corruption and Its Deep Impact On Good Governance In Pakistan.
Pakistan Economic and Social Review, 1, 123-134.
Amrizal, 2004, “Pencegahan dan Pendeteksian kecurangan oleh internal auditor”. BPKP.
(31 Januari 2012)
Wijayanti, P & Hanafi, R (2015), Determinant Of Quality Audit For The Corruption's Prevention On The Government Audit Institute In Central Java, Indonesia, AICIF