Chapter 2
A newer application of caustics is the measurement of the J-integral in elastic-plastic bodies. When the initial curve is within a region of dominance of the plane stress HRR field, an alternative analysis of caustics must be used.
Chapter 3
Dynamic Crack Propagation
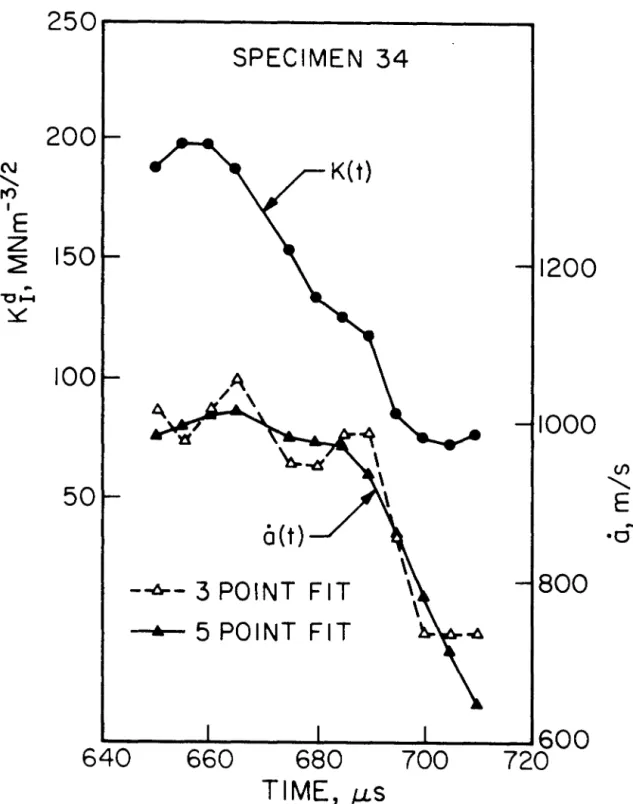
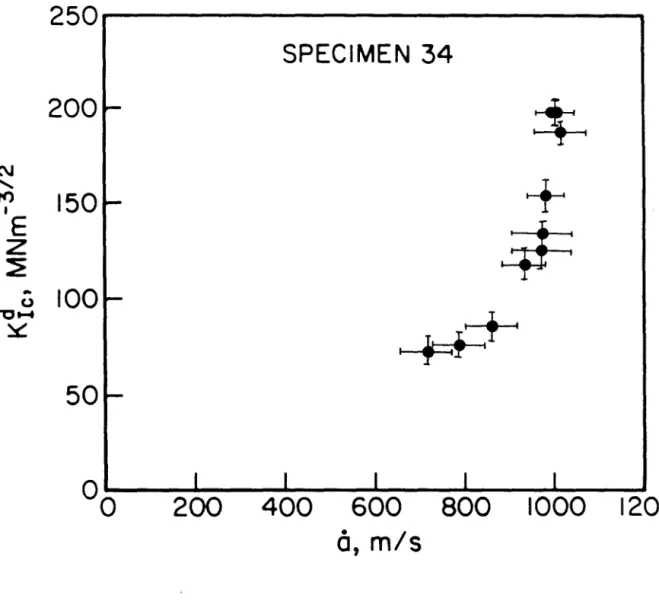
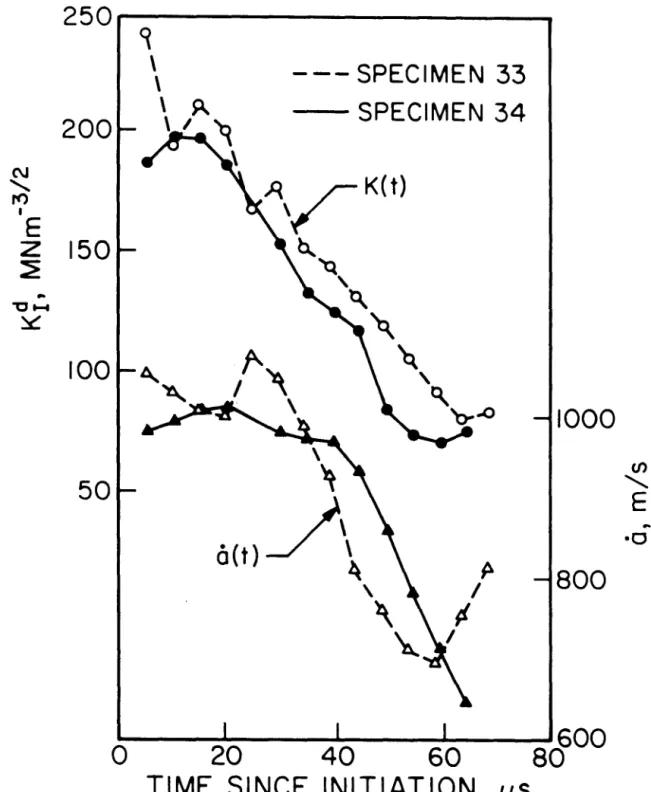
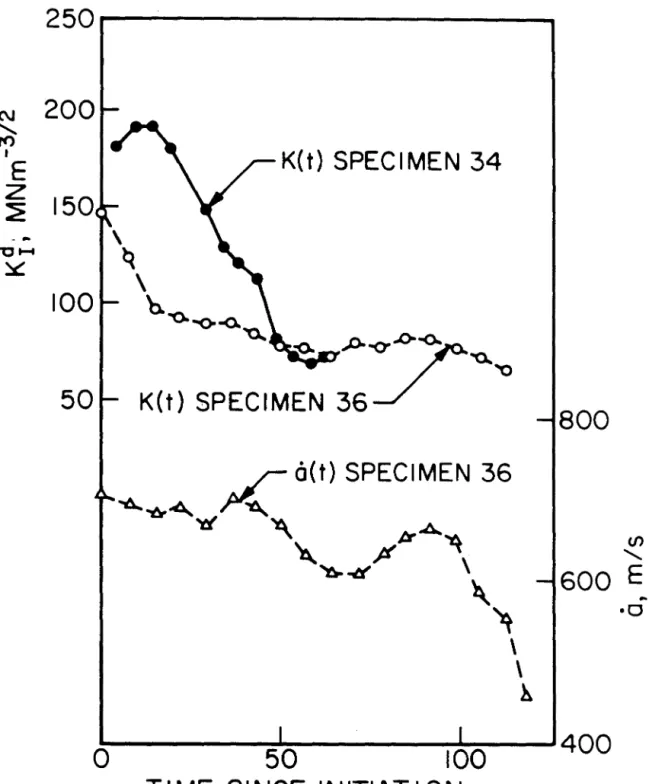
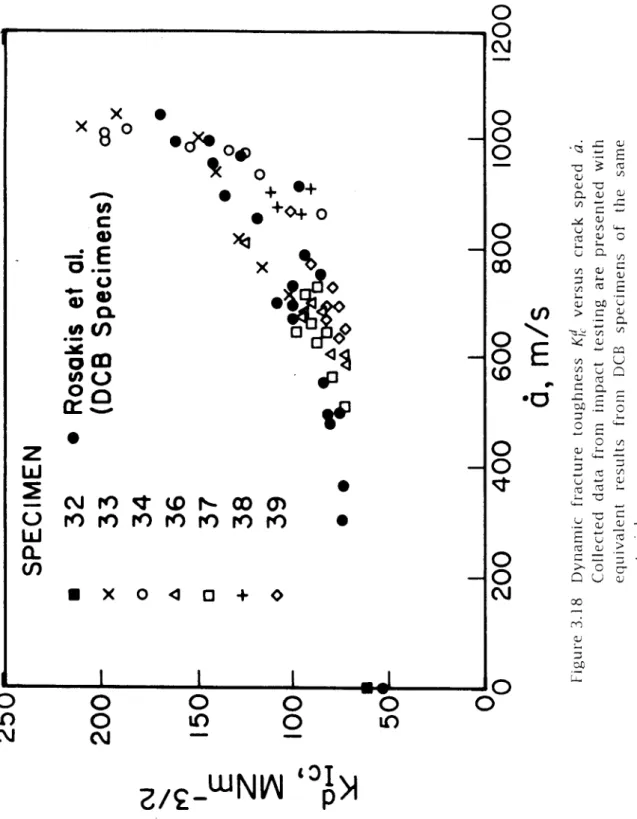
Because of the longer lateral dimensions of the 3-point bending pattern, there are no strong reflected stress waves affecting the crack tip. Some characteristics of crack tip loading can be identified by examining the results of various tests.
Chapter 4
Numerical Calculations
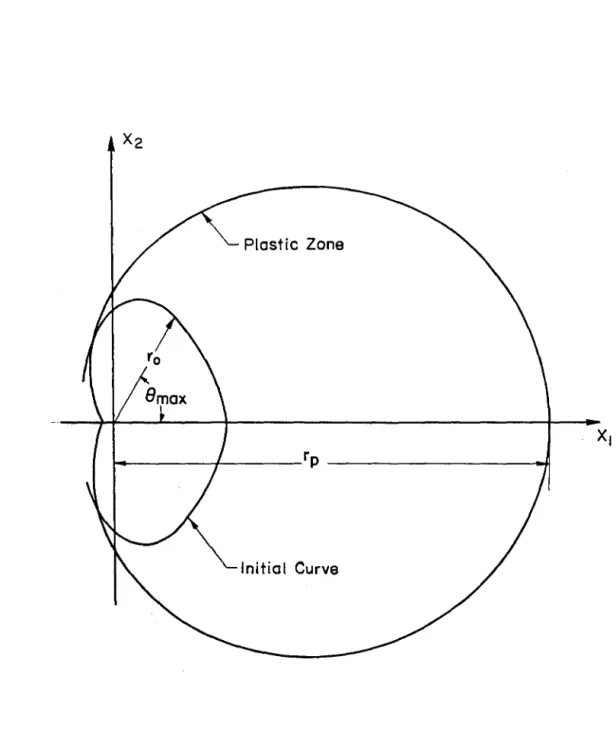
In Figure 4.4, the plastic strain distributions tf2/c0 and cf3/c0 are compared with the strains predicted by the HRR solution. We see that for r0/rp=0.19 the numerically simulated caustic matches in shape the caustic predicted using the HRR field, Figure 2.7. When r0/rp=l.3, the numerically simulated caustic, Figure 4.6f, matches the caustic predicted using the elastic field K1.
Experimental Results and Discussion
The tests proceeded by loading the specimen to a certain level and then maintaining that level while photons were photographed for different values of z0• The load was then increased one step and the process repeated. By comparing the shapes of the experimentally observed caustics with the predicted caustic shape (Figure 2.7a) further information about the area of dominance of the HRR field can be obtained. If the caustic is not shaped similarly to the predicted caustic, the displacement fields near the initial curve may not match that of the HRR field.
The etching in Figure 4.10 deviates from the predicted form of Yo/Yp;?:0.35, indicating that below the small scale that gives an upper limit to the dominance of the HRR field, y:::::: 0.35Yp·. It was observed that for Yo/Yp as small as 0.7 the caustic curve remained close to the elastic form. Thus, the effect of the plastic zone on the etching cannot be judged by observing the etching form.
In [20] it was shown that in elastic materials this region extends for distances from the crack smaller than half the thickness of the sample. The use of the caustic method for measuring the J integral in plastically deformed materials was investigated. For a caustic obtained from an elastic zone, the presence of a plastic zone causes errors in the measurement of the elastic stress intensity factor when r0<1.5rP. In an actual test specimen, there is a region near the crack tip where the strain field is not a plane stress field but is three-dimensional.
Chapter 5
This is due to the combination of surface roughening due to plastic deformation near the crack and high edge density near the crack tip due to steep deformation gradients there. The highest load for which the edges near the crack tip could be resolved was 5 7300 N. The level of initial flattening of the specimens is shown in figure 5.11 where it can be seen that over 5 cm the height of the unloaded specimen surface does not change by more than D .Actually the location of the zero displacement point before the crack tip changes slightly as the specimen is loaded, and although this was accounted for, using a fixed zero point would have introduced some error.
Data is only shown as close as possible to the crack tip, as the edges can be distinguished. In general, edges can be measured up to about 0.3 mm before the crack tip and up to about 0.5 mm behind the crack tip. Displacement gradients are much larger behind the crack tip than in front of the crack tip.
This is consistent with the results of Chapter 4, where it was found that caustics based on HRR fields cannot be used to accurately measure J. The asymptotic HRR field does not match the actual field due to the three-dimensionality of the fields at the crack tip and the finite dimensions of the specimen, whose higher-order terms become important away from the crack tip. How close the crack is to the in-plane dimensions of the specimen will depend on the geometry of the specimen and whether the material is non-linear with the degree of applied stress. This result is in contrast to the present results and those in [71) which show that -u3 is largest at the crack tip.
Chapter 6
- Theoretical Concerns
- Description of Experiments
- Results and Discussion
- Limitations of Caustics
Under static loading, there is a one to one relationship between J and the crack tip displacement field. The questions to be solved are (i) characterize )J the crack tip stress and strain fields. ii) Is the relationship between J and .ilstatic the same as the relationship between )J and LlJynamic. iii). Some analytical estimates are available which indicate that the crack tip fields are statically and dynamically the same.
The impact indentation problem produces the same slip line field as the tensile crack problem, so these results are evidence that the fields near the crack tip are statically and dynamically the same. A consequence of the results showing that the fields near the crack tip are statically and dynamically the same is that there must be a region near the crack tip where J, as defined by equation (6.1), is path-independent even under dynamic loading. This result means that in the region close enough to the crack tip, the strain and stress fields are statically and dynamically of the same nature.
Similarly, strains measured near the crack tip should have the same ratio to J statically as dynamically. If the crack tip fields are assumed to be those of the HRR fields, then [77). This asymmetry results in the bite not closing on itself behind the crack tip.
Chapter 7
Rice, JR., and Rosengren, G.F., "Plane Strain Deformation Near a Crack Tip in a Power-Law Hardening Material," Journal for the Mechanics and Physics of Solids, Vol. Ma, CC, and Freund, L.B., "Analysis of the Optical Shadow Spot Method for a Tensile Crack in a Power-Law Hardening Material," Journal of Applied Mechanics, Vol. Rosakis, AJ, and Freund, L.B., "Optical measurement of the plastic stress concentration at a crack tip in a ductile steel plate", Journal of Engineering Materials and Technology, Vol.
Freund, L.B., and Douglas, A., "The Influence of Inertia on Elastic Plastic Anti-plane Shear Crack Growth," Journal of the Mechanics and Physics of Solids, Vol. Freund, L.B., and Hutchinson, J.W., "High Strain-Rate Crack Growth in Rate-Dependent Plastic Solids," Journal of the Mechanics and Physics of Solids, Vol. Kanninen, M.F., "Application of dynamic fracture mechanics for predicting crack arrest in engineering structures," International Journal of Fracture, Vol.
Theocaris, P.S., and Georgiadis, H.G., "Rayleigh Waves Emitted by a Propagating Crack in a Strain-Rate Dependent Elastic Medium," Journal of the Mechanics and Physics of Solids, Vol 32, 1984, pp. Nakamura, T., Shih, C.F., and Freund, L.B., "Elastic-Plastic Analysis of a Dynamically Loaded Circumferentially Notched Round Bar," Engineering Fracture Mechanics, Vol. Nakamura, T., Shih, C.F., and Freund, L.B., "Analysis of a Dynamically Loaded Three-Point Bend Tensile Fracture Specimen," Engineering Fracture Mechanics, Vol.
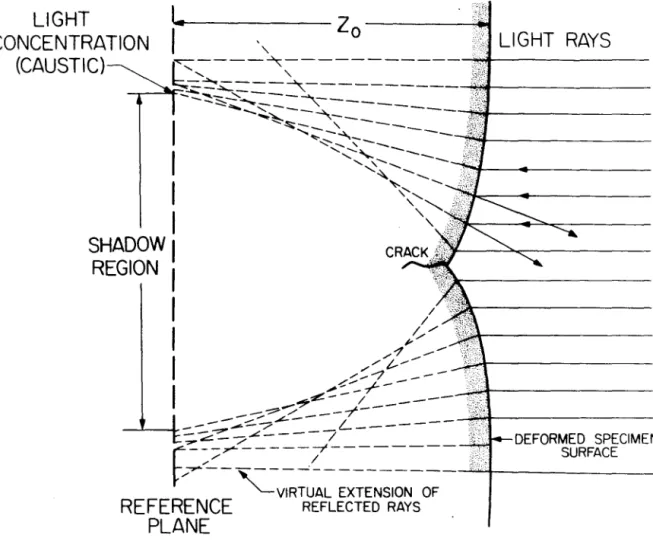
LIGHT
CONCENTRATION (CAUSTIC)
LIGHT RAYS
PLANE
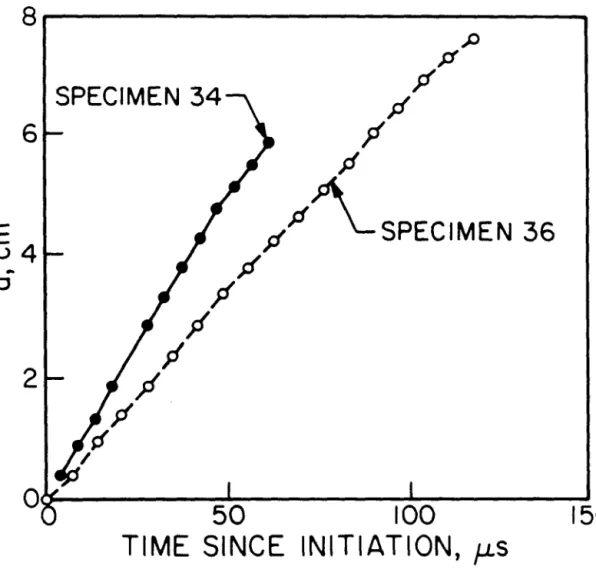
SPECIMEN 34
5 POINT FIT
Optical Micrographs SEM
PLASTIC ZONE HRR FIELD
Parallel Light Beam Lens
4340 STEEL
1018 COLD ROLLED STEEL
Flat mirror sample Collimating lens beam expander He-Ne Laser Beam Splitter 35 mm camera Figure 5.3 Diagram of optical setup for interferometry.
N,. 'poo1
Appendix A
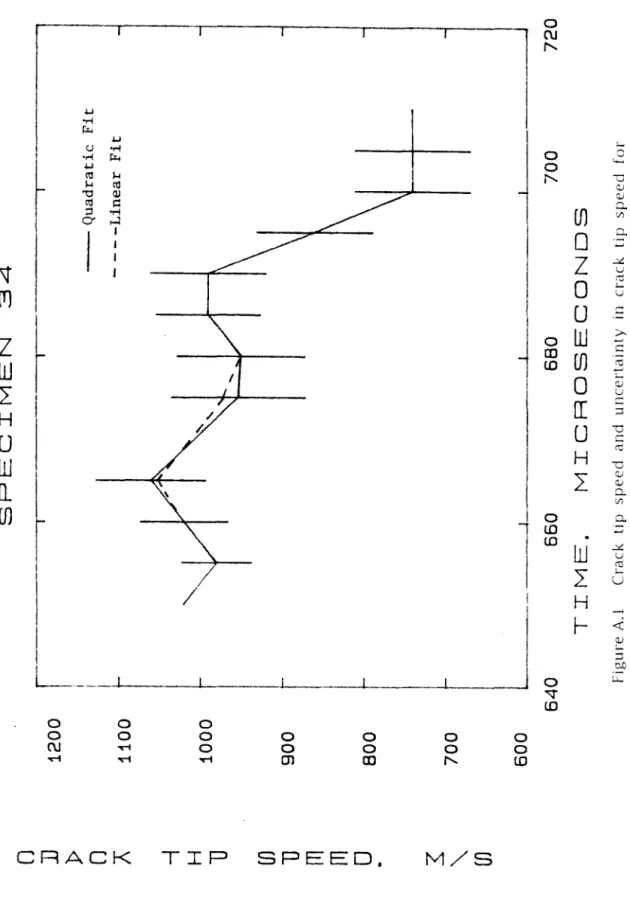
An analysis is presented here to determine the uncertainty of the crack tip velocity based on the uncertainty of the measured crack lengths and corresponding times. At this time, the author has never seen an estimate of the uncertainty given in any paper on dynamic fracture propagation. Let .:O.t be the time interval between measurements and let .:O.a be the crack length increment during this time.
For test sample 34, the crack length could be measured to an accuracy of between ±.02 mm and. The uncertainty ba is not constant as there are differences in the brightness of the biting photos from frame to frame. The uncertainty in a is relatively large; within the experimental accuracy the crack tip speed can be considered constant for the first 4011s.
Using techniques and materials developed by Suidwes Research Institute, crack length was measured by recording the breaking of conductive strips on the sample surface. These results show that the careful use of conductive strips can produce data with approximately twice the accuracy of optical measurements using caustics. It is suggested that conductive strips be used in conjunction with optical caustic measurements to improve the accuracy of.
Appendix B
Since 5=f=u3 was assumed in the analysis of the interferograms, the error in S, bS represents the absolute error in the measured values of u3. This was done by focusing the camera on the crack tip so that (z0 - f)=O at the crack tip, where ~f is largest. A quantitative estimate of the error can be obtained by placing the measured u3 values in equation (B.1).
However, so will the fringe density, and when the fringe density exceeds the recording resolution, no data can be obtained; so there is no need to worry about accuracy for very large deformations. The main source of error is the uncertainty in the location of the crack tip and the accuracy limitations of digitizing the interferograms. As seen in the interference photographs, Figures 5.12 and 5.13, the crack tip is obscured by a small etch, limiting how close to the crack tip fringes can be re-promising.
Incident Light Ray
Appendix C
K111 is the mode III stress intensity factor, Tx and Ty are antiplane shear stresses, 10 is the yield stress in shear and pis the elastic shear modulus. The time variation of Kiil represents the time variation of the loads applied to the body. For a plastic zone of 2 cm, this analysis shows that the inertial effects through the plastic zone are small.