The Great American Schism:
Divergence of Marine
Organisms After the Rise of the Central American Isthmus
H.A. Lessios
Smithsonian Tropical Research Institute, Apartado 0843-03092, Balboa, Ancon, Republic of Panama; email: [email protected]
Annu. Rev. Ecol. Evol. Syst. 2008. 39:63-91 The Annual Review of Ecology, Evolution, and Systematics is online at ecolsys.annualreviews.c This article's doi:
10.1146/annurev.ecolsys.38.091206.095815 Copyright © 2008 by Annual Reviews.
All rights reserved
1543-592X/08/1201-0063$20.00
Key Words
adaptation, molecular clock, molecular substitution rate, Panama, productivity
Abstract
After a 12-million-year (My) process, the Central American Isthmus was completed 2.8 My ago. Its emergence affected current flow, salinity, temper- ature, and primary productivity of the Pacific and the Atlantic and launched marine organisms of the two oceans into independent evolutionary trajec- tories. Those that did not go extinct have diverged. As no vicariant event is better dated than the isthmus, molecular divergence between species pairs on its two coasts is of interest. A total of 3 8 regions of DNA have been sequenced in 9 clades of echinoids, 38 of crustaceans, 42 of fishes, and 26 of molluscs with amphi-isthmian subclades. Of these, 34 are likely to have been separated at the final stages of Isthmus completion, 73 split earlier and 8 maintained post-closure genetic contact. Reproductive isolation has developed between several isolates, but is complete in only the sea urchin Diadema. Adaptive divergence can be seen in life history parameters. Lower primary productivity in the Caribbean has led to the evolution of higher levels of maternal provisioning in marine invertebrates.
INTRODUCTION
When the Central American Isthmus joined North and South America by uninterrupted land, the migration of terrestrial animals led to monumental species range expansions, radiations, and extinctions in both subcontinents (Marshall et al. 1982, Webb & Barnosky 1989). The apt name
"Great American Interchange" was coined for this event (Stehli & Webb 1985). What was a great interchange on land was a great schism in the sea. Before the ranges of terrestrial species started to expand, the ranges of marine species were being sundered by an uninterrupted barrier that neither larvae nor adults could cross, starting them on a path of independent evolutionary trajectories. For some species, these trajectories ended in extinction. Others are still in today's oceans presenting the opportunity to determine what changes can occur in a minimum of 2-3 million years (My) of separate evolution. Such sister species have been named geminate by Jordan (1908). Geminate species represent initially similar genomes placed into separate environments and constitute a natural experiment that can tell us much about evolutionary divergence and its causes.
Since the publication of past reviews of the isthmian schism (T. Collins 1996, Glynn 1982, Jones
& Hasson 1985, Lessios 1998), new studies in stratigraphy and paleontology have added to the understanding of events that have lead to the assembly of tropical Atlantic and Pacific faunas after isolation (reviews in Allmon 2001, Budd 2000, L. Collins & Coates 1999, Jackson et al. 1996a).
This review focuses on the divergence of sister clades with extant members on the two sides of the Isthmus. To understand what led to present day divergence, one needs to know what happened in the past, so I start by summarizing information about the geological event that initiated the entire process and about its environmental consequences before addressing the questions: (a) At what rate did geminate clades diverge? (b) Which of the environmental differences between the oceans have been important for divergence of what traits? And, (c) What can be learned about speciation through comparisons of populations isolated from each other for 3 My?
THE GEOLOGICAL EVENT AND ITS ENVIRONMENTAL CONSEQUENCES
The geological history of the Central American Isthmus, from the time that it started forming in deep water to the time that it emerged to become dryland, is reviewed by Coates & Obando (1996) and by Coates (1997). The completion of the Isthmus most likely occurred in the late Pliocene, 2.8 My ago (Mya) (Coates et al. 2005), but the process lasted for approximately 12 My. Until the middle Miocene, 16-15 Mya, there were abyssal water connections between the two oceans. At 8 Mya, the depth of the Atrato Strait next to Colombia was at least 150 m deep (Duque-Caro 1990), while the Panama Canal basin had shoaled temporarily to about 25 m, only to become 200 m deep at 6 Mya (L. Collins et al. 1996a). By 3 Mya, only narrow channels remained, which were filled with sediment soon thereafter to completely separate the waters of the tropical western Atlantic (WA) and the tropical eastern Pacific (EP).
The shoaling of the Isthmus had dramatic effects on the physical environments of both oceans.
Circulation of deep water began to be affected by 5-4 Mya (Keigwin 1982, Haug & Tiedemann 1998). Surface salinities in the WA started increasing about the same time (Keigwin 1982). A warm circumtropical surface current that was flowing westward through the seaway until 3.65 Mya was blocked (Kameo & Sato 2000). The Isthmus deflected the Atlantic North Equatorial Current northward and intensified the flow of the Gulf Stream (Berggren & Hollister 1974, Burton et al.
1997). Caribbean water became warmer and saltier and, when transported northward, resulted in higher precipitation over land at high latitudes and more influx of fresh water into the Arctic, thus initiating the formation of land-based ice sheets (Bartoli et al. 2005, Driscoll & Haug 1998, Haug
64 Lessios
& Tiedemann 1998, Lear et al. 2003, but see Raymo 1994 and Lunt et al. 2008). The glaciation cycles, which first appeared in Atlantic subpolar regions at 3.2 Mya and intensified at 2.7 Mya, caused fluctuations in global sea level, thus affecting the evolution of tropical as well as temperate shallow water marine organisms.
One question germane to the interpretation of bio tic divergence across the Isthmus is whether the land barrier closed only once. That a possible land bridge existed between North and South America in the Paleogene has been suggested on biogeographic grounds (White 1986, Rage 1988).
However, the patterns of distribution of terrestrial groups that prompted the land bridge hypothe- sis can also be accommodated by the hypothesis that herald taxa crossed between the subcontinents by being ferried on islands during these tectonically active times, or by swimming (Webb 2006).
There is no unambiguous geological evidence that North and South America were connected by an uninterrupted land bridge since the time that they were both attached to Gondwana in the middle Mesozoic (Iturralde-Vinent & MacPhee 1999). There is evidence, however, of a breach of the Isthmus after its initial completion 3.1-2.8 Mya. A trend of decreasing salinity in two WA deep-sea cores, dated at 2 Mya, is interpreted by Cronin & Dowsett (1996) as evidence that EP waters may have spilled over the isthmus during a high sea level stand. This breach was short lived.
By 1.9 Mya salinity differences between the two oceans were restored.
Physical Environments on the Two Sides of the Isthmus
Today, shallow-water geminate species exist in physical environments that are quite different (reviews in Glynn 1972, 1982; Jackson & D'Croz 1997). From January to April, the low pressure region of the Intertropical Convergence Zone is situated to the South of Central America. The trade winds blowing from the North push surface waters away from the EP coast in places where the mountains are low, such as central Panama, the Gulf of Papagayo, and the Isthmus of Tehuantepec (Amador et al. 2006, Pennington et al. 2006). Cold, nutrient-rich water upwells into the euphoric zone to replace the displaced surface water. Temperature in the Bay of Panama can drop from 27°C to 15°C within 24 hours (Glynn 1972). Primary productivity in the EP increases dramatically during these periods, but also remains higher than that of the WA during the rest of the year (D'Croz & Robertson 1997, Pennington et al. 2006). The EP is also subject to El Nino Southern Oscillation (ENSO) fluctuations that disrupt upwelling (Glynn 1990, Kessler 2006), whereas the WA is only affected by the global climatic effects of this phenomenon (McPhaden et al. 2006).
Surface temperatures in the WA are higher than in the EP, leading to higher evaporation. Water vapor produced in the WA crosses over the Isthmus continental divide and flows into the EP, thus maintaining lower salinity (Benway & Mix 2004). The diurnal tidal range on the Pacific side of the Isthmus is as wide as 6 m, whereas on the Caribbean coast it is <0.5 m (Glynn 1972). In addition to being more variable in time, the EP physical environment is also more variable in space. Upwelling and its concomitant fluctuations in temperature, salinity, and primary productivity are limited to certain sections of the coast (D'Croz & O'Dea 2007). In the Caribbean, upwelling only occurs off small parts off the coasts of Colombia and Venezuela.
These environmental differences would be expected to affect the divergence of EP and WA biota, but only if they have been in place for sufficient time to influence their evolution. Microfossil and stable isotope evidence, as well as global climatic modeling, provide estimates of how long ago each of the existing differences came into being. By 4-3 Mya the thermocline in the EP was shallow, permitting upwelling to occur (Fedorov et al. 2006, Rickaby & Halloran 2005). Surface nutrients in the EP have been high for the last 5 My and steadily increasing since then (Cannariato
& Ravelo 1997). Pliocene and Pleistocene bivalve shells from the Bay of Panama show evidence of seasonal upwelling (Teranes et al. 1996). In the WA, however, primary productivity has declined
since the Pliocene (Allmon et al. 1996, Jain & Collins 2007). Seasonal changes in zooid size of cupuladriid bryozoans from the Atlantic coasts of Panama and Costa Rica indicate that intra-annual temperatures have fluctuated greatly between roughly 10 and 4 Mya, which O'Dea et al. (2007) attribute to seasonal upwelling. Between 4.25 and 3.45 Mya, this apparent seasonal!ty stopped.
Other differences between the physical environments of the two oceans appear to also have an ancient origin. Salinity was already different at 4.7—4.2 Mya (Keigwin 1982, Haug et al. 2001). Tidal ranges must have been large even in the late Pliocene EP, because it was open to the entire Pacific ocean, whereas in the Caribbean, with its spatially more variable bathymetry and narrow channels between islands (Iturralde-Vinent & MacPhee 1999), they must have been comparable to what they are today. Thus, populations on the two coasts of Central America have been experiencing different regimes of temperature, salinity, productivity, and seasonably for practically the entire time that they have been isolated by the Isthmus.
Biotic Environments on the Two Sides of the Isthmus
Partly owing to the physical differences, partly owing to historical contingency, but mostly for reasons we do not yet understand, the biotic environments on the two sides of the Isthmus are very different. The most prominent difference in shallow water is the absence in the EP of sea grass beds that are so common in the WA. Although Thalassia is listed as occurring in the Bay of Panama (Brasier 1975), the extensive communities formed by marine angiosperms (and all the organisms that are associated with them) have yet to be reported from anywhere in the EP (Jackson & D'Croz 1997). These angiosperms are thought to have invaded the Neotropics from the Indo-West Pacific in the Miocene, then to have virtually disappeared from the EP after the closure of the Isthmus (Brasier 1975).
Coral reefs are also very different in the WA and the EP (Cortes 1993, Glynn 1982). In the Caribbean, accreting reefs date back to the early Pleistocene, and a single reef system can cover hundreds of hectares. EP reefs are mostly composed of loose Pocillopora framework, do not date further back than the Holocene, and do not extend to more than a few hectares. WA reefs contain three times more species of corals and much more habitat diversity. Bioerosion is lower in the Caribbean than in the EP (Highsmith 1980).
Historical Diversity on the Two Sides of the Isthmus
Taxa with good fossil records indicate that any reconstruction of divergence across the Central American Isthmus should consider the possibility that modern-day patterns have been shaped by extinction. Pulses of extinction and species origination of molluscs and corals in the WA since the Pliocene are well documented, but the record from the EP is poorer. Gastropods and bivalves suffered a pulse of extinction in the Pleistocene (about 2 Mya) that was apparently more severe in the WA than in the EP (Stanley 1986, Todd et al. 2002, Vermeij 1978). However, extinction was balanced by species origination (Allmon et al. 1993; Jackson et al. 1993, 1996b). Scleractinian corals have also been undergoing major faunal turnovers on both sides of the Isthmus since the Pliocene (Budd 2000, Budd et al. 1996). The depauperate modern EP coral fauna may contain some taxa that have survived since the time it was united with the WA, but also bears the effects of major extinctions and possible reintroductions from the central Pacific after it was separated from the Caribbean (Budd 1989, Dana 1975). The diversification rate of benthic foraminifera in the Caribbean increased in the Miocene (L. Collins et al. 1996b), then again in the Pleistocene (L. Collins & Coates 1999); unfortunately there are as yet no equivalent data for this group from theER
66 Lessios
Although it is impossible to know exactly what happened in the past 3 My to taxa with poor fossil records, biogeographic patterns of extant species suggest that high rates of species turnover may not apply to all groups (Jackson & D'Croz 1997). For example, out of 20 genera of shallow water echinoids in the modern WA and 21 in the EP, 17 are represented in both regions (Chesher 1972), mostly by a single species on each side. The few described fossils in each of the two oceans are similar enough to modern forms to have been included into the extant species (review in Lessios 1998). This pattern would suggest that—unless each lineage extinction on one side was mirrored by the extinction of its sister lineage on the other—nearly every echinoid lineage isolated in each ocean by the Isthmus in the Pliocene has survived to recent times.
Extinctions are relevant to the study of divergence resulting from vicariance because they can cause the false appearance that extant sister species were separated contemporaneously with the barrier formation. The most insidious form of this false pattern occurs when two lineages already differentiated before the closure of the barrier leave behind one representative of each lineage on each side. Without fossil information, one will misconstrue the phylogeny of extant taxa as indicating that the surviving sister species, now one on each side of the barrier, coalesce at the barrier formation, when in fact they have coexisted as separate clades before that time (Knowlton
& Weigt 1998, Lessios 1998, Marko 2002). For taxa with poor fossil records, only molecular dating, based on a molecular clock assumption, can guard against this error.
Isolation Between Ocean Biota
Was the completion of the Isthmus the last barrier to isolate populations into their separate realms in the EP and the WA? Large, eurythermal, strong swimmers, such as whales, tuna, and large sharks, still have the potential of crossing between oceans at high latitudes. But what about shallow-water tropical organisms? The rise of the Isthmus would only keep biota from the Adantic and the Pacific from mingling if all other avenues of exchange were closed. One such potential path is around or across the American continent. The Bering Strait was opening at about the same time that the tropical Isthmus was closing, but as this was also the time of the initiation of Northern Hemisphere glaciations (Nof & Van Gorder 2003), it is unlikely that any tropical organism maintained contact through this connection. In the Southern Hemisphere, the Drake passage also cooled down in the mid-Pliocene 3.5-3.2 Mya (Hodell & Warnke 1991).
A new potential avenue of direct gene flow between the WA and the EP opened with the completion of the Panama Canal in 1914. Nine species of euryhaline fish are known to have crossed through the fresh water of the Canal, but only one is known to have established reproductive populations on the other side (McCosker & Dawson 1975, Rubinoff & Rubinoff 1969). Planktonic organisms and larvae of benthic or pelagic ones may be transiting the Isthmus through ballast water of ships (Chesher 1968). Fouling organisms riding on the hulls of ships may also have been transported. Mitochondrial DNA (mtDNA) haplotypes of Ophiactis savignyi in the Caribbean, identical to ones found in the western Pacific, have led Roy & Sponer (2002) to suggest that these sponge-dwelling brittle stars have been recently transported between oceans on ship hulls.
Connections between tropical organisms on the two sides of tropical America through a circum- global route is also a possibility. Global phylogeographies have produced evidence that genes of certain taxa have traveled around the world at some point in the last 3 My (Bowen et al. 2001, 2006; Lessios et al. 2001; Rocha et al. 2005). As the Tethyan Sea, connecting the Indian Ocean to the Atlantic, had become completely closed in the Middle Miocene (Steininger & Rogl 1984), these connections must have been maintained through the Benguela upwelling off Southwest Africa, and through the 5000-km stretch of deep water between the central and the eastern Pacific (the Eastern Pacific Barrier). The Benguela upwelling has been operating at least since the early
Pliocene, intensified at 3.2 Mya, but ameliorated and became intermittent at 2.0-1.4Mya (Marlow et al. 2000), thus permitting some species to cross. The Eastern Pacific Barrier has been in place for the entire Cenozoic (Grigg & Hey 1992) and accounts for the deepest cladogenic events in many taxa, but is also known to have been breached after the rise of the Isthmus by sea urchins (Lessios et al. 1996, 1998, 2003) and fish (Robertson et al. 2004, Lessios & Robertson 2006). Thus, for globally distributed genera it is not always safe to assume that their species on the two sides of the Isthmus were actually separated by the isthmian schism.
DIVERGENCE OF GEMINATE SPECIES Molecular Divergence
Molecular divergence has received more attention than any other aspect of differentiation across the Isthmus. The reason is that the relative constancy of rates of molecular evolution through time (the molecular clock hypothesis) permits dating of cladogenic events, information that is otherwise unavailable for organisms with poor fossil records. In order to date such events, a calibration of the rate of substitution in each DNA region is needed. Vicariant events can potentially provide such dates, and no vicariant event is better dated than the isthmian schism. Calibration of rates obtained from the Isthmus present the problem of uncertainty as to the elapsed interval from the point that clades had split to the point that is used to deduce a date—a problem also shared by fossils. One cannot be sure how much earlier than the final isthmian closure a particular pair of geminate clades has split, as one does not know how long after a taxon's appearance a fossil was formed. However, dating by a vicariant event has the advantage that divergence of many taxa from independent phylogenies can be used for the same calibration. Assuming that substitution rates of the same gene in closely related groups are similar, comparisons of divergence between species pairs with members on either side of a barrier can help determine which splitting events occurred simultaneously and are thus likely to be contemporaneous with the emergence of the barrier.
Thus, rates obtained from the geminate species of Panama are seen by molecular evolutionists as a means of obtaining a measure of the number of substitutions per unit time. As of January 2008, there have been 251 studies that used a calibration obtained from the isthmian schism to date phylogenetic events that have occurred elsewhere (list available from the author).
Based on the previous section regarding the slow rise of the Isthmus, the early diversion of currents, the possibility that, once completed, the Isthmus may have become breached, and the possibility of circumglobal genetic connections in some marine taxa, one might conclude that dating molecular phylogenies by calibrations obtained from the Isthmus is a hopeless exercise.
And yet, a compilation of divergence values in 115 geminate clades with members on the two sides of the Isthmus indicates that—even though there is ample reason for a cautious approach—there is hope that at least a rough measure of rates of molecular divergence can be gleaned.
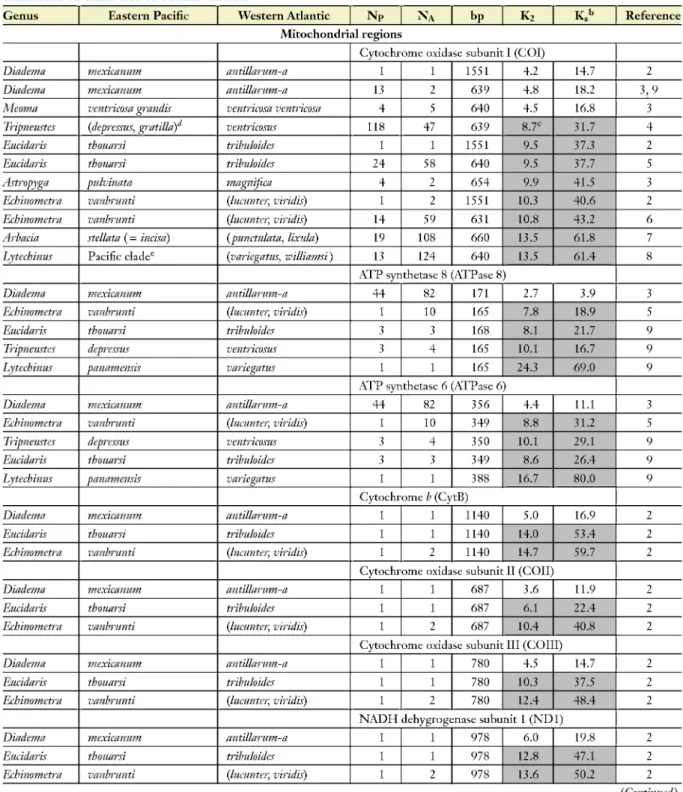
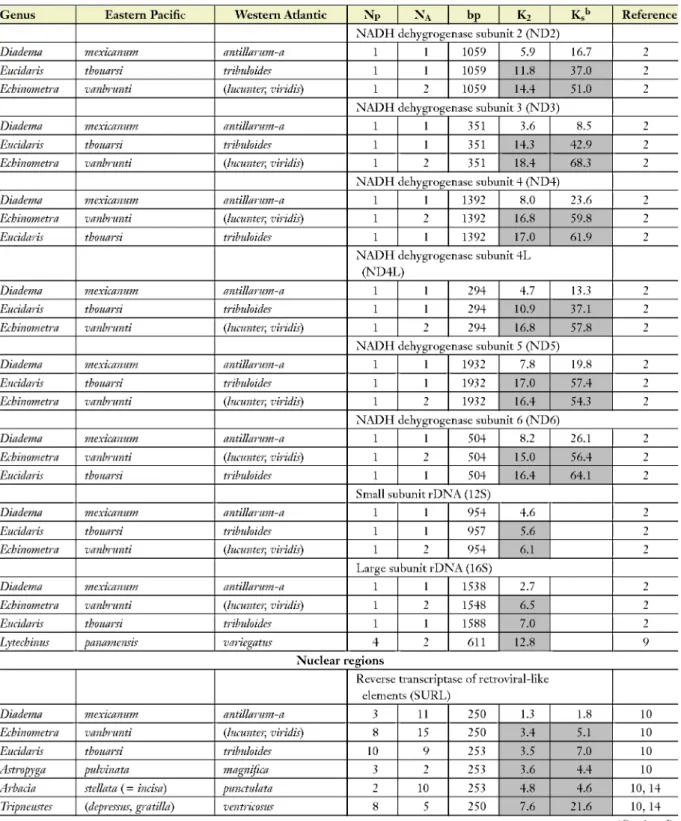
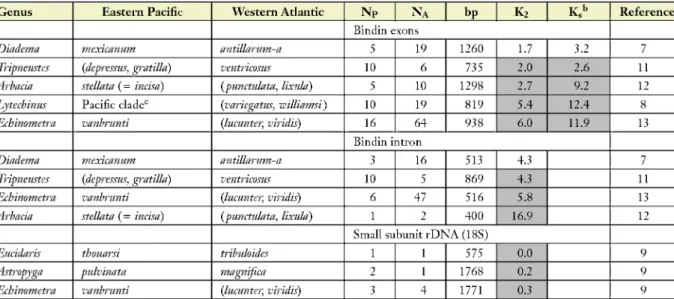
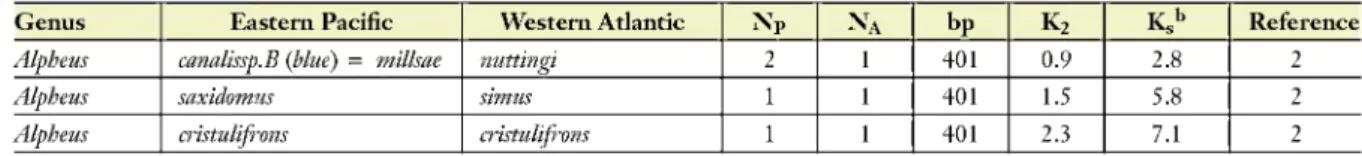
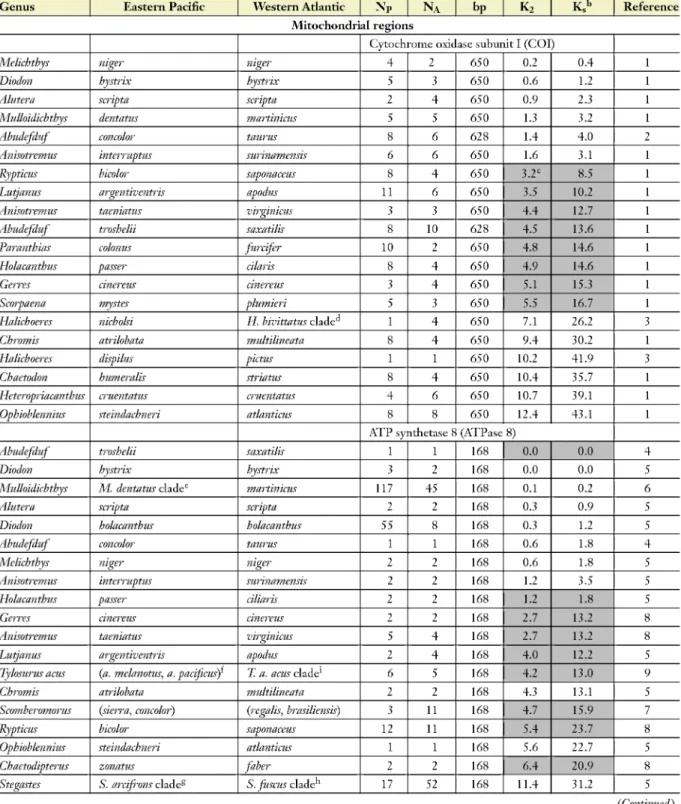
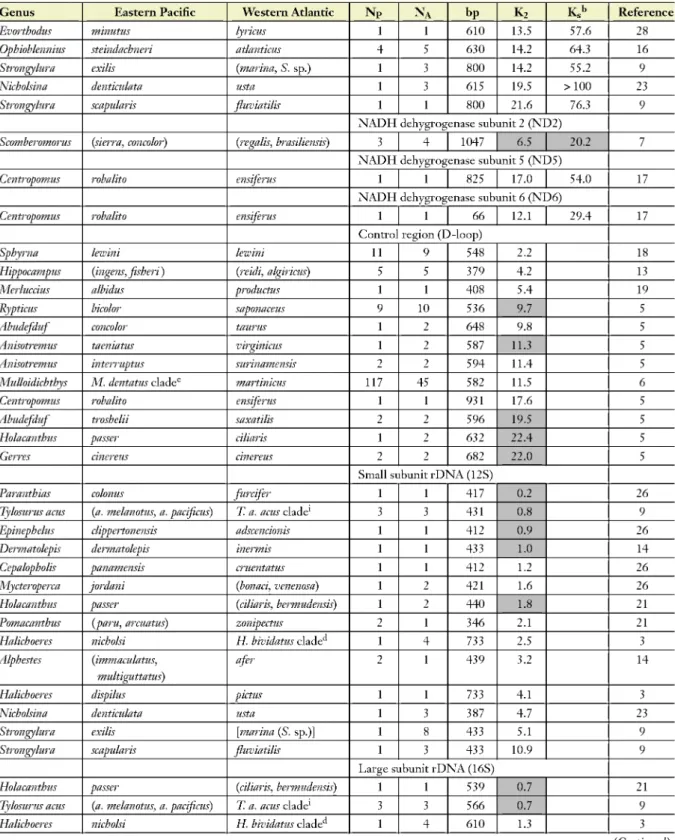
Measures of transisthmian molecular divergence in coding and noncoding DNA regions of five classes of animals are presented in Tables 1-4. The data come from studies, each of which used a model of DNA evolution most appropriate to their entire phylogeny, but I have retrieved the sequences from GenBank to calculate a single measure, Kimura's two-parameter distance, in order to preserve their compatibility. To assess the degree to which selection may affect the comparisons, I have also calculated the divergence of coding genes in silent sites, which is less likely to be adaptive.
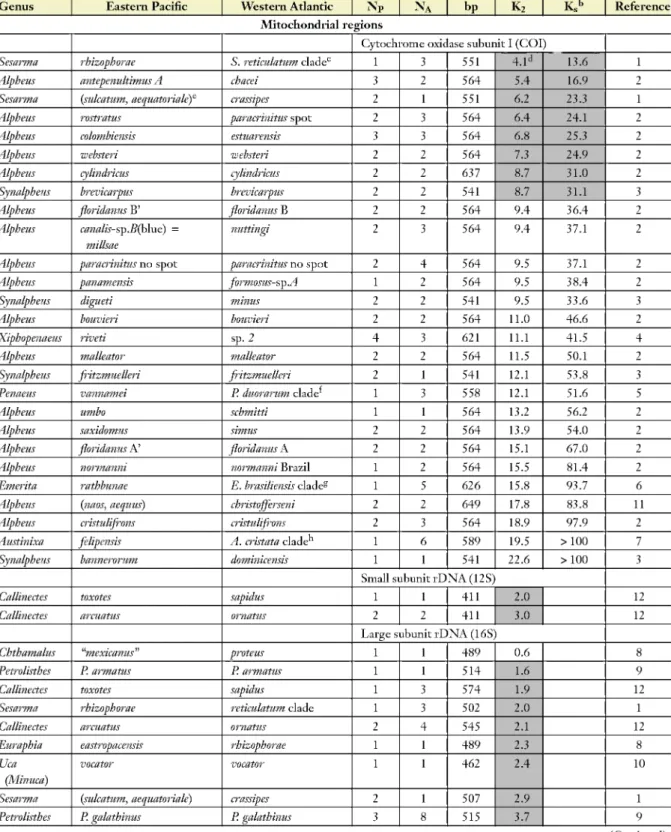
Explanations are needed for some of the values that appear in Tables 2 and 3. The transisthmian divergence values most often cited in the literature for calibrations of cytochrome oxidase subunit I (COI) are those obtained from alpheid shrimp by Knowlton & Weigt (1998), but some of the sequences used in that paper were subsequently shown by Williams & Knowlton (2001) to be
68 Lessios
Table 1 Mean Kimura two-parameter (K%) percent difference in all sites and in silent sites (Ks) between sister clades of Echinoidea on either side of Central America*1
Genus Eastern Pacific Western Atlantic NP NA bp K2 K.'' Reference
Mitochondrial regions
Cytochrome oxidase subunit I (COI)
Diadema mexicanum antillarum-a 1 1 1551 4.2 14.7 2
Diadema mexicanum antillarum-a 13 2 639 4.8 182 3,9
Meoma ventricosa grandis ventricosa ventricosa 4 5 640 4.5 16.8 3
Tripneustes (depressus, gratilla) ventrkosus 118 47 639 8.7= 31.7 4
Eucidaris thouarsi tribuloides 1 1 1551 9.5 37.3 2
Eucidaris thouarsi tribuloides 24 58 640 9.5 37.7 5
Astropyga pulvinata magnifica 4 2 654 9.9 41.5 3
Echinometra vanbrunti (lucunter, viridis) 1 2 1551 10.3 40.6 2
Echinometra vanbrunti (lucunter, viridis) 14 59 631 10.8 43.2 6
Arbacia stellata (= incisa) (punctulata, lixuld) 19 108 660 13.5 61.8 7
Lytechinus Pacific cladec {variegatus, williamsi) 13 124 640 13.5 61.4 8
ATP synthetase 8 (ATPase 8)
Diadema mexicanum antillarum-a 44 82 171 2.7 3.9 3
Echinometra vanbrunti {lucunter, viridis) 1 10 165 7.8 18.9 5
Eucidaris thouarsi tribuloides 3 3 168 8.1 21.7 9
Tripneustes depressus ventrkosus 3 4 165 10.1 16.7 9
Lytechinus panamensis variegatus 1 1 165 24.3 69.0 9
ATP synthetase 6 (ATPase 6)
Diadema mexicanum antillarum-a 44 82 356 4.4 11.1 3
Echinometra vanbrunti {lucunter, viridis) 1 10 349 8.8 31.2 5
Tripneustes depressus ventrkosus 3 4 350 10.1 29.1 9
Eucidaris thouarsi tribuloides 3 3 349 8.6 26.4 9
Lytechinus panamensis variegatus 1 1 388 16.7 80.0 9
Cytochrome b (CytB)
Diadema mexicanum antillarum-a 1 1 1140 5.0 16.9 2
Eucidaris thouarsi tribuloides 1 1 1140 14.0 53.4 2
Echinometra vanbrunti {lucunter, viridis) 1 2 1140 14.7 59.7 2
Cytochrome oxidase subunit II (COII)
Diadema mexicanum antillarum-a 1 1 687 3.6 11.9 2
Eucidaris thouarsi tribuloides 1 1 687 6.1 22.4 2
Echinometra vanbrunti {lucunter, viridis) 1 2 687 10.4 40.8 2
Cytochrome oxidase subunit III (COIII)
Diadema mexicanum antillarum-a 1 1 780 4.5 14.7 2
Eucidaris thouarsi tribuloides 1 1 780 10.3 37.5 2
Echinometra vanbrunti {lucunter, viridis) 1 2 780 12.4 48.4 2
NADH dehygrogenase subunit 1 (ND1)
Diadema mexicanum antillarum-a 1 1 978 6.0 19.8 2
Eucidaris thouarsi tribuloides 1 1 978 12.8 47.1 2
Echinometra vanbrunti {lucunter, viridis) 1 2 978 13.6 50.2 2
(Continued)
Table 1 (Continued)
Genus Eastern Pacific Western Atlantic NP NA bp K2 K.h Reference
NADH dehygrogenase subunit 2 (ND2)
Diadema mexicanum antillarum-a 1 1 1059 5.9 16.7 2
Eucidaris thouarsi tribuloides 1 1 1059 11.8 37.0 2
Echinometra vanbrunti {lucunter, viridis) 1 2 1059 14.4 51.0 2
NADH dehygrogenase subunit 3 (ND3)
Diadema mexicanum antillarum-a 1 1 351 3.6 8.5 2
Eucidaris thouarsi tribuloides 1 1 351 14.3 42.9 2
Echinometra vanbrunti {lucunter, viridis) 1 2 351 18.4 68.3 2
NADH dehygrogenase subunit 4 (ND4)
Diadema mexicanum antillarum-a 1 1 1392 8.0 23.6 2
Echinometra vanbrunti {lucunter, viridis) 1 2 1392 16.8 59.8 2
Eucidaris thouarsi tribuloides 1 1 1392 17.0 61.9 2
NADH dehygrogenase subunit 4L (ND4L)
Diadema •mexicanum antillarum-a 1 1 294 4.7 13.3 2
Eucidaris thouarsi tribuloides 1 1 294 10.9 37.1 2
Echinometra vanbrunti {lucunter, viridis) 1 2 294 16.8 57.8 2
NADH dehygrogenase subunit 5 (ND5)
Diadema •mexicanum antillarum-a 1 1 1932 7.8 19.8 2
Eucidaris thouarsi tribuloides 1 1 1932 17.0 57.4 2
Echinometra vanbrunti {lucunter, viridis) 1 2 1932 16.4 54.3 2
NADH dehygrogenase subunit 6 (ND6)
Diadema •mexicanum antillarum-a 1 1 504 8.2 26.1 2
Echinometra vanbrunti {lucunter, viridis) 1 2 504 15.0 56.4 2
Eucidaris thouarsi tribuloides 1 1 504 16.4 64.1 2
Small subunit rDNA (12S)
Diadema •mexicanum antillarum-a 1 1 954 4.6 2
Eucidaris thouarsi tribuloides 1 1 957 5.6 2
Echinometra vanbrunti {lucunter, viridis) 1 2 954 6.1 2
Large subunit rDNA (16S)
Diadema •mexicanum antillarum-a 1 1 1538 2.7 2
Echinometra vanbrunti {lucunter, viridis) 1 2 1548 6.5 2
Eucidaris thouarsi tribuloides 1 1 1588 7.0 2
Lytechinus panamensis variegatus 4 2 oil 12.8 9
Nuclear regions
Reverse transcriptase of retroviral-like elements (SURL)
Diadema •mexicanum antillarum-a 3 11 250 1.3 1.8 10
Echinometra vanbrunti {lucunter, viridis) 8 15 250 3.4 5.1 10
Eucidaris thouarsi tribuloides 10 9 253 3.5 7.0 10
Astropyga pulvinata magnifica 3 2 253 3.6 4.4 10
Arbacia stellata (= incisa) punctulata 2 10 253 4.8 4.6 10, 14
Tripneustes (depressus, gratilld) ventricosus 8 5 250 7.6 21.6 10, 14
{Continued)
7° Lessios
Table 1 (Continued)
Genus Eastern Pacific Western Atlantic NP NA bp K2 K.b Reference
Bindin exons
Hiadema mexicanum antillarum-a 5 19 1260 1.7 3.2 7
Tripneustes (depressus, gratilla) ventricosus 10 6 735 2.0 2.6 11
Arbacia stellata (= incisa) (punctulata, lixula) 5 10 1298 2.7 9.2 12
Lytechinus Pacific cladec (variegatus, williamsi) 10 19 819 5.4 12.4 8
Echinometra vanbrunti (lucunter, viridis) 16 64 938 6.0 11.9 13
Bindin intron
Hiadema mexicanum antillarum-a 3 16 513 4.3 7
Tripneustes (depressus, gratilla) ventricosus 10 5 869 4.3 11
Echinometra vanbrunti (lucunter, viridis) 6 47 516 5.8 13
Arbacia stellata (— incisa) (punctulata, lixula) 1 2 400 16.9 12
Small SVJ buniti-DNA(18S)
Eucidaris thouarsi tribuloides 1 1 575 0.0 9
Astropyga pulvinata magnifica 2 1 1768 0.2 9
Echinometra vanbrunti (lucunter, viridis) 3 4 1771 0.3 9
aFor fall citation information for the references in this table, see the Supplementary Literature Cited. (Follow the Supplemental Material link from the Annual Reviews home page at http://www.annualreviews.org.)
Legend: Np, number of sequences of Pacific clade; NA, number of sequences of Atlantic clade.
Divergence in silent sites estimated according to the method of Pamilo & Bianchi (1993).
^Shading indicates values of divergence assumed to have been initiated at the hnal closure of the Isthmus.
Parentheses are used to designate phylogenetic arangement of clades.
ePacihc clade of Lytechinus: [(pictus, anamcsus){sanhiiberculatus, panamensis)].
References: 2, Medina & Lessios, unpublished; 3, Lessios et al. 2001; 4, Lessios et al. 2003; 5, Lessios et al. 1999; 6, McCartney et al. 2000; 7, H. Lessios et al., unpublished data; 8, Zigler & Lessios 2004; 9, H. Lessios, unpublished; 10, Gonzalez & Lessios 1999; 11, Zigler & Lessios 2003; 12, Metz et al.
1998; 13, McCartney & Lessios 2004; 14, Springer et al. 1995.
pseudogenes. For this reason, the values in Table 2 are based on sequences from Williams et al.
(2001), which were mostly obtained from complementary DNA. The newer data have revised rate estimates somewhat, but they have not changed the main conclusions of Knowlton & Weigt (1998).
The same cannot be said for the conclusions of Bellwood et al. (2004) regarding transisthmian divergence in angelhsh (Table 3). Their rejection of a calibration based on the isthmus in favor of one obtained from fossils was based on an erroneous topology of Holacanthus, which showed the Adantic Holacanthus bermudensis as the geminate of the Pacific H. passer. A reanalysis of their sequences shows that the correct sister clade of H. passer is composed of both H. bermudensis and H. ciliaris; the split between the two Atlantic species occurred after the transisthmian divergence.
The revised rates for 12 S and 16S based on this topology agree well with that obtained from other species (Table 3) and with Bellwood el al.'s fossil estimates. Many of the other comparisons in Tables 1—4 are based on a single sequence from each side of the Isthmus and thus lack internal checks for possible species misidentifications, PCR artifacts, or the existence of pseudogenes.
Partial sequences of the same gene from different studies are not always from exacdy the same DNA region. The good agreement between divergence estimates obtained from the entire COI gene and from a 640-base pair (bp) segment of it in sea urchins (Table 1) suggests that this may not be introducing major artifacts in the comparisons.
Arrangement of geminate clades in ascending order of transisthmian divergence in each gene in Tables 1—4 facilitates comparisons of the degree to which relative differentiation across the Isthmus is the same in different genes. There is good correlation between K2 and K,, indicating
Table 2 Mean Kimura two-parameter (K2) percent difference in all sites and in silent sites (Ks) between sister clades of crustaceans on either side of Central America"
Genus Eastern Pacific Western Atlantic NP NA bP K2 K,b Reference
Mitochondrial regions
Cytochrome oxidase subunit I (COI)
Sesarma rhizophorae S. reticulatum cladec 1 3 551 4.1d 13.6 1
Alpheus antepenultimus A chacei 3 2 564 5.4 16.9 2
Sesarma (sulcatum, aequatoriaky crassipes 2 1 551 6.2 23.3 1
Alpheus rostratus paracrinitus spot 2 3 564 6.4 24.1 2
Alpheus colombiensis estuarensis 3 3 564 6.8 25.3 2
Alpheus wehsteri websteri 2 2 564 7.3 24.9 2
Alpheus cylindricus cylindricus 2 2 637 8.7 31.0 2
Synalpheus brevicarpus brevicarpus 2 2 541 8.7 31.1 3
Alpheus floridanus B' floridanus B 2 2 564 9.4 364 2
Alpheus canalis-sp.B(bhie) = millsae
nuttingi 2 3 564 9.4 37.1 2
Alpheus paracrinitus no spot paracrinitus no spot 2 4 564 9.5 37.1 2
Alpheus panamensis formosus-sp.A 1 2 564 9.5 384 2
Synalpheus digueti minus 2 2 541 9.5 33.6 3
Alpheus bouvieri bouvieri 2 2 564 11.0 46.6 2
Xiphopenaeus riveti sp. 2 4 3 621 11.1 41.5 4
Alpheus malleator malleator 2 2 564 11.5 50.1 2
Synalpheus fritzmuelleri fritzmuelleri 2 1 541 12.1 53.8 3
Penaeus vannamei P. duorarum clade 1 3 558 12.1 51.6 5
Alpheus umbo schmitti 1 1 564 13.2 56.2 2
Alpheus saxidomus simus 2 2 564 13.9 54.0 2
Alpheus floridanus A' floridanus A 2 2 564 15.1 674 2
Alpheus normanni normanni Brazil 1 2 564 15.5 81.4 2
Emerita rathbunae E. brasiliensis cladeg 1 5 626 15.8 93.7 6
Alpheus (naos, aequus) christofferseni 2 2 649 17.8 83.8 11
Alpheus cristulifrons cristulifrons 2 3 564 18.9 97.9 2
Austinixa felipensis A. cristata clade 1 6 589 19.5 >100 7
Synalpheus bannerorum dominicensis 1 1 541 22.6 >100 3
Small subunit rDNA (12S)
Callinectes toxotes sapidus 1 1 411 2.0 12
Callinectes arcuatus ornatus 2 2 411 3.0 12
Large subunit rDNA (16S)
Chthamalus "mexicanus" proteus 1 1 489 0.6 8
Petrolisthes P. armatus P. armatus 1 1 514 1.6 9
Callinectes toxotes sapidus 1 3 574 1.9 12
Sesarma rhizophorae reticulatum clade 1 3 502 2.0 1
Callinectes arcuatus ornatus 2 4 545 2.1 12
Euraphia eastropacensis rhizophorae 1 1 489 2.3 8
Uca (Minuca)
vocator vocator 1 1 462 2.4 10
Sesarma {sulcatum, aequatoriak) crassipes 2 1 507 2.9 1
Petrolisthes P. galathinus P. galathinus 3 8 515 3.7 9
{Continued) 72 Lessios
Table 2 (Continued)
Genus Eastern Pacific Western Atlantic NP NA bp K2 K.'' Reference
Petrolisthes tonsorius tonsorius 1 1 518 4.9 9
Synalpheus digueti minus 1 1 497 5.8 3
Petrolisthes glasselli rosariensis 1 4 514 6.7 9
Synalpheus brevkarpus brevkarpus 1 1 509 6.8 3
Synalpheus fritzmuelleri fritzmuelleri 1 1 507 8.2 3
Austinixa felipensis A. cristata clade 1 6 555 8.3 7
Petrolisthes (haigae, hirtispinosus) marginatus 2 2 515 11.2 9
Synalpheus bannerorum dominkensis 1 1 506 15.2 3
Nuclear regions
Glucose 6 phosphate isomerase (GPI)
Alpheus floridanus A' floridanus A 1 1 466 0.0 0.0 2
Alpheus floridanus B' floridanus B 1 1 466 0.0 0.0 2
Alpheus malleator malleator 1 1 466 0.2 0.0 2
Alpheus rostratus paracrinitus spot 2 1 466 0.4 1.3 2
Alpheus saxidomus simus 1 1 466 0.4 1.4 2
Alpheus panamensis formosus sp A 1 2 466 0.4 0.7 2
Alpheus bouvieri bouvieri 2 1 466 0.6 0.6 2
Alpheus antepenultimus chacei 2 1 466 0.6 0.7 2
Alpheus cylindricus cylindricus 1 1 466 0.6 1.3 2
Alpheus websteri websteri 1 1 466 0.6 1.3 2
Alpheus paracrinitus no spot paracrinitus no spot 2 2 466 0.7 2.2 2
Alpheus colombiensis estuarensis 2 2 466 1.0 0.0 2
Alpheus canalissp.B (blue) = millsae
nuttingi 2 2 466 1.1 1.6 2
Alpheus normanni normanni Brazil 1 1 466 1.5 7.8 2
Alpheus umbo schmitti 2 2 466 1.9 5.7 2
Alpheus cristulifrons cristulifrons 1 388 7.7 18.2 2
Elongation factor la (EF-la)
Alpheus websteri websteri 1 401 0.0 0.0 2
Alpheus umbo schmitti 2 401 0.1 0.7 2
Alpheus floridanus A' floridanus A 1 401 0.3 0.8 2
Alpheus rostratus paracrinitus spot 1 401 0.3 0.8 2
Alpheus colombiensis estuarensis 1 401 0.3 0.8 2
Alpheus panamensis formosus sp A 1 401 0.3 1.4 2
Alpheus normanni normanni Brazil 1 401 0.5 2.3 2
Alpheus paracrinitus no spot paracrinitus no spot 2 401 0.5 1.6 2
Alpheus malleator malleator 2 401 0.5 2.2 2
Alpheus antepenultimus chacei 2 401 0.6 2.3 2
Alpheus bouvieri bouvieri 1 401 0.8 0.8 2
Alpheus floridanus B' floridanus B 1 401 0.8 3.0 2
Alpheus cylindricus cylindricus 2 401 0.8 2.2 2
{Continued)
Table 2 (Continued)
Genus Eastern Pacific Western Atlantic NP NA bp K2 K,b Reference
Alpheus canalissp.B (blue) = milkae nuttingi 2 1 401 0.9 2.8 2
Alpheus saxidomus simus 1 1 401 1.5 5.8 2
Alpheus cristulifrons cristulifrons 1 1 401 2.3 7.1 2
aFor full citation information for the references in this table, see the Supplementary Literature Cited. Legend: Np, number of sequences of Pacific clade; NA, number of sequences of Atlantic clade.
Divergence in silent sites estimated according to the method of Pamilo & Bianchi (1993).
CS. retiadatum clade: (retimlatum, sp nr. reticulatum, curacaoense).
Shading indicates values of divergence assumed to have been initiated at the final closure of the Isthmus.
^Parentheses are used to designate phylogenetic arangement of clades.
P. duoramm clade: \duorarwm (pmdensis, setiferus)].
gE. brasiliensis clade: brasiliensis (benedicti, talpoida)].
A. cristata clade: cristata {[cbacei, behreae]\gorei (hardyi, aidae)]}.* Rose* Add 4'-level brackets
References: 1, Schubart et al. 1998; 2, Williams et al. 2001; 3, Morrison et al. 2004; 4, Gusmao et al. 2006; 5, Baldwin et al. 1998; 6, Haye et al. 2002; 7, Harrison 2004; 8, Wares 2001; 9, Hiller et al. 2006; 10, Strumbauer et al. 1996; 11, Anker et al. 2007; 12, Robles et al. 2007.
that differences between divergence values of different geminate clades are not due to selective constraints on a gene of a particular species pair. Nuclear genes clearly do not diverge at a fast enough rate to provide information on variation between transisthmian divergences. Relative divergences in different mitochondrial DNA regions would be expected to agree with each other because of lack of recombination, which would cause the coalescence process to affect them in the same manner. They generally do, but some regions stand out as exceptions. These are 16S in crustaceans and ATPaseS, 12S and D-loop in fish. What do the rest of the data have to tell us regarding the question of how separation by the isthmus affected different geminate clades?
Early studies of isozyme divergence across the Isthmus took for granted that geminate species were isolated at roughly the same time and sought explanations for the variation in the amount of divergence observed between geminate pairs (e.g., Bermingham & Lessios 1993; Lessios 1979, 1981; Vawter et al. 1980). Examination of Tables 1-4, however, shows that if there is any regularity to molecular evolution, then sister species on each side of the Isthmus were most likely isolated from each other during different time intervals, even in cases in which morphological divergence would suggest otherwise (such as the fish Heteropriacanthus, Table 3). The challenge, both for the sake of understanding the history of WA and EP biota and for calibrating molecular clocks, is to determine which species were separated at each time interval. This is a question with two components:
(a) Which species were separated at the same time? And (b) which cluster of divergence values represents separation by the Isthmus completion?
The difficulty with the first question lies in deciding how much of the variation in transisthmian divergence is due to different times since separation, and how much due to other factors, such as different effective population sizes, different mutation rates, or different modes and intensities of selection. Hickerson et al. (2006) devised an approximate Bayesian computation method for taking into account variation owing to stochasticity in the coalescence and mutational processes in answering this question. Applying this method to COI divergence between WA and EP members of sea urchin geminate pairs (Table 1), Hickerson et al. concluded that the null hypothesis of simultaneous separation could not be rejected for most transisthmian pairs of species. The ex- ception was the pair that consists of Diadema antillarum and D. mexicanum. By this analysis, they have become isolated more recently, a conclusion also supported by the worldwide phylogeny of the genus (Lessios et al. 2001), which shows a close relationship between Atlantic and Indian Ocean populations. A statistical analysis of the rest of the data listed in Tables 1-4 is complicated by small intraspecific sample sizes in most of the transisthmian comparisons. Nevertheless, the
A Lessios
Table 3 Mean Kimura two-parameter (K2) percent difference in all sites and in silent sites (Kg) between sister clades of fishes on either side of Central America
Genus Eastern Pacific Western Atlantic NP NA bp K2 K.t Reference
Mitochondrial regions
Cytochrome oxidase subunit I (COI)
Melichthys niger niger 4 2 650 0.2 0.4 1
Diodon hystrix hystrix 5 3 650 0.6 1.2 1
Alutera scripta scripta 2 4 650 0.9 2.3 1
Mulloidichthys dentatus martinicus 5 5 650 1.3 3.2 1
Abudefduf concolor taurus 8 6 628 1.4 4.0 2
Anisotremus interruptus surinamensis 6 6 650 1.6 3.1 1
Rypticus bicolor saponaceus 8 4 650 3.2C 8.5 1
Lutjanus argentiventris apodus 11 6 650 3.5 10.2 1
Anisotremus taeniatus virginicus 3 3 650 4.4 12.7 1
Abudefduf troshelii saxatilis 8 10 628 4.5 13.6 1
Paranthias colonus furcifer 10 2 650 4.8 14.6 1
Holacanthus passer cilaris 8 4 650 4.9 14.6 1
Gerres cinereus cinereus 3 4 650 5.1 15.3 1
Scorpaena mystes plumieri 5 3 650 5.5 16.7 1
Halichoeres nicholsi H. bivittatus clade 1 4 650 7.1 26.2 3
Chromis atrilobata multilineata 8 4 650 9.4 30.2 1
Halichoeres dispilus pictus 1 1 650 10.2 41.9 3
Chaetodon humeralis striatus 8 4 650 10.4 35.7 1
Heteropriacanthus cruentatus cruentatus 4 6 650 10.7 39.1 1
Ophioblennius steindachneri atlanticus 8 8 650 12.4 43.1 1
ATP synthetase 8 (ATPase 8)
Abudefduf troshelii saxatilis 1 1 168 0.0 0.0 4
Diodon hystrix hystrix 3 2 168 0.0 0.0 5
Mulloidichthys M. dentatus cladee martinicus 117 45 168 0.1 0.2 6
Alutera scripta scripta 2 2 168 0.3 0.9 5
Diodon holacanthus holacanthus 55 8 168 0.3 1.2 5
Abudefduf concolor taurus 1 1 168 0.6 1.8 4
Melichthys niger niger 2 2 168 0.6 1.8 5
Anisotremus interruptus surinamensis 2 2 168 1.2 3.5 5
Holacanthus passer ciliaris 2 2 168 1.2 1.8 5
Gerres cinereus cinereus 2 2 168 2.7 13.2 8
Anisotremus taeniatus virginicus 5 4 168 2.7 13.2 8
Lutjanus argentiventris apodus 2 4 168 4.0 12.2 5
Tylosurus acus (a. melanotus, a. pacificus) T. a. acus clade1 6 5 168 4.2 13.0 9
Chromis atrilobata multilineata 2 2 168 4.3 13.1 5
Scomberomorus (sierra, concolor) (regalis, brasiliensis) 3 11 168 4.7 15.9 7
Rypticus bicolor saponaceus 12 11 168 5.4 23.7 8
Ophioblennius steindachneri atlanticus 1 1 168 5.6 22.7 5
Chaetodipterus zonatus fiber 2 2 168 6.4 20.9 8
Stegastes S. arcifrons cladeg S. fuscus clade 17 52 168 11.4 31.2 5
(Continued)
Table 3 (Continued)
Genus Eastern Pacific Western Atlantic NP NA bp K2 K.h Reference
Chaetodon humeralis striatus 2 2 168 14.0 45.0 5
Strongylura scapularis fluviatilis 1 2 168 15.6 31.6 9
Paranthias colonus furcifer 4 3 168 19.6 19.1 5
Strongylura exilis [marina (S. sp.)] 2 10 168 20.0 44.4 9
Heteropriacanthus cruentatus cruentatus 32 77 168 25.2 57.9 6
ATP synthetase 6 (ATPase 6)
Diodon hystrix hystrix 3 2 684 0.0 0.0 5
Alutera scripta scripta 2 2 684 0.1 1.9 5
Melichthys niger niger 2 2 684 0.4 1.0 5
Diodon holacanthus holacanthus 55 8 684 0.6 1.4 5
Mulloidichthys M. dentatus cladee martinicus 117 45 684 0.7 2.0 6
Abudcfduf concolor taurus 1 1 684 1.6 4.8 4
Anisotremus interruptus surinamensis 2 2 684 1.9 5.5 5
Chaetodipterus zonatus faber 2 2 684 3.0 8.3 8
Anisotremus taeniatus virginicus 3 2 684 3.8 10.8 8
Gerres cinereus cinereus 2 2 684 3.9 12.1 8
Abudcfduf troshelii saxatilis 1 1 684 4.3 12.3 4
Rypticus bicolor saponaccus 12 11 684 4.6 11.4 8
Tylosurus acus (a. melanotus, a. pacificus) T. a. acus clade1 6 5 684 5.7 16.9 9
Holacanthus passer ciliaris 2 2 684 5.8 13.6 5
Paranthias colonus furcifer 4 3 684 6.7 14.3 5
Lutjanus argentiventris apodus 2 4 684 6.8 20.4 5
Scomberomorus (sien'a, concolor) (regalis, brasiliensis) 3 11 684 6.9 21.1 7
Stegastes S. arcifrons cladeg S. fuscus clade 17 52 687 11.9 41.1 6
Ophioblennius steindachneri atlanticus 1 1 684 12.7 54.1 5
Strongylura exilis (marina S. sp.) 2 10 684 14.6 45.2 9
Chromis atrilobata multilineata 2 2 684 15.4 51.7 5
Chaetodon humeralis striatus 2 2 684 16.0 55.5 5
Strongylura scapularis fluviatilis 1 2 684 16.6 55.4 9
Heteropriacanthus cruentatus cruentatus 32 77 684 20.9 65.8 6
Cytochrome /; (CytB)
Abudcfduf concolor taurus 1 1 1140 1.7 4.8 4
Anisotremus interruptus surinamensis 8 5 692 2.0 6.2 10
Anisotremus taeniatus virginicus 8 15 692 3.3 9.6 10
Sphyrna tiburo tiburo 1 1 1146 3.5 10.3 11
Rypticus bicolor saponaceus 2 2 790 3.6 11.6 12
Tylosurus acus (a. melanotus, a. pacificus) T. a. acus clade1 3 3 800 4.4 13.6 9
Abudcfduf troshelii saxatilis 1 1 1140 4.8 15.7 4
Hippocampus (ingens, fisheri) (reidi, algiricus) 6 4 718 5.1 15.5 13
Alphestes (immaculatus, multigutattus)
afer 2 1 491 7.2 28.1 14
Dermatolepis dermatolepis inermis 1 1 437 8.2 24.5 14
Chromis atrilobata multilineata 4 2 616 9.9 37.8 15
{Continued)
76 Lessios
Table 3 (Continued)
Genus Eastern Pacific Western Atlantic NP NA bp K2 K.b Reference
Evorthodus minutus lyricus 1 1 610 13.5 57.6 28
Ophiobknnius steindachneri atlantkus 4 5 630 14.2 64.3 16
Strongylura exilis (marina, S. sp.) 1 3 800 14.2 55.2 9
Nicholsina dentkulata usta 1 3 615 19.5 >100 23
Strongylura scapularis fluviatilis 1 1 800 21.6 76.3 9
NADH dehygrogenase sub unit 2 (ND2)
Scomberomorus (sietTa, concolor) (regalis, brasiliensis) 3 4 1047 6.5 20.2 7
NADH dehygrogenase sub unit 5 (NO 5)
Centropomus robalito ensiferus 1 1 825 17.0 54.0 17
NADH dehygrogenase sub unit 6 (ND6)
Centropomus robalito ensiferus 1 1 66 12.1 294 17
Control region (D-loop)
Sphyrna lewini lewini 11 9 548 2.2 18
Hippocampus (ingens, fisheri) (reidi, algirkus) 5 5 379 4.2 13
Merluccius albidus productus 1 1 408 5.4 19
Ryptkus bicolor saponaceus 9 10 536 9.7 5
Abudefduf concolor taurus 1 2 648 9.8 5
Anisotremus taeniatus virginicus 1 2 587 11.3 5
Anisotremus interruptus surinamensis 2 2 594 11.4 5
Mulloidichthys M. dentatus cladee martinkus 117 45 582 11.5 6
Centropomus robalito ensiferus 1 1 931 17.6 5
Abudefduf troshelii saxatilis 2 2 596 19.5 5
Holacanthus passer ciliaris 1 2 632 224 5
Gerres cinereus cinereus 2 2 682 224 5
Small subunit rDNA (12S)
Paranthias colonus furcifer 1 1 417 0.2 26
Tylosurus acus (a. melanotus, a. pacificus) T. a. acus clade1 3 3 431 0.8 9
Epinephclus clippertonensis adscencionis 1 1 412 0.9 26
Dermatolepis dermatolepis inermis 1 1 433 1.0 14
Ccpalopholis panamensis cruentatus 1 1 412 1.2 26
Mycteroperca jordani (bonaci, venenosa) 1 2 421 1.6 26
Holacanthus passer (ciliaris, bermudensis) 1 2 440 1.8 21
Pomacanthus (paru, arcuatus) zonipectus 2 1 346 2.1 21
Halichoeres nicholsi H bividatus clade 1 4 733 2.5 3
Alphestes (immaculatus, multiguttatus)
afer 2 1 439 3.2 14
Halichoeres dispilus pictus 1 1 733 4.1 3
Nicholsina dentkulata usta 1 3 387 4.7 23
Strongylura exilis \marina (S. sp.)] 1 8 433 5.1 9
Strongylura scapularis fluviatilis 1 3 433 10.9 9
Large subunit rDNA (16S)
Holacanthus passer (ciliaris, bermudensis) 1 1 539 0.7 21
Tylosurus acus (a. melanotus, a. pacificus) T. a. acus clade1 3 3 566 0.7 9
Halichoeres nicholsi H bividatus clade 1 4 610 1.3 3
(Continued)
Table 3 (Continued)
Genus Eastern Pacific Western Atlantic NP NA bp K2 K,b Reference
Halichoeres dispilus pictus 1 1 610 1.5 3
Centropomus medius pectinatus 1 1 647 1.6 20
Chromis atrilobata multilineata 4 2 539 1.7 15
Dermatokpis dermatokpis inermis 1 1 600 1.7 14
Hippocampus (ingens, fisheri) (reidi, algiricus) 6 4 527 1.9 13
Paranthias colonus furcifer 1 1 578 2.1 26
Mycteroperca jordani (bonaci, venenosa) 1 28 610 2.2 26,27
Alphestes (immaculatus, multiguttatus) afer 2 1 603 2.3 14
Epinephelus (clippertonensis, labriformis) adscencionis 2 1 565 2.6 26
Cephalopholis panamensis cruentatus 1 1 590 2.6 26
Centropomus robalito ensiferus 1 1 647 2.7 20
Pomacanthus (paru, arcuatus) zonipectus 2 1 549 2.9 21
Centropomus poeyi undecimalis 1 1 647 5.3 20
Nicholsina denticulata usta 1 3 551 5.4 23-25
Strongylura exilis (marina S. sp.) 1 3 565 8.2 9
Strongylura scapularis fluviatilis 1 1 565 11.2 9
Nuclear regions
Histone subunit 3 (H3)
Epinephelus (clippertonensis, labriformis) adscencionis 2 1 348 0.3