Adhesion of polymer binder to the filler material (fabrics, fibers, dispersed particles) is one of the important factors influencing the strength properties of polymer composites. Thousands of new reagents aimed at solving this problem appear annually in the world.
Lamination of Nanofiber Web into Nanostructured Fabric
K. Haghi *
Introduction
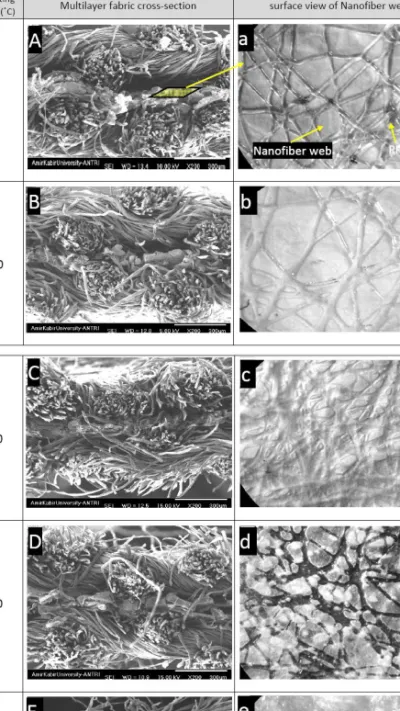
7], without disclosing lamination details, reported that the hot melt method is more suitable for nanofiber web lamination. Multilayer fabrics were made by laminating nanofiber web into cotton fabric via hot melt method at different temperatures.
Results and Discussion
Therefore, we can conclude that the adhesive layer as a barrier resists convective airflow during the experiment and ultimately reduces the air permeability of multilayer fabric depending on the decrease in pore size. In addition, we only observed that interlayer tack improved as temperature increased.
Conclusion
Before the melting point, the improvement in adhesive strength with increasing temperature is attributed to both the greater penetration of the adhesive into the layers and the expansion of the bonding area between them, as already discussed. Also at the melting point, the deep penetration of the adhesive into the mesh/fabric leads to an increase in this strength.
For example, the samples laminated at 85ºC showed very poor adhesion between the nanofiber web and the fabrics as they could be delaminated by light abrasion of the thumb. In general, it is essential that no delamination occurs during the use of this multilayer fabric, as the nanofiber web could be destroyed due to abrasion of the fabric layer.
Carbon Nanotube/Chitosan Nanocomposite
- Introduction
- Biopolymers
- Carbon Nanotubes
- Chitosan/Carbon Nanotube Composites
Umar Khan et al., in 2007, investigated the effect of solvent choice on the mechanical properties of CNTs-polymer composites. This work shows that the choice of solvents can have a dramatic effect on the mechanical properties of CNTs polymer composites [90].
CNTs/CS composite applications
Properties and Characterization
Due to the MWNT hollow nanochannel located between the pore network of the chitosan membrane, the water transport results for CSP6K are improved when the MWNT content is above the critical content. The pH value of the system was increased with ammonia solution to make chitosan insoluble in the aqueous medium.
Nucleophilic Substitution Reaction
Grafting reactions were accomplished by purging with N2 and warming to 98 oC CNTs/CS solution. Researchers [146] compared the mechanical properties and water stability of CNTs-grafted CS with the ungrafted CNTs.
Layer-by-Layer Self Assembly
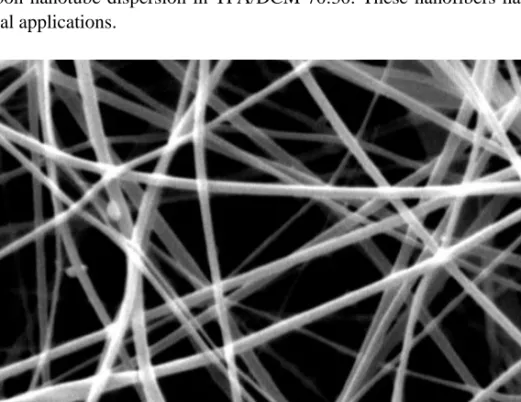
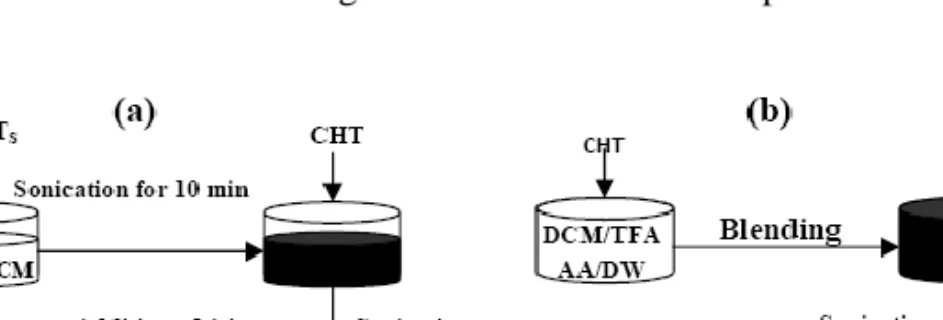
In our experimental studies, various solvents, including acetic acid 1-90%, formic acid, and trifluoroacetic acid TFA/DCM, were tested for electrospinning chitosan/carbon nanotubes. The TFA/DCM (70:30) solvent was the only solvent that resulted in the electrospinnability of chitosan/carbon nanotubes.
Electrospun Biodegradable Nanofibers
Effect of Systematic Parameters on Electrospun Nanofibers
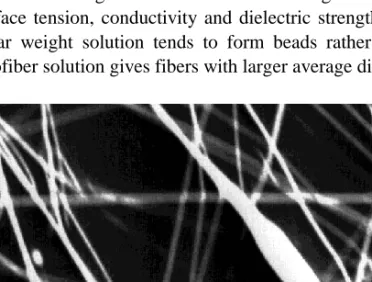
As the electrical conductivity of the solution increases, the diameter of the electrospun nanofibers decreases significantly. This increase in charge density due to Coulomb repulsion overcomes the surface tension of the droplet and.
Experimental
Result and Discussion
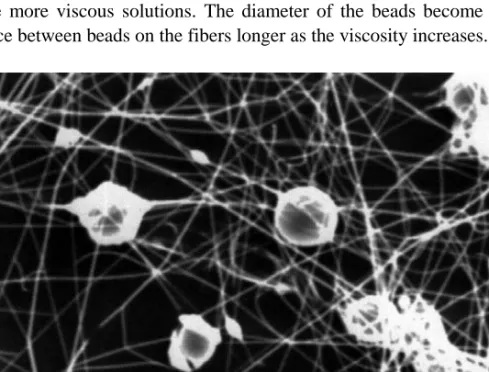
In fact, as the PANi ratio was increased, the fiber diameter decreased, as can be clearly seen from the results indicated in Table 2. The addition of salts to polymer solutions has been shown to increase the resulting net charge density of the electrospinning beam. The surface tension of the polymer solution also influences the resulting fiber morphology because large surface tensions promote the formation of polymer droplets.
Drug Delivery Systems Based on Chitosan Nanoparticles
R. Saboktakin
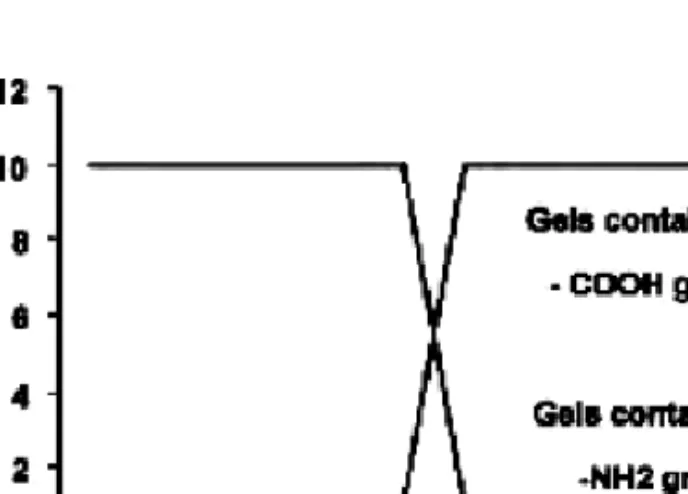
The existence of polar functional groups such as carboxylic acid are not only necessary for bioadhesive properties, but also for the pH-sensitive properties of the polymer (Ratner, 1989; Thierry, Winnik, Mehri, & Tabrizian, 2003), because the increase in MAA content in the hydrogels giving more hydrogen bonds at low pH and more electrostatic repulsion at high pH. It is part of our chitosan modification research program to produce materials with pH-sensitive properties for use as drug delivery (Mahfouz, Hamm, & Taupitz, 1997; Schmitz et al., 2000; Bloembergen & Pershan, 1967).
Materials and Methods
To study the molecular properties of paclitaxel and chitosan-PMAA, solid state characterization was performed using thermal, X-ray diffraction and microscopy techniques. During these studies, the solid properties of paclitaxel and chitosan-PMAA were compared with those of nanoparticles to reveal any changes that occur as a result of nanoparticle preparation. The molecular arrangement of paclitaxel and chitosan-PMAA in powder and in nanoparticles was compared using powder X-ray diffraction patterns obtained at room temperature on a Philips PW 1729 diffractometer (Eindhoven, The Netherlands) using CuK radiation.
Results
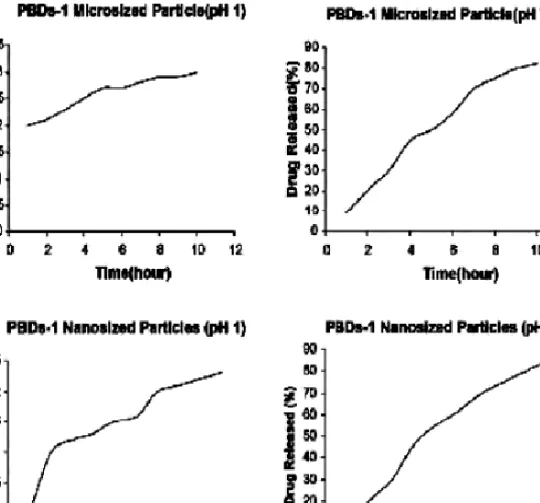
Powder samples of paclitaxel and beads were mounted on aluminum stubs using double-sided adhesive tape and then sputter coated with a thin layer of gold at a vacuum of 10 Torr before testing. The hydrolyzate sample was analyzed with a UV spectrophotometer and the amount of paclitaxel was determined using a standard calibration curve obtained under the same conditions (Fig. 3). Release of the drug paclitaxel from micro- and nanopolymeric carriers as a function of time at 37C.
Discussion
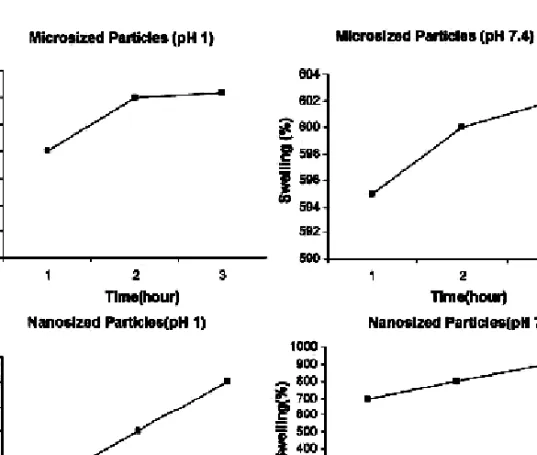
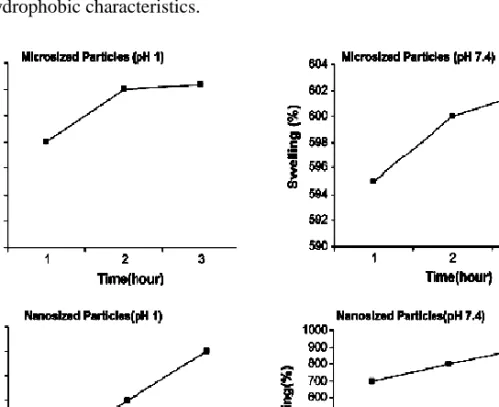
The swelling and hydrolytic behavior of the hydrogel beads was dependent on the content of MAA groups and caused a decrease in gel swelling in SGF or an increase in gel swelling in SIF. The swelling of the hydrogels was dependent on the content of MAA groups and caused a decrease in gel swelling in SGF or an increase in gel swelling in SIF. The swelling ratios of the hydrogel beads increased at pH 7.4 but decreased at pH 1 with increasing incorporation of MAA.
Materials and Methods
The compositions A-1 to A-6 were used to investigate the effect of nano-SiO2 in the substitution of cement in mortar and to find the optimum content of nano-SiO2 in cement mortar. The compositions A-7 to A-10 were made to study the effect of nano-SiO2 particles on the properties of cement mortar containing RHA. The water/binder ratio for all mixes was 0.5, where the binder weight is the total weight of cement, RHA and nano-SiO2.
Results and Discussion
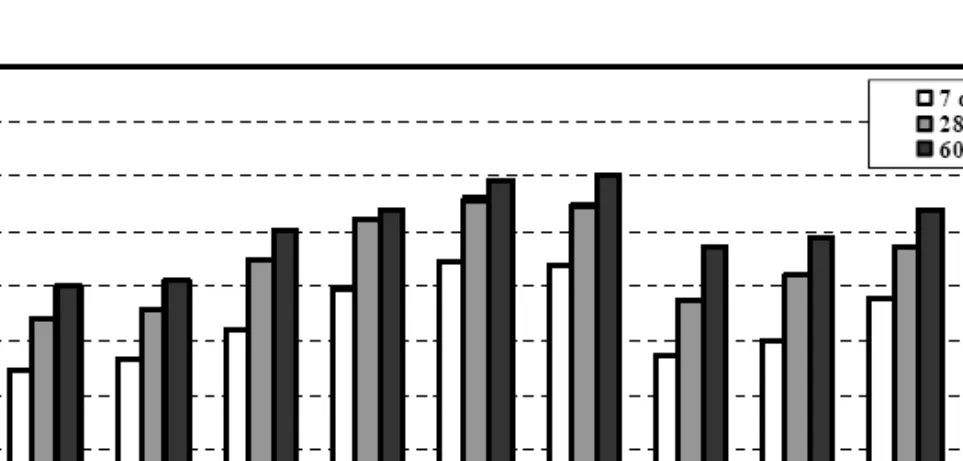
Compressive strength of ordinary and RHA cement mortar at different nano-SiO2 contents. Flexural strength of ordinary and RHA cement mortar at different nano-SiO2 contents. Compressive and flexural strength of RHA cement mortars improved by incorporation of nano-SiO2.
Free Vibration Analysis of
Double-Walled Carbon Nanotubes
Ansari, Rajabiehfard and B. Arash
- Governing Equations for CNTs
The profound effects of the small length scale on the eigenfrequencies of CNTs can be seen in the figure. Effect of a small length scale on the ratio of natural frequencies for double-walled CNTs with different length-to-innermost radii. Effect of a small length scale on the frequency ratios corresponding to different fundamental moduli for double-walled CNTs with all edges simply supported.
Appendix
29] Kuang Y D, He X Q, Chen C Y, Li G Q 2009 Nonlinear vibration analysis of liquid-carrying double-walled carbon nanotubes. 44] Heireche H, Tounsi A, Benzair A 2008 Volume effect on wave propagation of double-walled carbon nanotubes under initial axial load. 51] Wang Q, Varadan V K 2007 Application of nonlocal elastic shell theory to the analysis of wave propagation in carbon nanotubes.
Local Delivery Systems based on Biodegradable Chitosan Beads
In the freeze-drying process, the products are dried by a sublimation of the water component in an ice solution. The swelling properties of the ionic hydrogels are unique due to the ionization of their pendant functional groups. The swelling and hydrolytic behavior of the hydrogel beads was dependent on the content of MAA groups and caused a decrease in gel swelling in SGF or an increase in gel swelling in SIF.
Molecular Dynamics Simulation in Modeling Carbon Nanotubes
Ansari and B. Motevalli
- Empirical Potentials
- Algorithms of Performing an MD code
In addition, the calculation of the interaction potential force from the potential energy function is shown in detail. Since the Brenner potential function is successfully used in the modeling of carbon nanotubes, this potential is used in this chapter of the book in the loops of the MD code. As a function of the potential energy and the position vectors of the atoms, the forces acting on each individual atom are calculated as explained in the previous section.
Conductive Nanofiber
Experimental
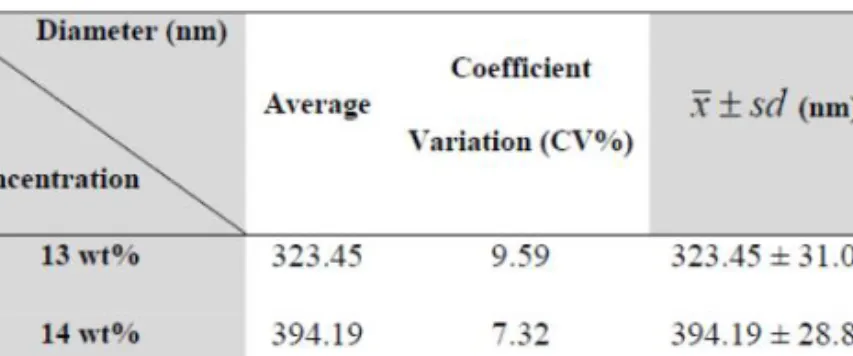
MWNTs bundled in sample 1 (different approach but same sonication time compared to sample 2) show a range of hydrodynamic diameters between 20-100 nm. Figure 4). The lower range of hydrodynamic diameters for sample 1 correlates with more exfoliated and highly stable nanotube strands in CHT solution. Our assessments indicate that the fiber diameter of CHT/MWNTs increases with increasing CHT concentration. Various solvents including acetic acid 1-90%, formic acid and TFA/DCM (70:30) were investigated in the electrospinning of CHT/MWNTs dispersion.
Achievements in Production of PAN Monofilament in Nanoscale
Background
- FTIR
The aligned attractors were twisted into yarns and the mechanical properties of the yarns were determined as a function of twist angle. The nanofiber is mounted on the stage of the Raman microscope so that the incident laser enters along the x-axis. Demonstration of the coordination of the molecular chain (xyz) in the nanofiber (XYZ coordinates) and the arrangement of the nanofiber in the reference frame of the Raman sample phase (x‘y‘z coordinates).
Results and Discussion
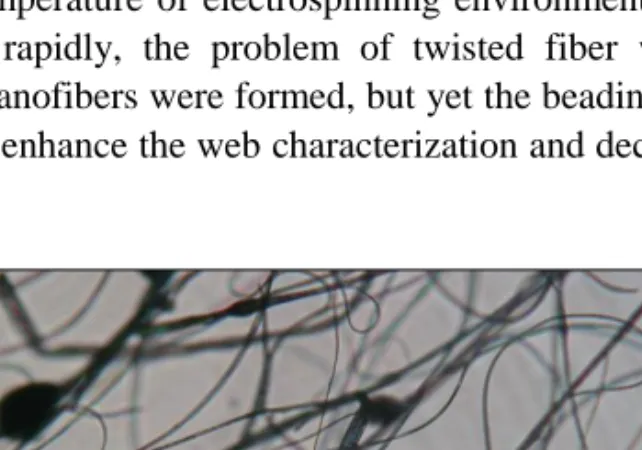
Optical micrograph of electrospun PAN nanofibers with corresponding normalized APS at take-up speed (a) 22.5 m/min; (b) 59.5 m/min. The crystallization index (A1730/A2240) was calculated from the FTIR spectra of PAN nanofibers collected at different acquisition speeds from 22.5 m/min to 67.7 m/min under optimal conditions. Therefore, the use of the above uptake rates may be suitable for heat treatment of PAN nanofibers.
Supreme EMI Shielding Using Electro-less Plating of Metallic
Nanoparticle on Cotton Fabric
- Fabric Tensile Strength and Elongation
- Color Change Assessment
- Surface Morphology
- Shielding Effectiveness
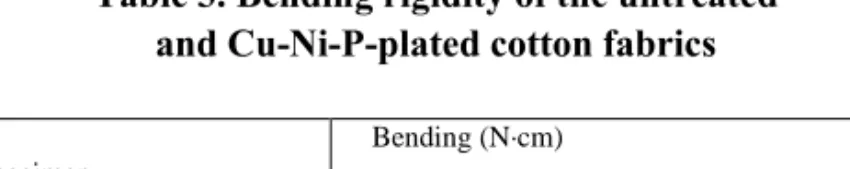
The area of each sample is 100 cm2. The electroless copper plating process was carried out with multi-step processes: pre-cleaning, sensitization, activation, electroless deposition of Cu-Ni-P alloy and post-treatment. The flexural stiffness of untreated cotton and Cu-Ni-P coated cotton fabrics is shown in Table 3. The washing results for Cu-Ni-P coated cotton fabrics were at 5th grade color change.
A Note on Electrochemical Synthesis of Cobalt Nanoparticles
Procedure
On diffraction patterns of sample 1 (Fig. 2а), cobalt hydroxide and oxyhydroxide reflexes are observed; they naturally formed at the set process mode due to local cathode region alkalization. The sample 2 (Fig. 3b) also consists of nanoparticles in the size ~30-50 nm, which are located separately and form a continuous field. On this background (about 5% of the total of particles), larger dark quasi-hexagonal particles in the size up to 100-150 nm are located at the sizes.
Practical Hints on Energy-Saving Technology for Production of
Nano-sized Particles
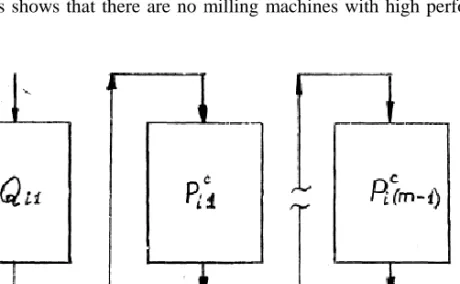
Рn (у) – probability of breakage of particles, which have size y at the nth stage of the breakage process. In practice, it is possible to determine the refraction function independently of the screening function. The basic scheme of multi-step milling of the starting material in the apparatus with centrifugal working parts.
Prediction of Polymer
Composites Strength Properties
Theory
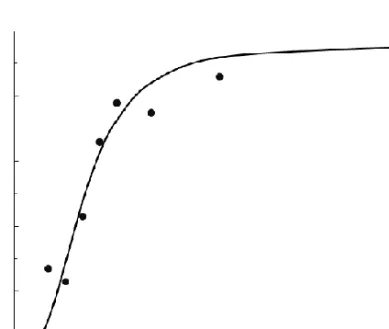
![Figure 5. Thermal conductivity as function of the relative provided interfacial area per gram composite (m2/g) [97]](https://thumb-ap.123doks.com/thumbv2/123dok/10281379.0/41.918.224.687.565.945/figure-thermal-conductivity-function-relative-provided-interfacial-composite.webp)
![Figure 4. Electrical conductivity of the nanocomposites as function of filler content in weight percent [97]](https://thumb-ap.123doks.com/thumbv2/123dok/10281379.0/41.918.210.709.125.491/figure-electrical-conductivity-nanocomposites-function-filler-content-percent.webp)