I want to thank Brian in a special way for being very generous with his time during our Monday meetings. I would also like to thank everyone I collaborated with at NIST during my two visits there. I would also like to thank Joe Hodges, Dave Long, and Erin Adkins for the opportunity to work with them on the cavity ring-down A-band measurements, as well as for many helpful conversations about the photoacoustic data.
I would like to thank Mitchio for the countless hours of guidance and support he provided me throughout my graduate career. Thanks to Crystal Chu for the many boba chats, Target trips and adventurous culinary experiences. Thank you Katerina Korch for the many memories we created as roommates - from the time on the terrace to the time for tea and the sofa, I have many beautiful memories from all times.
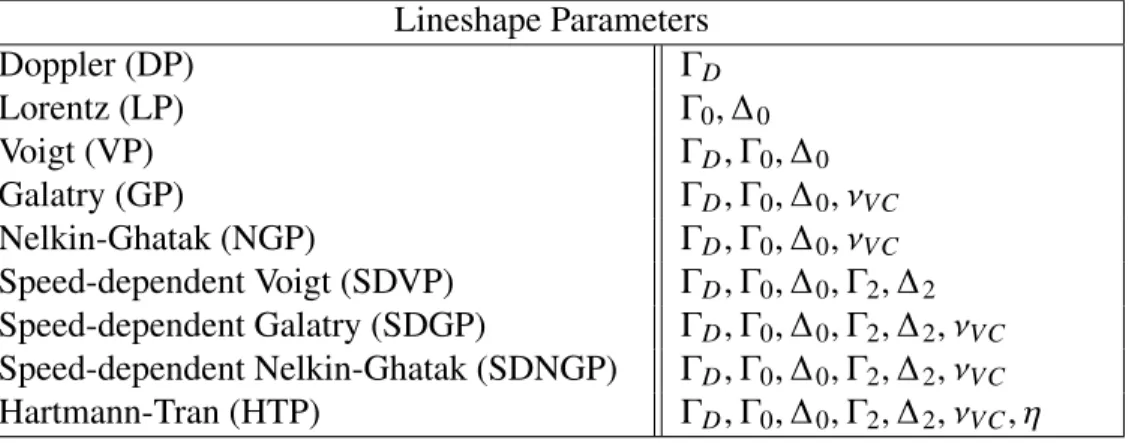
I think you kept the USPS going for the last seven years with all the greeting cards I got for every holiday imaginable. The data also indicate the importance of line shape profile selection for resonant absorption to accurately characterize line mixing and collision-induced absorption; the rate-dependent Nelkin-Ghatak profile is required for the current data set.
LIST OF TABLES
INTRODUCTION
One of the main sources of this radiation imbalance is the ever-increasing concentration of greenhouse gases in the atmosphere. There is a clear, sudden onset of exponential growth beginning around 1750 with the beginning of the Industrial Revolution. The oceans and biosphere absorb about half of the anthropogenic CO2 each year, while the remaining ~17 gigatons/year accumulates in the atmosphere [3].
While on average about 50% of anthropogenically produced CO2 accumulates in the atmosphere, with the rest absorbed by the oceans and biosphere, the fraction can change significantly from year to year. The singlet nature of the 𝑏1Σ+𝑔 excited state results in one energy level for each N value. This results in both a broadening of the line shape and a shift of the observed line center.
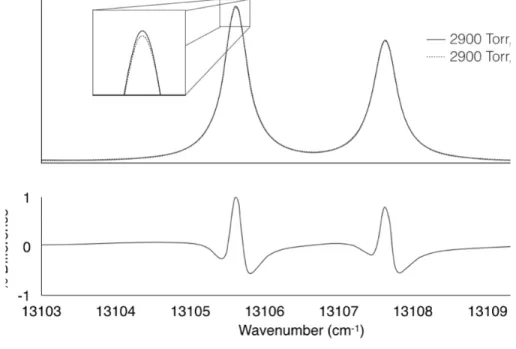
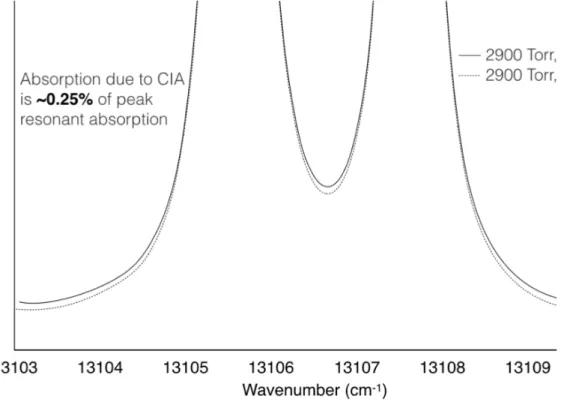
The intensity of collision-induced absorption scales with number density squared due to the bimolecular nature of the collision. This spectral region also corresponds to the part with the strongest collision-induced absorption; however, even at 2900 Torr it is only about 0.25% of the peak resonant absorption.

HIGH-RESOLUTION, BROADBAND, LOW TEMPERATURE PHOTOACOUSTIC SPECTROMETER
This quantity is equal to the product of the cell constant (𝐶𝑐𝑒𝑙 𝑙), the relaxation response function (𝑅(𝜔𝜏)) and the absorption coefficient (𝛼). The cell constant is only dependent on the geometry of the photoacoustic cell and the properties of the sample gas. The relaxation function and the observation of the frequency dependence of the function will be discussed further in Section 2.7.
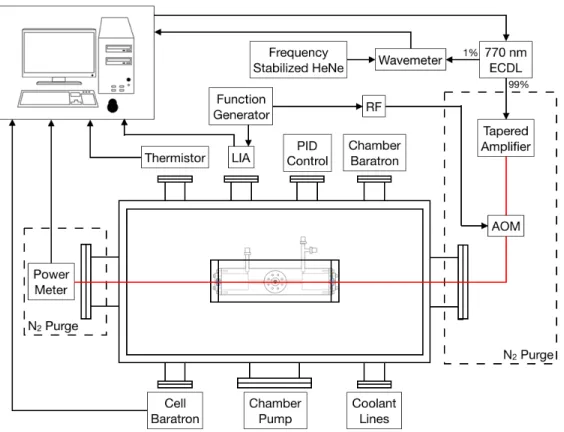
The photoacoustic spectrometer is based on the NIST [11] design with several improvements to increase the signal-to-noise ratio of the data. The laser modulation frequency is set to excite the lowest-order longitudinal mode of the acoustic resonator (typically 1.5–1.6 KHz) to increase the signal-to-noise ratio of the acquired spectra. This measured power is corrected for absorption along half the length of the cell to normalize the photoacoustic signal to the power at the center of the cell where the microphone is placed.
The cell pressure is monitored with a heated capacitive manometer (MKS 690A) with an uncertainty of 0.08% of the reading up to 10,000 Torr. When the standard deviation of the measured wavelength is <1MHz for 50 consecutive points, the laser is considered locked and data acquisition begins. A single point takes about 5 seconds, with laser frequency stepping and locking requiring ~4 seconds and ~1 second mic/power data averaging time.
One of the most challenging aspects of retrieving quantitative information from the photoacoustic data was the conversion of the microphone signal to absolute absorption. While the SNR of the spectrum is over 20,000, the relative intensities show a clear deviation from previously measured values in the order of 2%. Some of this change in response across the spectrum can be explained by the proportion of optical energy potentially emitted as acoustic energy due to the approximation of the 3-state system as a 2-state system.
It is linear across the spectrum and depends only on the laser frequency. 38 Figure 2.3 shows the dynamic range of the instrument due to long-term stability and possible long-term averaging. The full scale of the spectrum on the right is four orders of magnitude weaker than the spectrum on the left and still has signal to noise of about 50.
BIBLIOGRAPHY
CHAMBER CAD DRAWINGS
HOUSING CAD DRAWINGS
HOUSING MOUNT CAD DRAWINGS
MANIFOLD DESIGN
OPTIMIZING DATA ACQUISITION
To achieve a reasonable overall measurement time for the full scan, typically for the measurements presented here, n=15.
DETERMINATION OF PRESSURE SHIFTS OF THE OXYGEN A-BAND USING PHOTOACOUSTIC SPECTROSCOPY
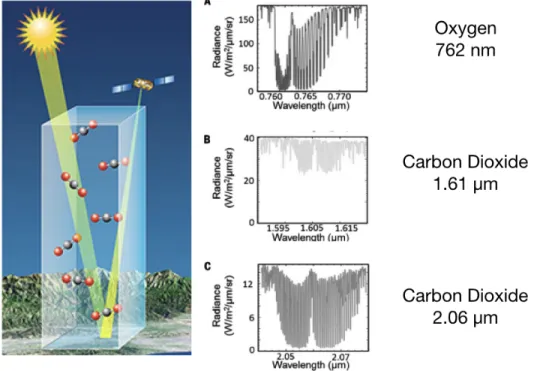
The oxygen A band (762 nm) is used for the determination of air mass, solar path length, and surface pressure in a variety of remote sensing applications due to the uniform concentration of molecular oxygen throughout the atmosphere and the spectral isolation of the band. Errors in oxygen spectroscopy propagate to retrieved CO2 mole fractions, requiring accurate quantification of A-band spectral parameters. In recent years, a number of experimental efforts have greatly improved the accuracy of oxygen A-band line shape parameters to meet the needs of OCO missions.
These results show that a single data set can yield results that differ by a factor of 2 due to small errors on the absolute frequency axis arising from uncertainties in the line positions of the calibration molecule. Recently, Drouin published an extensive line shape study of the oxygen A-band with the goal of obtaining self-consistent line shape parameters using multispectral fitting over a wide range of pressures and temperatures. The photoacoustic spectrometer is based on the NIST design [18] with several improvements to increase the signal-to-noise ratio of the data.
There is no evidence of line mixing at the pressures included in the current data set within the signal-to-noise ratio of the data. The signal-to-noise signal of the data decreases with pressure and is lower for NIST air compared to oxygen; however, all spectra were within the range of . All initial line shape parameters were taken from Drouin 2017, with the exception of the Dicke narrowing parameters from Long 2010[2].
An example of the absolute displacement as a function of pressure of P11Q10 is shown in Figure 3.4. The PAS-measured oxygen shifts agree well with the previous measurements of Predoi-Cross [1] and Brown [4] although the uncertainties are reduced and there is a smoother J dependence of the pressure shift coefficient. For the main isotopologist, these values currently correspond to Robichaud measurements in the P branch and an average of the Predoi-Cross retrieved values of data calibrated to CO and 𝐼2.
Due to the sensitivity of the pressure shift coefficients to the absolute frequency axis, and the fact that averaging occurs. Experimental intensity and lineshape parameters of the oxygen A-band using frequency-stabilized ring-down spectroscopy”. Pressure shift of the (0,0) and (1,0) bands of the oxygen[formula]Transition of Fourier transform spectroscopy”.

LINE MIXING AND COLLISION-INDUCED ABSORPTION IN THE OXYGEN A-BAND
Line mixing and collision-induced absorption are collision effects that affect the spectra in the far arms and baseline. Because line mixing and collision-induced absorption affect the arms and baseline of the spectra, errors in capturing the physics of one phenomenon can result in errors in the other from the fit. Therefore, high SNR data over a wide range of pressures are required to constrain line mixing and pressure-dependent collision-induced absorption so that the correct physics can be captured in the models.
Cavity ring-down spectroscopy has been used to measure line mixing and collision-induced absorption in the A band by Spiering [3, 4, 5] and Long[6] for the p branch only. Both studies attempt to model resonance lines and line mixing and attribute the smooth residual absorption to collision-induced absorption. Although these measurements provide valuable insight into the line mixing and collision-induced absorption in the oxygen A band, there are limitations to each technique.
Having only wing information makes decoupling of line mixing and collision-induced absorption measurements more complicated without the additional constraints provided by the line core information. In addition to the experimental efforts to model line mixing and collision-induced absorption in the oxygen A band, some recent theoretical calculations of line shapes for the collision-induced absorption profiles have been published. Finally, the high SNR of the data is useful for measuring line mixing and collision-induced absorption, because these small, weak effects can be observed in the laboratory environment.
In the A band the collision-induced absorption is very weak compared to the resonance lines. Photoacoustic spectroscopy was used to measure oxygen and air in the A-band region to characterize line mixing and collision-induced absorption. The high signal-to-noise data provide new insight into the adjustments needed to the line mixing model and the resulting collision-induced absorption.
Line Blending and Collision-Induced Absorption of Oxygen in the A-Band: Laboratory Measurements, Model and Tools for Atmospheric Spectral Calculations". Line Blending and Collision-Induced Absorption in the Oxygen A-Band Using Cavity Ring-Down Spectroscopy". Frequency Stabilized Cavity Ring-Down Spectroscopy Measurements of Line Blending and collision-induced absorption in the O2 A band”.


![Figure 1.4: (a) Global maps of CO 2 dry air mole fractions in winter (top) and summer (bottom) (b) CO 2 map over the Los Angeles area from [9]](https://thumb-ap.123doks.com/thumbv2/123dok/10402606.0/22.918.178.740.311.721/figure-global-maps-mole-fractions-winter-summer-angeles.webp)