Introduction
Motivation
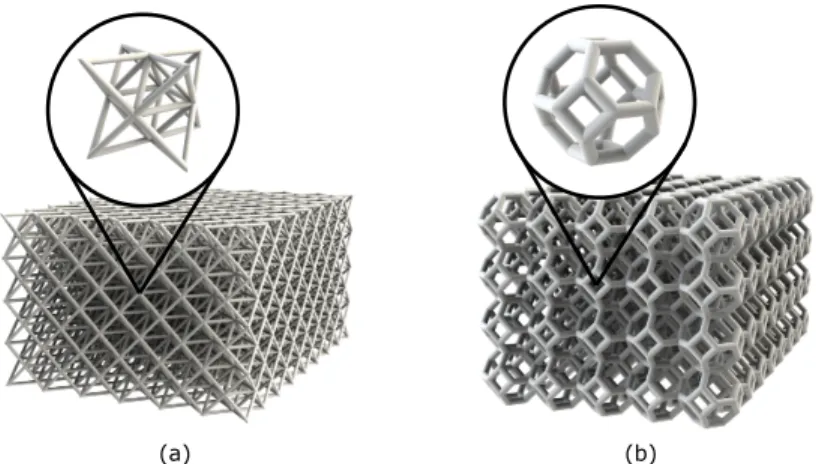
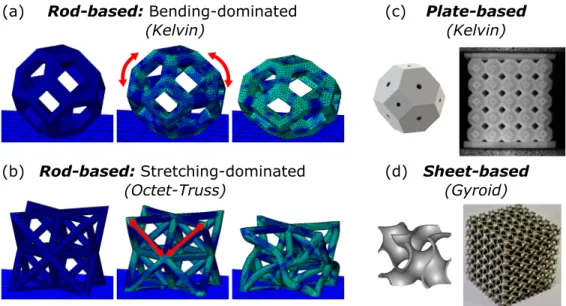
Lattice structures are a class of architected cellular material composed of periodic unit cells with structural components such as rods, plates or shells [4, 12-15]. Through careful design of the unit cell microstructure, lattice structures demonstrate superior mechanical properties such as stiffness and yield strength over conventional cellular materials such as stochastic foams [4, 16].
Background
- Classification of Lattice Structures
- Additive Manufacturing Techniques
- Low Strain-Rate Behavior of Lattice Structures
- High Strain-Rate Behavior of Lattice Structures
Experimental research on the dynamic and shock compression behavior of lattice structures remains largely unstudied and is the focus of this thesis. Inconel 718 lattice structures with similar microstructures have shown effects related to base material heat treatment and strain rate independent strain trends related to flow stress enhancement [45].
Thesis Outline
These materials showed strain bands in the middle of the sample, similar to their low strain rate behavior. In general, the force measurements in these experiments were similar to the trends in the low strain rate behavior 𝜎𝑁−𝜖𝑁 of the lattice specimens (Fig.
High Strain-Rate Compression Behavior of Polymeric Rod and
Introduction
Low-velocity impact experiments have been performed on polymeric plate grids [76] and high-strain-rate experiments have been performed on a single unit cell. In this chapter, we perform high- and low-strain experiments and simulations on polymeric rod and plate lattices with a 5x5x5 Kelvin unit cell geometry.
Materials and Methods
- Specimen Design and Manufacturing
- Low Strain-Rate Experiments
- High Strain-Rate Experiments
- Numerical Simulations
2D digital image correlation (DIC) software (Vic2D, Correlated Solutions, Columbia, SC) was used to determine the displacement of the hydraulic crosshead. A 2D DIC code (Vic2D) was used to extract the displacements and velocities of the input and output line interfaces.
Results and Discussion
- Base Material Characterization
- Low Strain-Rate Experiments on Lattice Specimens
- High Strain-Rate Experiments on Lattice Specimens
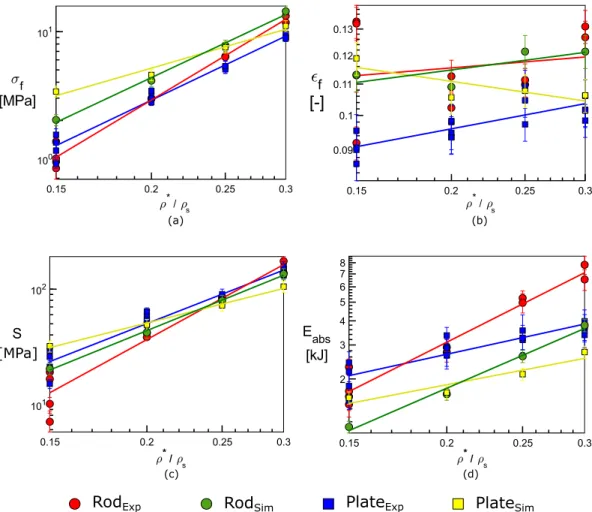
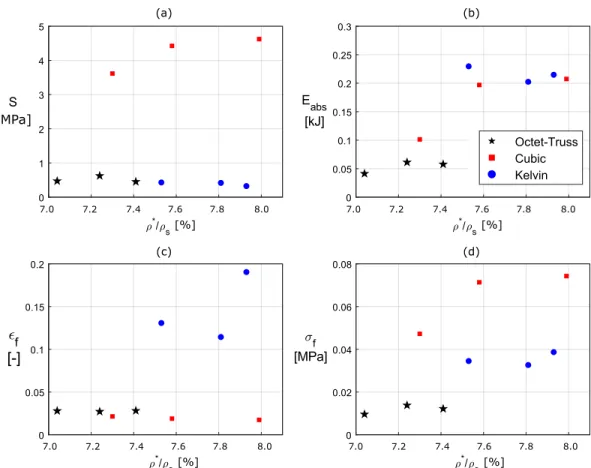
- Mechanical Properties and Energy Absorption
- Numerical Simulations
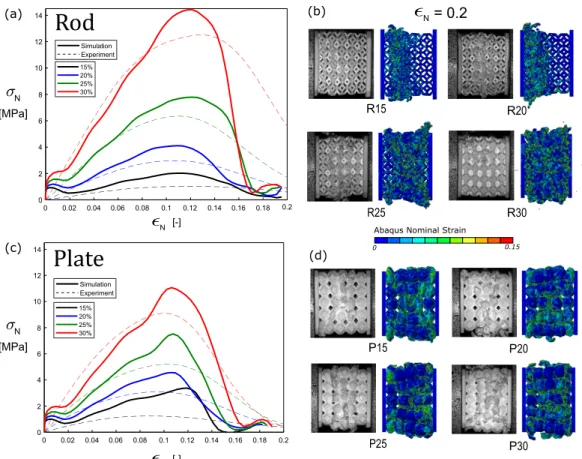
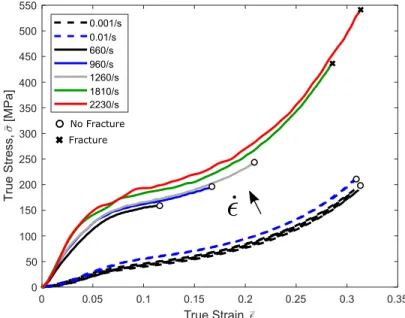
-rate effects on the mechanical properties can be quantified using a dynamic enhancement factor,𝐷. The factor𝐷 for each property is defined as the ratio of the average high strain rate value to the corresponding average low strain rate value. The value for of the photopolymer is measured in compression, but can serve as a baseline approximation for the high strain-rate effect. The velocity of the upper rigid plate is set to correspond to nominal strain rate of 𝜖¤ = 1000/𝑠.
Low strain rate experiments on bulk photopolymer (Fig. 2.5) allow extraction of the quasi-static modulus 𝐸 ≈ 400 MPa. The numerical stress-strain response also provides good validation of the trends in mechanical failure properties.
Summary and Conclusions
As time increased, the particle velocities of the grating samples approached the velocity of the aircraft. These values would converge if there was no elastic wave or inelastic deformation before the impact. The post-impact stress strongly depends on the pre-impact stress state at these impact velocities.
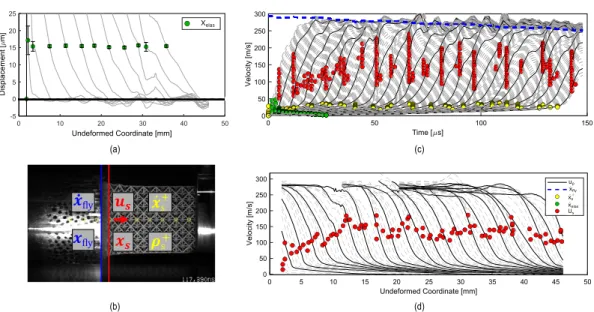
Determining the shock front using 𝑑 𝑢𝑝/𝑑 𝑋 enhanced extraction of the shock wave as shown in Fig. Small fluctuations of particle velocity behind the shock were observed, but clearly follow the flyer's deceleration.
Transient Dynamic and Shock Response of Polymeric Lattice
Introduction
Under high strain rate (> 1000𝑠−1) loading, gratings have shown material effects such as strain rate strengthening in metallic materials and strain rate stiffening in polymeric materials as seen in Chapter 2. Deformation states in this regime are similar. for those with low strain rates, strain and collapse typically start in the center of the lattice specimen. Another relatively less explored topic is the effect of topology (geometry of the UC) on this transient dynamic response and the transition to shock-like behavior.
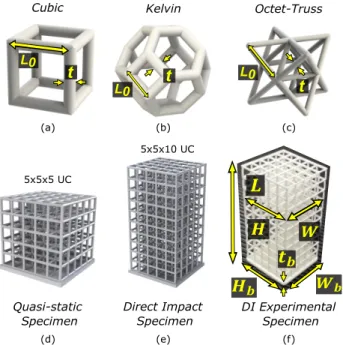
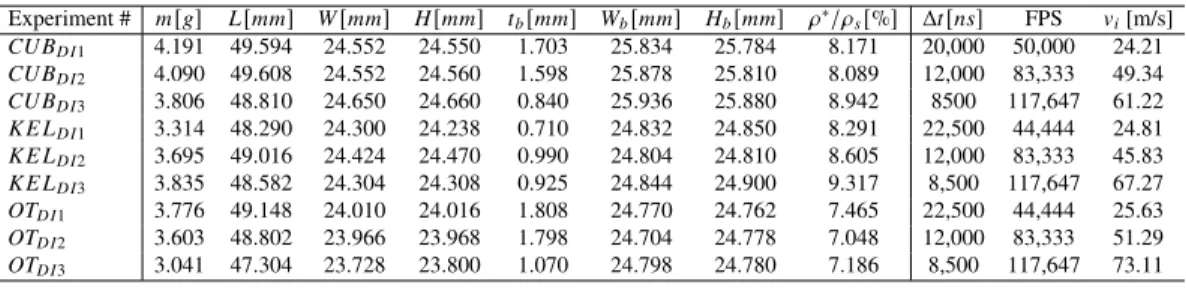
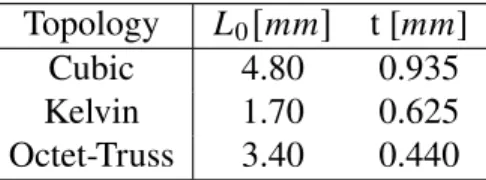
In this chapter, the transient dynamic and shock response of polymeric lattice structures and the effect of topology are investigated by means of direct gas gun impact experiments. The low strain rate, transient dynamics, and shock behavior of cubic (CUB), Kelvin (KEL), and octet-truss (OT) topologies are investigated.
Materials and Methods
- Design and Manufacture of Polymeric Lattice Structures
- Low Strain-Rate Experiments
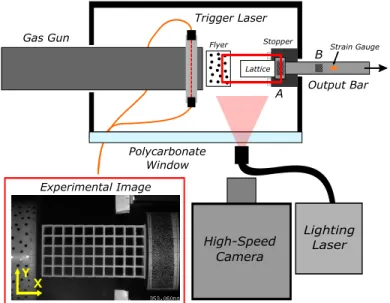
- Direct Impact Experiments
Incremental correlation was used for all analyses, due to the large distortions of the grid and to maintain consistency across all three regions of interest. The impact speed of the kite, 𝑣𝑖, was calculated in each experiment from the pre-impact kite DIC (AOI1) and is shown in Table 3.3. The anvil particle velocities were 0 (10) mm/s and much smaller than the size of the fly and grid particle velocities.
Strain gauge measurements on the polycarbonate pressure bar allowed extraction of the force acting on the distal (unaffected) end of the lattice using conventional Hopkinson pressure bar (HPB) analysis. 𝐸/𝜌 with density 𝜌 = 1200𝑘 𝑔/𝑚3[96]), 𝜖𝑆𝐺 is the strain measurement in the rod, 𝐹 is the force acting at the lattice-anvil interface, and 𝐴 is the cross-sectional area of the rod.
Results and Discussion
- Low Strain-Rate Behavior of Lattice Structures
- Elastic Wave Speeds in Dynamic Experiments
- Compaction Behavior of Lattice Specimens
- Shock Response of Lattice Structures
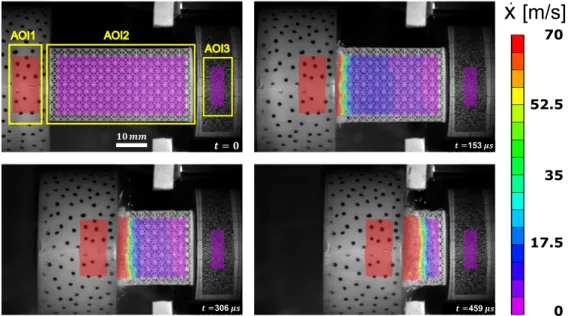
3.9(d) shows the initial development of a compression front at 𝜀 =0.2 and the formation of additional deformation bands ahead of the compression front with𝜀 = 0.4. The compression wave also appeared to dissipate in all experiments, represented by non-zero strain ahead of the front. The pre-impact density remains at a relatively constant value during deformation while the post-impact density varies greatly.
3.12, the particle velocity behind the shock converged to the velocity of the flyer during deformation and can therefore be approximated as the flyer velocity, 𝑥¤𝑓 𝑙 𝑦. The stress behind the compression wave showed higher values than the stress state ahead of the wave, but overall waveforms were similar.
Summary and Conclusions
The Eulerian (deformed) coordinates show a true shock trace that accounts for the elastic deformation. The linearized approximations were found by taking a linear fit of the flight and shock fronts in Figs. Equation (4.11) quantifies the effect of the elastic wave and pre-shock density on the Lagrangian shock velocity.
A variational approach to the theory of the elastic behavior of polyphase materials.” Journal of the Mechanics and Physics of Solids pp. Effective properties of the octet truss lattice material.” Journal of the Mechanics and Physics of Solids pp.
Shock Compression Behavior of Stainless Steel 316L Octet-Truss
Introduction
Rankine-Hugoniot jump conditions for planar uniaxial shocks after conservation of mass, momentum and energy have been extensively applied in analytical models of the shock response of foams, but have only been proposed in lattice structures [59]. The shock response of lattice structures has been studied in a limited way over different length scales and materials. 60] investigated the impact behavior of nanoscale brittle lattice structures that exhibited a densification shock response with different regions of intact and densified material.
Few impact experiments have been performed on engineering-scale (UC millimeter) metal mesh structures. The shock regime of lattice structures has been introduced but not fully explored and requires the development of consistent theory and analysis across length scales and materials.
Experimental Methods
- Specimen Design and Characterization
- Normal Plate Impact Experiments
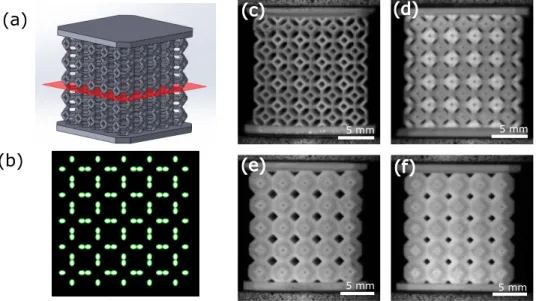
- Digital Image Correlation
𝑉 128 images (400x250 pixels (px)) were captured at a constant frame rate (500,000 to 800,000 frames per second) set to maximize the number of images taken normal to the shutter side through the computer window during shock compression of grid sample. The frame rate of the high-speed camera was determined by setting the frame interval, Δ𝑡, based on target impact velocities of and 380 m/s.
Disruption of the laser (placed in front of the specimen) by the flyer caused a measured voltage drop, which was induced after a duration of 1𝜇 𝑠. Due to the inherent periodicity of the grating sample, DIC was able to associate AOI2 subsets that were smaller than a unit cell with seed points located away from the impact surface.
Experimental Results and Discussion
- Wave Definitions and Extraction
- Rankine-Hugoniot Shock Analysis
In all experiments, aircraft deceleration was observed and the gust velocity dispersion curves showed large differences in values. Elastic wave velocities were calculated using a linear fit of the elastic front time history, and the error is reported as the 95% confidence interval of the fit. Elastic wave velocities were calculated using a linear fit of the elastic front time history, and the error is reported as the 95% confidence interval of the fit.
Assuming or measuring preshock stress, 𝜎+ and conservation of momentum (Eq. Stress and specific internal energy before shock were approximated using conservation of momentum (Eq. 4.3)) and conservation of energy (Eq. 4.4) and used with linear 𝑈𝑠 −𝑢𝑝 relation for LENS AM.
Numerical Simulations
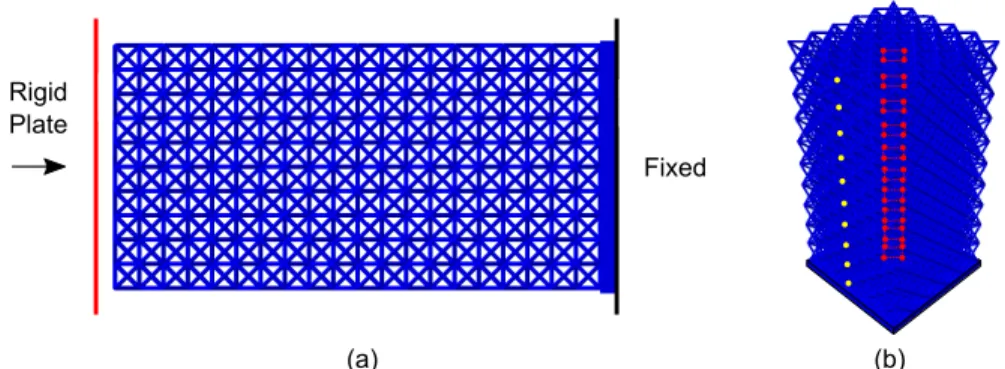
- Finite Element Model Framework
- Simulation Results
- Rankine-Hugoniot Shock Analysis
- Validation of Node Measurements
- Comparison to Experiments
Internal energy per unit volume showed a positive correlation with particle velocity and relative density - this is due to an increase in mass in higher relative densities, but little to no change in space-filling volume of the samples. A clear discontinuity in particle velocity was observed between regions of nearly zero velocity before the shock and high constant velocity behind the shock. The shock front was defined using a maximum 𝑑 𝑢𝑝/𝑑 𝑡 (change in velocity with respect to time) criterion.
This relation allows the calculation of the shock velocity in both coordinates given known values for the density and velocity before the shock. Rankine-Hugoniot jump conditions were applied to the elastic wave assuming initial quiescence conditions and the wave velocity, 𝑐𝑒𝑙 𝑎 𝑠, which was measured using a linear fit of the front positions as seen in Fig.
Summary and Conclusions
Načrtovanje, analiza in izdelava rešetkastih struktur: Pregled.« International Journal of Computer Integrated Manufacturing str. Dynamic crushing of honeycombs and features of shock fronts.”International Journal of Impact Engineering str. Shock compression behavior of inox 316L octet-truss lattice structures.” International Journal of Impact Engineering str.
A general tetrakaidecahedron model for open cell foams. International Journal of Solids and Structures p. Size effects in lattice structures and a comparison with micropolar elasticity. International Journal of Solids and Structures p.
Summary and Future Work
Summary
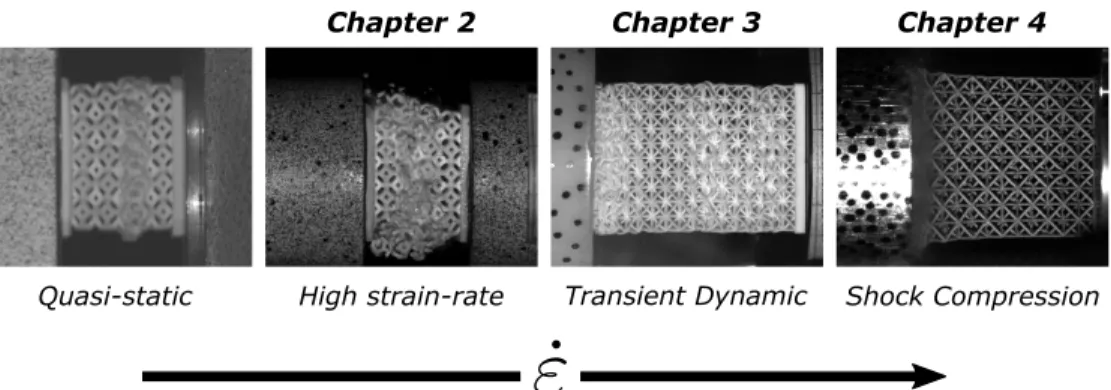
In this thesis, we investigated the dynamic behavior of polymeric and metallic lattice structures of different topology and relative density on the centimeter length scale. Experimental techniques are used to study the high strain rate, transient dynamic and shock compression behavior of lattice structures and numerical simulations are used to support, verify and extend the experimental analyses. In Chapter 2, the high strain-rate response (𝜖¤≈ 1000𝑠−1) of rod-like and plate-like polymeric lattice structures with Kelvin unit cells of varying relative density is investigated.
In Chapter 3, the transient dynamics and transition to shock response of polymeric lattice structures with cubic, Kelvin and octet truss topologies at moderate to high impact velocities (25-70 m/s) is discussed. We show that these lattice structures support an elastic and densifying shock wave, similar to polymeric lattice structures in Chapter 3, supporting this behavior as a generalization.
Future Work
- Experiments on Shock Compression
- Theory and Analysis
- Computational Methods and Homogenization
- Thermomechanical Effects in Modeling
- Unit Cell Size Effects
Additively Fabricated High Strength Functionally Graded Ti-6Al-4V Lattice Structures Under Static and Dynamic Loading: Experiments." International Journal of Impact Engineering 111. Dynamic Crushing of Aluminum Foam: Part I – Experiments." International Journal of Solids and Structures pp. Dynamic Crushing of Aluminum Foam: Part II – Analysis.” International Journal of Solids and Structures pp.
Dynamic in-plane crushing of honeycombs - a finite element study. International Journal of Impact Engineering pp. A numerical study on the velocity sensitivity of cellular metals. International Journal of Solids and Structures p.
Viscoelastic Parameters for Polycarbonate SHPB Correction