Introduction
Energetic Constraints on the ITCZ Position in Simulations with a
Introduction
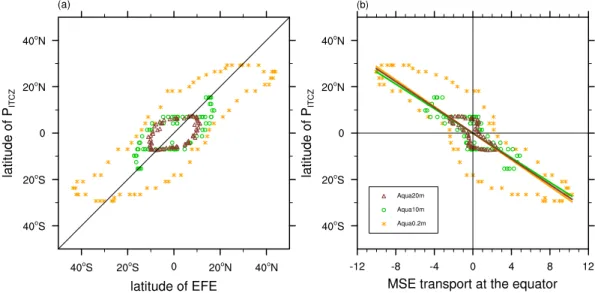
This framework emphasized the anti-correlation between the ITCZ position and the cross-equatorial atmospheric energy transport and led to the introduction of the energy flux equator (EFE, the latitude at which the meridional energy transport disappears) as a diagnostic for the ITCZ ( Kang et al., 2008). Interestingly, a lag exists between the EFE and the ITCZ, especially as the ITCZ moves from the northern to the southern hemisphere (SH).
Methods
Finally, we use the energy flux equation (EFE), which, as discussed in the introduction, has been shown to be a good predictor of the ITCZ and its response to perturbations for annual and zonal averages. If we assume that the energy transport in the tropics is mainly accomplished by the Hadley circulation, the mass flux is zero.
Summertime Means
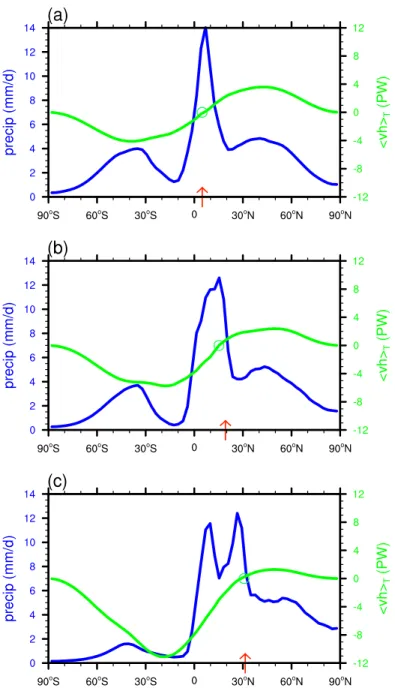
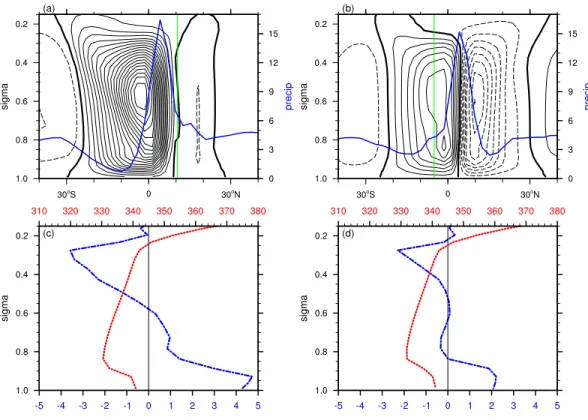
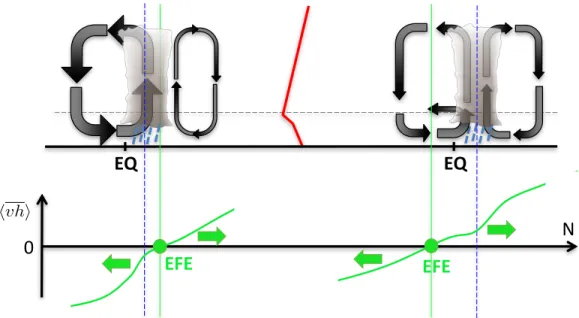
The approximate collocation between the EFE and the ITCZ is also based on the assumption that in the tropics the transport of energy is mainly influenced by the mean meridional circulation (that is, the Hadley cell). This pattern does not match the conventional picture of a weak cross-equatorial Hadley cell, in which the mean energy transport in the two cells is comparable in magnitude and opposite in sign, and the mean EFE coincides with the ITCZ.
Seasonal Migrations
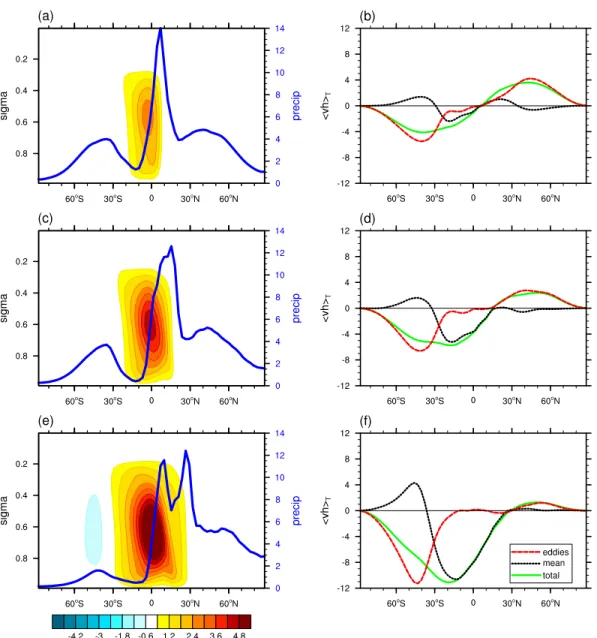
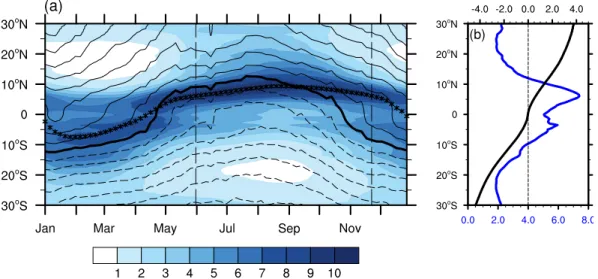
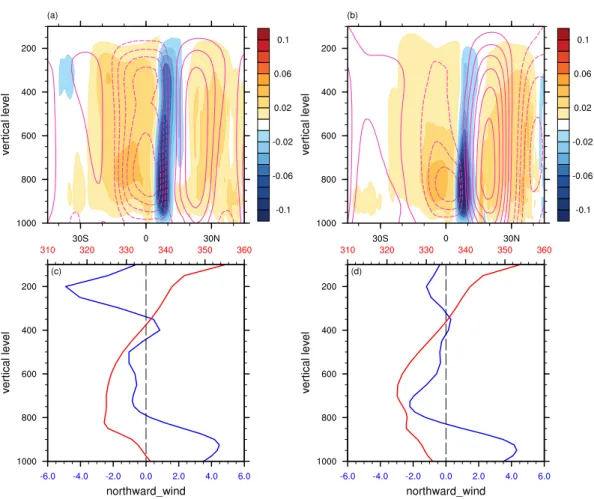
Next, we want to investigate the mechanisms of the lag relationship between the EFE and the ITCZ and the changes in the circulation that lead to the negative GMS. The relationship between the seasonal evolution of EFE and NEIeffis is made more visible in Fig. A more direct assessment of the factors contributing to the seasonal evolution of the energy transport—and with it the EFE—can be obtained through the following.
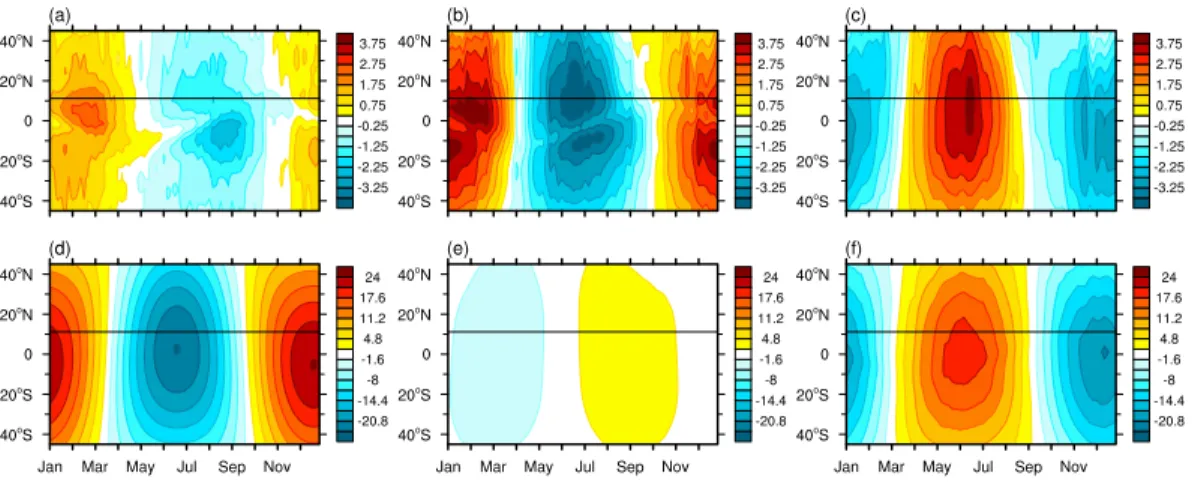
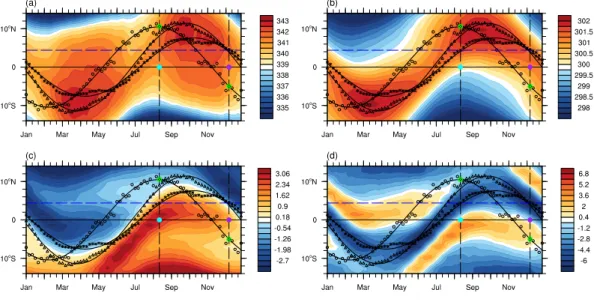
The evolution of the seasonal anomaly (defined as the deviation from the annual mean at each latitude) for each term is shown in Fig. Vertical profiles of MSE (red dashed line, K) and meridional wind (blue dashed line, m s −1) at the equator on (c) Aug. The vertical blue dashed line indicates the latitude of the ITCZ (φPIT C Z) at these two pentagons.
Discussions and Conclusions
This manifests itself as an asymmetry in the vertical structure of the winter cell during the expansion and retreat phase. These results indicate that EFE and ITCZ are not related in a simple way during the seasonal cycle. Ho-Hsuan Wei and Simona Bordoni (2016), On the role of African topography in the South Asian monsoon.
Furthermore, in the NoAf experiment, the cross-equatorial current propagates over the African continent and. The exact role that African topography plays in the structure and intensity of the cross-equatorial SAM flow and precipitation remains a matter of debate. We find that in the absence of the blocking effect of African topography, westerly winds strengthen over the East African coast.
Energetic Constraints on the ITCZ in the Observed Seasonal Cycle 36
Data and Methods
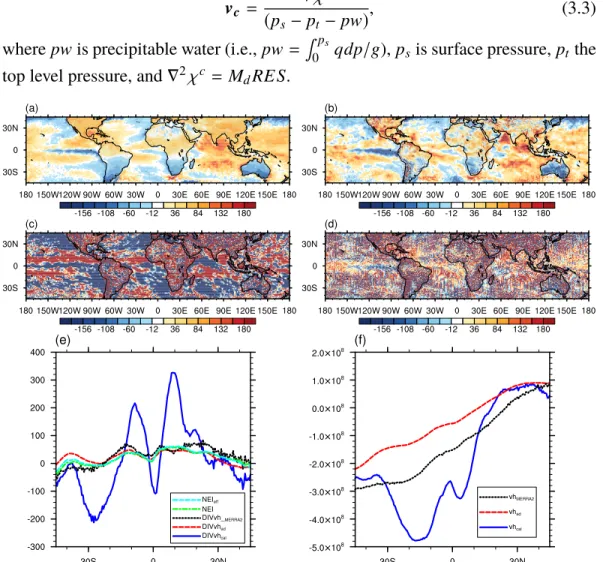
We use fields from NASA's Modern-Era Retrospective Analysis for Research and Applications, Version 2 (MERRA-2) (e.g., Bosilovich et al., 2015; Rienecker et al., 2011), with horizontal resolution of 0.5◦ (longitude latitude ) and 3-hourly (atmospheric fields) and 1-hourly (other variables such as surface fluxes and radiation) temporal resolution for years 2002−2016. 1−q)vdp+MdRE S, (3.1) whereMdRE S is the rest of the dry mass, which is also equal to the difference between the total mass and moisture residue. The mass adjustment is calculated from 6-hourly data at pressure levels (42 layers), which allows us to calculate the vertically integrated total MSE flux at pentad.
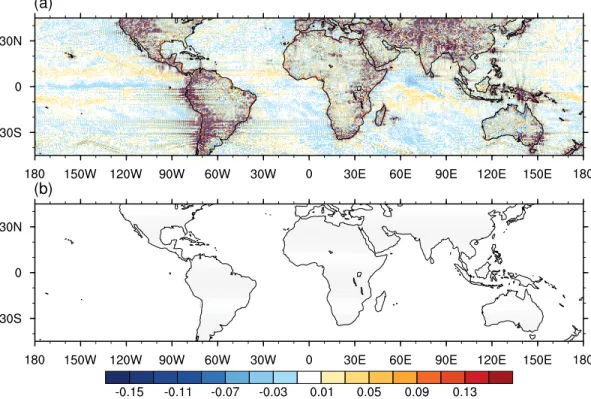
The residual amount of both the zonal mean and the local MSE budget is also significantly reduced compared to that calculated without mass adjustment or from the vertically integrated MSE flux directly available from MERRA-2 (Fig. 3.2). Please note that the vertically integrated MSE flux we show here is the divergent component of the flux, which is that of the circulation component that contributes to precipitation.
General Features of the ITCZ, Circulation and the Energy Flux
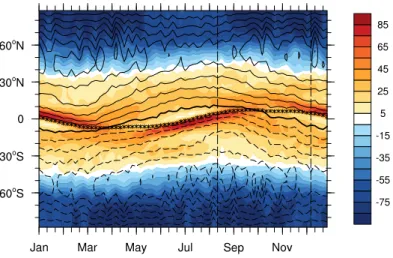
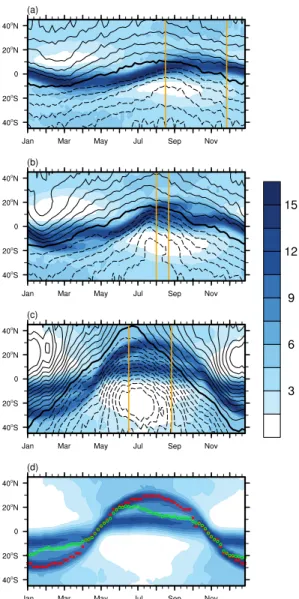
This is the result of the development of the SH ITCZ in the eastern Pacific, a strengthening of the SPCZ in the western Pacific, and a southward shift to the SH of the ITCZ in the African and Indian sectors. Therefore, contrary to what is seen in the idealized simulations, the temporal relationship between the EFE and the ITCZ in the observations cannot simply be described as a lag, because the ITCZ evolution is different from an annual harmonic (Figure). At the point when the EFE and the ITCZ are on opposite sides of the equator, the cross-equatorial tilt cell transports energy toward the lower level.
The ITCZ in the NH has a temporally asymmetric evolution and is stronger as the ITCZ expands into the NH than as it retreats from it. Given that, similar to what we see in the zonal mean, the ITCZ does not evolve at the same frequency as the annual cycle of solar radiation, the temporal relationship between the EFE and the ITCZ cannot simply be described as a slowdown. However, we do see differences in the circulation structure between the expanding and retreating phases.
Discussions and Conclusions
Interest in the fundamental dynamics of the Somali jet is motivated by its possible impact on the SAM precipitation through the associated moisture transport. We test this hypothesis by examining how both the westerly flow and air parcel trajectories are modified in the absence of the African topography. In the next subsection, we present PV budget analyzes following trajectories to develop a more mechanistic understanding of the cyclonic anomaly over the Arabian Sea in the NoAf experiment.
Caused by the mountain range west of the cross-equatorial flow, lateral friction forces induce a positive material PV tendency in the CTL experiment along the particles moving near the African topography. Furthermore, changes in relative vorticity are not necessarily correlated with changes in the southerly flow on the eastern flank of the PV-positive anomaly. While in the literature it is generally accepted that African topography contributes to spatiality.
On the Role of the African Topography in the South Asian Monsoon 52
Methods
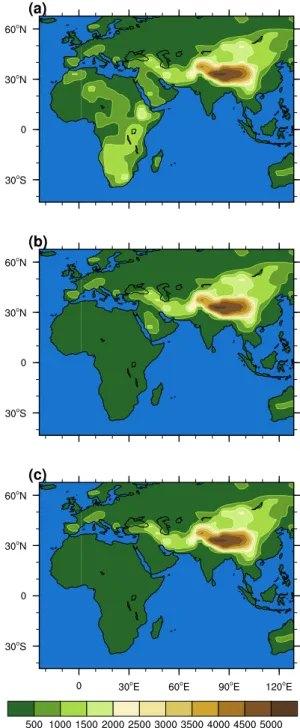
Climatologically fixed sea surface temperatures (SSTs) derived from 2 degrees x 2 degrees 49-year (1950 to 1998) monthly averages of the Reynolds reconstructed historical SST analysis (Smith et al., 1996) are used as the lower boundary condition. Large-scale budgets, such as moisture and PV budgets, are analyzed to shed light on mechanisms implicated in the precipitation and circulation response to the topography change. Once the trajectories have been calculated, other variables, including the various terms in the PV analysis, as described in detail in Section 4, are interpolated along the paths.
Note that trajectories are calculated using the three-dimensional (3D) wind field resolved by the grid-scale GCM. In the PV budget analysis, we average these eight integrations to represent the average summer trajectories. The distribution of the eight trajectories for the different integration start dates increases with integration time, but the trajectories all have similar patterns (not shown).
Impact of the African Topography on the Somali Jet and SAM Pre-
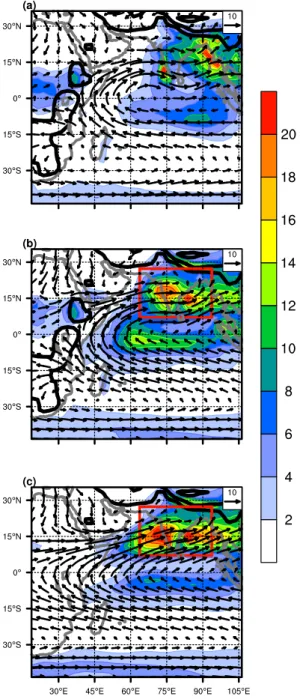
The red rectangle indicates the 'Indian region', for which the accumulated precipitation in the model experiments is shown in Figure. Counterintuitively, we find that precipitation increases almost everywhere in the Indian region, with the largest anomalies just west of the Indian subcontinent across the globe. Arabian Sea and minor anomalies over the Bay of Bengal (Fig. 4.2b, c and Fig. 4.5b). These results therefore demonstrate how changes in Somali jet strength in response to changed topography are not linearly correlated with changes in SAM precipitation.
They found that these rapid SAM wind changes are accompanied instead by a rapid strengthening of the cross-equatorial mass transport at the periphery of the jet (between 48.75oE and 71.25oE). 4.6, in the NoAf experiment, the cross-equatorial mass flux decreases only in the core region and remains largely unchanged in the periphery. While the removal of African topography does not significantly change the large-scale patterns of the SAM, it is associated with an increase in the overall concentration.
Impact of the African Topography on the Larger-scale Circulation
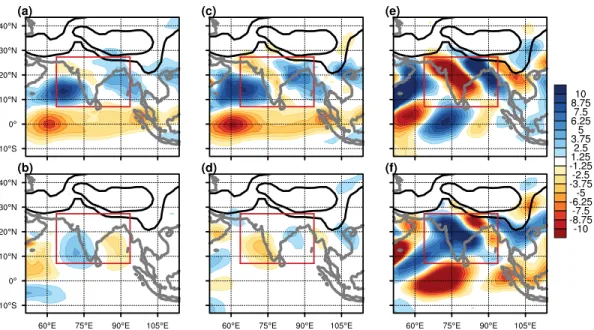
Positive anomalies in PV trends are found over the Arabian Sea, in the same broad region of positive PV anomalies. One can therefore expect that greater PV over the Arabian Sea in the NoAf experiment is mainly due to these positive PV trends. At time 0 hours, the PV in the NoAf experiment is greater than that in the STL experiment for each trajectory (Fig. 4.12a).
This means that the larger PV over the Arabian Sea in the NoAf experiment at time 0 hours is mainly due to the larger values in the initial PV. Specifically, the positive PV anomaly between the NoAf and CTL experiments over the Arabian Sea is due to the larger (or less negative) initial PV in the NoAf experiment compared to that in the CTL experiment. In (a) and (b), the thick lines show the mean and the shading shows the spread (2 standard deviations) in eight trajectories with eight different integration start times.
The Influence of the Arabian Topography
This may be due to a model artefact due to limitations in the convection scheme or the fact that the particles originate in a region (15oS) where convection is not active and is therefore characterized by greater stability. This appears to be due to the fact that the southerly flow on the eastern flank of the stronger PV anomaly associated with anomalous meridional convergence relative to the CTL experiment does not increase in the NoAfArab experiment relative to the NoAf experiment. Changes in the latter can cause changes in the PV field, without changes in the absolute vorticity.
The difference in the initial particle location, which was critical in explaining differences between the NoAf and CTL experiments, does not play a significant role here. This means that removing the Arabian topography does not significantly change the trajectories of particles reaching the Arabian Sea in the region of the largest PV anomaly. This suggests that accumulated PV material trends must be larger in the NoAfArab experiment than in the NoAf one, to explain the positive PV anomaly between the two experiments.

Conclusions
For example, reducing the cross-equatorial flow as the African topography is removed will reduce upwelling and increase SSTs. By providing insight into the response of the SAM to modified topography, and resulting flow. Orographic effects of the Tibetan Plateau on the East Asian summer monsoon: an energetic perspective.J Climate.
Effects of rotation rate and seasonal forcing on the ITCZ extent in planetary atmospheres. Journal of the Atmospheric Sciences. The response of the ITCZ to extratropical thermal forcing: idealized plate-ocean experiments with a GCM. The meteorology of the West Indian Ocean, and the influence of the East African Highlands.
Conclusions