Proceeding the 6th Civil Engineering Conference in Asia Region: Embracing the Future through Sustainability
ISBN 978-602-8605-08-3
DUCTILITY OF CONFINED BRIDGE PIERS IN THE SEISMIC REGION
Antonius1, Iswandi Imran2, and Aref Widhianto3
1Lecturer of Civil Engineering, Universitas Islam Sultan Agung, Indonesia E-mail: [email protected] ; [email protected]
2Professor of Civil Engineering, Institut Teknologi Bandung, Indonesia E-mail: [email protected]
3Research Assistant of Civil Engineering, Universitas Islam Sultan Agung, Indonesia E-mail: [email protected]
ABSTRACT
This paper presents the ductility behaviour view of bridge pier structures located in earthquake prone zones. The confining steel installed on piers are evaluated and compared with provision on the standard design of lateral reinforcement installation requirements for earthquake resistant bridges in Indonesia (SNI 2833:2008). The ductility view of confined concrete piers is based on the developed confinement models obtained from a variety of dynamic load test results, such as Scott, Mander, and Hoshikuma models. The ductility analysis is simulated through sectional moment-curvature curves by estimating the sectional curvature ductility parameter. The two Pier bridges located in Central Java are taken as the case study; the circular section piers in medium earthquake zone and the wall section piers in strong earthquake zone. The results of analysis show that by applying the confinement models of Scott and Mander, the circular section piers have relatively high curvature ductility values while the wall section Piers have lower curvature ductility values.
Keywords: Bridge Piers, Confining Steel, Curvature Ductility, Confinement Models.
INTRODUCTION
Recently, the bridge construction in Indonesia is highly developed, especially to 60 meter long bridges or over which are frequently referred as long-span bridges. In accordance with the design of building structure, the design of bridge structure in Indonesia also have to consider the earthquake location or zone expecting that when a strong earthquake occurs, the bridge structure will not collapse. As the guarantee, the structural components expected to have plastification should be supported with adequate detailing reinforcement to maintain its stability in case that a large inelastic deformation occurs. Building Columns and bridge pier structures are structural components that potentially have those inelastic deformations.
Earthquakes taking place in several countries show that bridge piers failed to stand since they are not properly designed, such as lack of detailing reinforcement at pier plastic hinge areas (Priestley et al 1996, Wehbe et al 1999 and Andrewes et al, 2010). Those are indicated by the buckling of longitudinal reinforcement due to the lack of adequate confinements on the concrete core areas that do not reach a significant level of ductility. Figure 1 theoretically shows the location of the plastic hinges.
Fig. 1: Plastic hinge zone on the pier bridge
Plastic hinge region
Antonius, I. Imran, and A. Widhianto
TS2B-17 In Indonesian standard design of circular sectioned concrete bridges (SNI 2833:2008), the plastic hinge area at the ends of the columns must be confined with spiral or stirrups reinforcement. This transverse reinforcement shall be extended within a distance upon the maximum moment point at the hinge area, as the maximum value of 1.5 times column diameter or maximum size of the transverse section, one sixth column net-high if the hinge occurs at both ends of the columns, one fourth column net-high if plastic hinge occurs only at one end of the columns such as the cantilever pier. In accordance with the equation used to design column structure of SNI 03-2847-2002, ACI 318-11, and SNI 2833:2008 buildings, it also determines the amount of spiral reinforcement or closed stirrups used in certain areas that potentially form plastic hinge that must fulfill the following requirements:
For circular sections:
y c c g
s f
f A
A '
1 45 .
0
or (1)
y c c g
s f
f A
A '
1 12 .
0
(2)
For rectangular sections:
' 1
3 . 0
c g yh
c c
sh A
A f sh f
A or (3)
yh c c
sh f
sh f
A '
09 .
0 (4)
Where the value of fy used in equation above in ACI shall not exceed 10000 psi (~688 MPa), but upper limit in SNI is 400 MPa. Equations of (1) and (3) applicable for structures under static loadings, and equations of (2) and (4) for seismic loadings.
This paper describes the ductility behavior of confined bridge pier structure by circular and rectangular hoop reinforcement. Bridge pier confinement behavior is simulated by using a developed confinement model to normal quality concrete through moment-curvature curve by evaluating the ductility level of curvature section. The evaluated bridge Piers are taken from a case study of the existing piers at medium earthquake zone located in Semarang and at strong earthquake zone located in Magelang, Central Java.
CONFINEMENT MODELS
The confinement models shown in Table 1 are models that will be used to simulate behavior of pier sections conducted. The use of those three models of confinements are based on the discussion that they are resulted from the dynamic load test, that they have similarities with the dynamic behavior of the piers, such as shock or other dynamic force which resemble to earthquake.
Moment-Curvature Analysis
The curve of moment-curvature (M-
) is a group of dots of the amount of moment and curvature which varies in value based on the changes of stress and strain occurring to the structural element sections. In this paper, the theory of momen-curvature by Priestley et al. (1996) was adopted, where a section obtained with a certain degree of axial load, and to divide a section in a number of discrete. Each contains of a concrete core (confined concrete), concrete cover (unconfined concrete) and longitudinal reinforcement part. The relationship of M-
can be obtained by increasing the strain on top of the fiber (depressed) in such a way to accomplish a balance. The steel stress-strain curve should include allowance for strain hardening.Based on Figure 2(a), the moment-curvature curve for a circular column may be generated for specified values of extreme fiber compression strain εc by considerations of axial and moment equilibrium. From considerations of axial equilibrium,
n s
xii si D
c D
x bc x fc x bx bcx fcu x dx A f
P
1 2
/ ) 2 /
( ( ) ( ) ( ) (5)
where
x D c
c
c
x
0.5
(6)Antonius, I. Imran, and A. Widhianto
TS2B-18
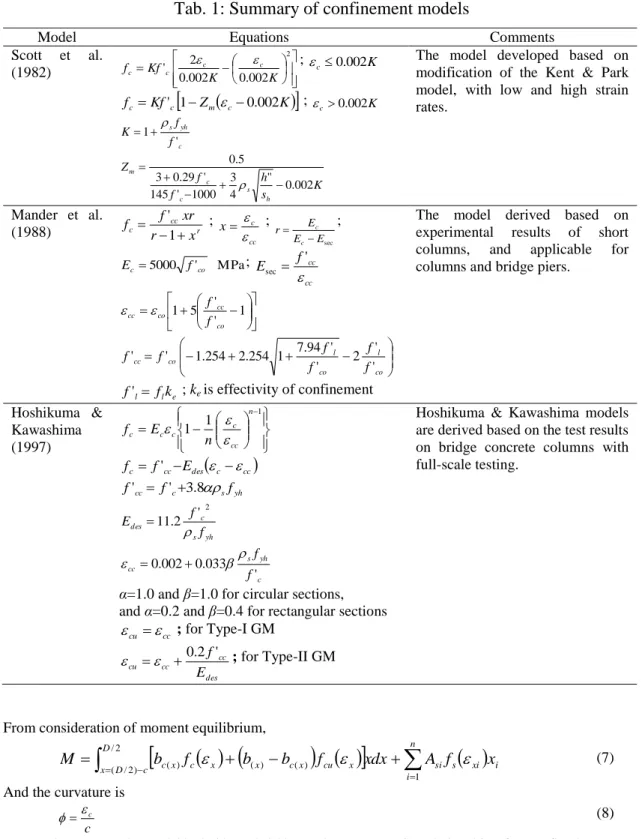
Tab. 1: Summary of confinement models
Model Equations Comments
Scott et al.
(1982)
2
002 . 0 002 . 0 ' 2
K Kf K
fc c c c ; K
c0.002
Z K
Kf
fc 'c1 m c0.002 ; c 0.002K
c yh s
f K f
1 '
s K h f
Z f
h s c
c m
002 .
" 0 4 3 1000 ' 145
' 29 . 0 3
5 . 0
The model developed based on modification of the Kent & Park model, with low and high strain rates.
Mander et al.
(1988) r
cc
c r x
xr f f
1
' ;
cc
x c
;
Esec
E r E
c c
;
MPa ' 5000 co
c f
E ;
cc
f cc
E
'
sec
1
' 5 ' 1
co cc co
cc f
f
co l co
l co
cc f
f f
f f
f '
2 ' '
' 94 . 1 7 254 . 2 254 . 1 ' '
e l
l fk
f' ; ke is effectivity of confinement
The model derived based on experimental results of short columns, and applicable for columns and bridge piers.
Hoshikuma &
Kawashima
(1997)
1
1 1
n
cc c c
c
c E n
f
c cc
des cc
c f E
f '
yh s c
cc f f
f' ' 3.8
yh s
c
des f
E f
'2
2 .
11
c yh s
cc f
f 033 ' . 0 002 .
0
α=1.0 and β=1.0 for circular sections, and α=0.2 and β=0.4 for rectangular sections
cc
cu
; for Type-I GM
des cc cc
cu E
f' 2 .
0
; for Type-II GM
Hoshikuma & Kawashima models are derived based on the test results on bridge concrete columns with full-scale testing.
From consideration of moment equilibrium,
s
xi in
i si D
c D
x bc x fc x bx bc x fcu x xdx A f x
M
1 2
/ ) 2 /
( ( ) ( ) ( ) (7)
And the curvature is c
c
(8)
In equations (5) and (7), fc(ε), fcu(ε), and fs(ε) are the stress-strain relationships for confined concrete, unconfined concrete, and reinforcing steel. Ast is the area of a reinforcing bar with distance xi from the centroidal axis. Equation (5) is solved for c by trial and error using the known axial load level P and the specified extreme fiber compression strain. This enables the moment M and curvature ϕ to be calculated directly from equation (7) and (8). The entire moment-curvature curve is generated by specifying a sequence of εc values up to the ultimate compression strain, as given by equation (9),
cc su yh s
cu f
f ' 4 . 004 1 .
0
(9)
Substituting b(x)=b and bc(x)=bc, equations (5) to (8) also apply to rectangular sections.
Antonius, I. Imran, and A. Widhianto
TS2B-19
Fig. 2: Moment-curvature analysis of column sections (Priestley et al 1996) Ductility Measurement
Ductility curvature determined from the Figure 3. The ascending branch is secant to the real curve at 75%
of the maximum moment, and reaches the maximum moment to define the yield curvature for ϕy. The failure of the column section is defined at the post peak curvature ϕu, determined based on equation (9). Based on Figure 3, curvature ductility µ is
y u
(10)
CASE STUDY
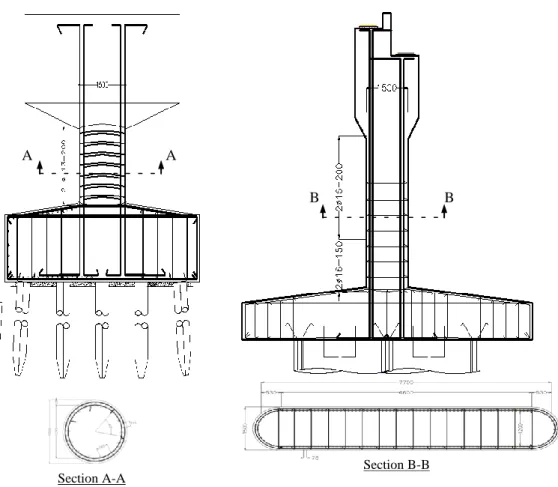
Two Bridge Piers will serve as samples of this study in evaluating the ductility of the bridge pier (Figure 4). The axial load Application of those two bridges that will be represented in the scale P/(f’c.Ag) of 0.12.
The first case study is the Greenwood Bridge in Semarang designed in 2008 and implemented in 2009.
The Piers have a circular section with the diameter of 1500 mm, diameter of spiral types of 13 mm deformed with center to center spacing of 150 mm, concrete strength used is 30 MPa, and yield stress is 320 MPa. Based on the seismic map of 2833:2008, Semarang is located in seismic zone 4 or included in medium earthquake zones. The volumetric ratio of installed have
(a) circular column (b) rectangular column
Curvature s
0.75Mmax
Moment
(a) Co mp ari so n of co nfi ne me nt mo del 0
Fig. 3: Curvature ductility measurement
Antonius, I. Imran, and A. Widhianto
TS2B-20 Other evaluated piers in a strong earthquake zone are in the Srowol bridges, Magelang, Central Java, which has a total length of 90 meters. The Srowol bridge was designed and implemented in 2011, and has a semi-oval wall section. Its Hoop confined reinforcement Types have a diameter of 16 mm, 150 mm distance and melting voltage at 320 MPa .
In this paper, the value of curvature ductility proposed by Sharma et al (2005) at least 16, was adopted as the reference for seismic resistance design of piers.
RESULTS AND DISCUSSION
Table 2 shows the results of the analysis of both bridge piers above. The moment capacity of Greenwood bridge pier sections shows that the prediction moment based on confinement model of Mander is the highest compared with the prediction moment of other confinement models. Curvature ductility resulted from Greenwood bridge pier design (actual) has the value above 16 when the analysis is conducted with confinement models of Mander and Scott, but it has a value below 16 if conducted with confinement model of Hoshikuma (µ=11.9). However, if the confining steel ratio adjusted to the equations used in SNI in seismic application, curvature ductility sections conducted with all models of confinements has the value above 16. The difference between the values of curvature ductility conducted with both confinement models of Scott Mander and Hoshikuma mainly shown in Figure 5, where the post-peak curve prediction models of Hoshikuma decreased rapidly compared with both other confinement models.
These results indicate that the post peak response proposed by Hoshikuma is more conservative. In general, the value of circular section curvature ductility of Greenwood bridge piers above can be said that the piers have better level of ductility.
Fig. 4: Bridge piers and section details
(b) Pier of Srowol bridge, Magelang, Central Java Section B-B
B B
A A
(a) Pier of Greenwood bridge, Semarang Section A-A
A A
Antonius, I. Imran, and A. Widhianto
TS2B-21
Tab. 2: Results
Piers bridge
Confining steel
Long.
steel
Curvature ductility (µ) D -s fy
(MPa)
Volumetric ratio (ρ) Scott Mander Hoshikuma
Actual SNI static
SNI
seismic Actual SNI
seismic Actual SNI
seismic Actual SNI seismic Greenwood
(Circular) 13-150 320 0.5 0.7 1.2 50D25 17.6 17.9 17.6 17.5 11.9 16.8 Srowol
(Wall) 16-150 320 0.5 0.1 0.8 240D22 16.8 18.5 15.4 15.5 10.9 14
0 1 2 3 4 5 6 7 8 9 10
0 0.02 0.04 0.06 0.08 0.1
Curvature (1/m)
Moment (10^3) (kN-m)
Mander Scott Hoshikuma
(a) Comparison of confinement models
Scott model
0 1 2 3 4 5 6 7 8 9 10
0 0.02 0.04 0.06 0.08 0.1
Curvature (1/m)
Moment (10^3) (kN-m)
SNI actual
(b) Moment-curvature curves of Scott model
Mander model
0 1 2 3 4 5 6 7 8 9 10
0 0.02 0.04 0.06 0.08 0.1
Curvature (1/m)
Moment (10^3) (kN-m)
SNI actual
(c) Moment-curvature curves of Mander model
Hoshikuma model
0 1 2 3 4 5 6 7 8 9 10
0 0.02 0.04 0.06 0.08 0.1
Curvature (1/m)
Moment (10^3) (kN-m)
SNI actual
(d) Moment-curvature curves of Hoshikuma model
Fig. 5: Moment-curvature curves for piers with circular sections
The Moment capacity of Srowol bridge piers that have a wall-like shapes based on all model confinement are about the same or even coincides, especially in ascending branch of curves (Figure 6a). The sectional curvature ductility predictions based on actual design of confining steel and using SNI equation shows that the confinement model of Mander predicts the value slightly below 16, all Scott models are above 16 while the predictions value based on model of Hoshikuma is under 16. In accordance with the description of the Greenwood bridge pier curvature ductility above (circular section), confinement models of Hoshikuma look very conservative in terms of the sectional ductility prediction (see Figure 6).
Antonius, I. Imran, and A. Widhianto
TS2B-22 Actual
0 10 20 30 40 50 60 70 80 90
0 0.01 0.02 0.03 0.04 0.05 0.06 0.07 0.08
Curvature (1/m)
Moment (10^3) (kN-m)
Hoshikuma Mander Scott
(a) Comparison of confinement models
Scott model
0 10 20 30 40 50 60 70 80 90
0 0.02 0.04 0.06 0.08
Curvature (1/m)
Moment (10^3) (kN-m)
Actual SNI
(b) Moment-curvature curves of Scott model
Mander model
0 10 20 30 40 50 60 70 80 90
0 0.02 0.04 0.06 0.08
Curvature (1/m)
Moment (10^3) (kN-m)
Actual SNI
(c) Moment-curvature curves of Mander model
Hoshikuma model
0 10 20 30 40 50 60 70 80 90
0 0.02 0.04 0.06 0.08
Curvature (1/m)
Moment (10^3) (kN-m)
Actual SNI
(d) Moment-curvature curves of Hoshikuma model
Fig. 6: Moment-curvature curves for piers with rectangular sections CONCLUSIONS
The Sectional bridge pier curvature ductility predictions based on general confinement models, models of Mander and Scott are the closest, both for circular and rectangular sections. Besides, their curvature ductility values are quite reliably for piers in medium or strong earthquake zones. The comparison of confined reinforcement volumetric ratio based on SNI equation also shows good curvature ductility values. Confinement models proposed by Hoshikuma tend to be underestimated in terms of post-peak response prediction, resulting in lower curvature ductility prediction.
REFERENCES
ACI Committee 318 (2011). Building Code Requirements for Structural Concrete (ACI-318-11) and Commentary (318R-11), American Concrete Institute, Farmington Hills, MI.
Andrewes, B., Shin, M. and Wierschem, N. (2010). Active Confinement of Reinforced Concrete Bridge Columns Using Shape Memory Alloys, ASCE Journal of Bridge Engineering, Vol.15 (1), 81-89.
Hoshikuma, J., Kawashima, K, Nagaya and Taylor, A.W. (1997). Stress-Strain Model for Confined Reinforced Concrete Bridge in Piers, J. of Structural Eng, ASCE, V.123, No.5, May 1997, pp.624-633.
Indonesian National Standard (2008). Design Standard of Earthquake Resistant for Bridge, SNI 2833:2008 (in Indonesian).
Indonesian National Standard (2002), Methods of Calculation of Reinforced Concrete for Building, SNI- 03-2847-2002, 2002 (in Indonesian).
Mander, J.B., Priestley, M.J.N. and Park, R. (1988). Theoritical Stress-Strain Model for Confined Concrete, J. of Structural Eng., V.114, No.8, August 1988, 1804-1824.
Priestley, M.J.N., Seible, F, and Calvi, G.M. (1996). Seismic Design and Retrofit of Bridges; John Wiley
& Sons, Inc.
Antonius, I. Imran, and A. Widhianto
TS2B-23 Scott, B.D., Park, R. and Priestley, M.J.N. (1982); Stress-Strain Behavior of Concrete Confined by Overlapping Hoops at Low and High Strain Rates; ACI Journal, January-February 1982, 13-27.
Sharma, U.K., Bhargava, P, Singh, S.P., and Kaushik, S.K. (2005). Confinement Reinforcement Design for Plain and Fibre Reinforced High Strength Concrete Columns, Journal of Advanced Concrete Technology, Vol. 5(1), 113-127.
Wehbe, N.I., Saiidi, M.S. and Sanders, D.H. (1999). Seismic Performance of Rectangular Bridge Columns with Moderate Confinement, ACI Structural Journal, Vol. 96(2), 248-258.
NOTATIONS
Ag = gross concrete area of cross section in column As = area of cross section of longitudinal reinforcement dc = concrete core diameter
f’c = compressive strength of standard cylinder test at 28 days fy = yield strength of confining steel (spiral or hoop)
fyl = yield strength of longitudinal reinforcement μ = curvature ductility ratio of confined concrete ρs , ρ = volumetric ratio of confining steel
s = spacing of confining steel measured centre-to-centre of the steel