Chapter 6
Hydrogen binding sites in
potassium intercalated graphite
6.1 Introduction
Hydrogen adsorption in KC24has a relatively flat isosteric heat of adsorption (see Fig. 4.2).
A relevant question is whether this behavior can be traced to the presence of a narrow distribution of nearly-homogeneous adsorption sites in the KC24 host structure. Due to the exceptionally large incoherent cross-section of hydrogen, inelastic-incoherent-neutron scattering (IINS) can be used effectively as a local structural probe for the adsorbed H2 molecules. Phonon and rotational energy levels of the adsorbed H2 molecules can both be determined from IINS spectra and compared with calculated values. In this chapter, IINS spectra of the KC24(H2)xare measured over a low energy range (0–2.5 meV), an intermediate energy range (5–45 meV), and a high energy range (35–100 meV). We investigate whether the one-dimensional hindered rotor model can successfully describe peak positions in the low and high energy ranges. In the intermediate energy range, we attempt to describe the rich spectral features in terms of multi-excitations of phonon and rotational energy levels.
We also assess the significance of rotational-translation coupling on the dynamics of the KC24(H2)x system. Finally, the ground state potential energy surface of the theoretical
KC28(H2)1 system is mapped from first-principles calculations, and energy levels of phonon and rotational modes are estimated.
6.2 Background
6.2.1 Rotational energy levels of the free hydrogen molecule
The free hydrogen molecule can be modeled as a rigid quantum rotor, which is well-known textbook example [110]. The eigenfunctions for the rigid rotor are the spherical harmonics Ylm(θ, φ), where l is the principal angular momentum quantum number and m has the allowed values {0,±1,±2, . . .±l}. The quantized energy levels for the rigid rotor are
El,m=l(l+ 1)Brot. (6.1)
The energy levels are (2l+ 1)-fold degenerate in quantum numberm. For the H2 molecule, the rotational constant is equal to
Brot = ~
4πµd2 = 7.35 meV, (6.2)
where µ= 0.5 is the reduced mass, andd= 74.6 pm is the H2 bond length. This model is appropriate for a free H2 molecule in a spherically symmetric potential or in a vacuum.
6.2.2 Ortho- and para-hydrogen
The nuclear spin and rotational degrees of freedom of the H2 molecule are coupled due to the quantum mechanical symmetry restrictions. Since individual hydrogen nuclei are indis- tinguishable fermions, the total H2 wavefunction must be antisymmetric under exchange.
The total wavefunction is constructed from both the rotational and nuclear spin wavefunc- tions,ψtotal=Ylm(θ, φ)ψspin. The symmetry of the rotational wavefunction under exchange can be written as Ylm(π−θ, φ+π) = (−1)lYlm(θ, φ), which means that even values of l correspond to symmetric wavefunctions while odd values of lcorrespond to antisymmetric wavefunctions. The symmetric nuclear spin wavefunction (called ortho-hydrogen, oro-H2) corresponds to the triplet state with total spin 1. The antisymmetric nuclear spin state (called para-hydrogen, or p-H2) corresponds to the singlet state with total spin 0. In or- der for ψtotal to be anti-symmetric, even rotational states l = 0,2,4, . . . must be paired with the antisymmetric nuclear spin state (para-H2). Similarly, the odd rotational states l = 1,3,5, . . . must be paired with the symmetric nuclear spin state (ortho-H2). Normal hydrogen contains a 3:1 mixture ofortho- andpara-hydrogen at room temperature.
6.2.3 One-dimensional hindered diatomic rotor
For an H2 molecule in an anisotropic potential, Eq. 6.1 no longer describes the rotational energy levels. The simplest case is the one-dimensional hindered rotor model [52, 53]. The Hamiltonian for an H2 molecule in this potential is given by
Hˆ = Lˆ2 2I +V2
2 (1−cos 2θ), (6.3)
where V2 is the potential energy barrier height, ˆL is the angular momentum operator, I is the moment of inertia, and θ is the angle that the molecular axis makes with the z- axis. This one-dimensional Schr¨odinger equation is solved by diagonalizing the Hamiltonian matrix. After expanding the rotational potential with a spherical harmonics basis set, the
60
50
40
30
20
10
0
Transition Energy (meV)
-150 -100 -50 0 50 100 150
V2 (meV)
l,m (0,0 → 1,0) l,m (0,0 → 1,±1)
Perpendicular to surface (1D)
Parallel to surface (2D)
Figure 6.1: One-dimensional hindered rotor model. Rotational energy level transitions for an H2 molecule from anl, m(0,0) initial state to the first two excited states. Plotted as a function of the barrier height parameterV2. The degeneratel, m(1,+1) andl, m(1,−1) states are offset slightly for clarity.
Hamiltonian matrix elements are written
Hl0,m0,l,m =l(l+ 1)Brotδl0,lδm0,m+hYlm0 0|V22(1−cos 2θ)|Ylmi. (6.4)
When V2 is positive, the H2 molecule aligns perpendicular to the surface (1D case), and when V2 is negative, the molecule prefers to align parallel to surface (2D case). One effect of an anisotropic potential is a lifting of the degeneracy of rotational energy levels. This is illustrated in Fig. 6.1, which plots the rotational energy level transitions from a l, m(0,0) initial state as a function of V2. The energy levels of l, m(1,±1) are still degenerate, but the l, m(1,0) level is not. This model predicts that the single l(0 → 1) transition of free H2 will be split into two peaks when the molecule is placed in a one-dimensional rotational potential energy well.
15
10
5
0
Form-factor (barn)
5 4
3 2
1 0
Q (Å-1) F0-0
F1-0 F1-1
F0-1
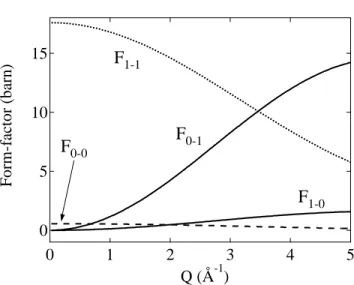
Figure 6.2: Molecular form factors for pure rotational transitions of the H2 molecule, plotted as a function of momentum transfer. Only the transitions for the ground and first excited state are plotted.
6.2.4 Scattering law for rotational transitions of molecular hydrogen
Neutrons interact strongly with the H2 molecule by a spin-flip transition. By flipping the nuclear spin state from paired to unpaired (or visa versa), the neutron thereby induces a transition in the H2 rotational level. The spin of the neutron (= ±1/2) must flip sign in this scattering event. For example, thel(0→1) transition has the following mechanism,
(↑↓)l=0H
2 + (↑)Eni −−→σinc (↑↑)l=1H
2 + (↓)Enf , (6.5)
where the neutron energy loss is given by ∆E0−1=Ei−Ef. The double differential neutron scattering cross-section for a pure rotational transition of free H2 has been calculated by Young and Koppel [111]. The basic idea is to use Fermi’s “golden rule” to calculate the matrix element for a transition in which one or more more quantum numbers of the scatterer are changed and an equivalent amount of energy is transferred to the neutron. It is assumed that vibrations and rotations of the H2 molecule are not coupled and that the molecule is in
the ground vibrational state. For a transition between the initial and final rotational levels l andl0, the double differential scattering cross-section is expressed as
d2σ dΩdE = k
k0Fl−l0(Q) exp(−2W)δ(E−El0 +El), (6.6)
where k and k0 are the magnitudes of the final and initial neutron wavevectors, W is the Debye-Waller factor, Fl−l0(Q) is the molecular form factor, and the delta function enforces conservation of energy. Based on the Young-Koppel model, the molecular form factors are given by
F0−0 = 4b2cj02(Qd/2) (6.7)
F0−1 = 12b2incj12(Qd/2) (6.8)
F1−0 = 43b2incj12(Qd/2) (6.9)
F1−1 = 4 b2c+23b2inc 2j22(Qd/2) +j02(Qd/2)
, (6.10)
wherebcandbincare the coherent and incoherent scattering lengths,dis the H2bond length, and ji is the ith order spherical Bessel functions of the first kind. These molecular form- factors are plotted in Fig. 6.2. An important feature of this analysis is that the l(0→ 1) transition (and also the l(1→1) non-transition) is weighted by the large incoherent scat- tering length. However, the l(0→ 2) transition (and l(0→0) non-transition) is weighted by the negligibly small coherent scattering length. This means that the IINS spectrum of pure H2 will contain a large peak at 14.7 meV for the l(0 → 1) transition. Further, for scattering events in which the rotational level is unchanged (e.g., pure phonon excitation), scattering from p-H2 is negligibly small compared to o-H2 since they are weighted by bc
and binc respectively. However, if the transition of p-H2 consists of a one-phonon + one- rotational multi-excitation, then the scattering cross-section will still contain the largebinc factor. Therefore, the strict selection rules for rotational transitions of molecular hydrogen can be useful in interpreting the features of the IINS spectrum.
Coupling between rotational level and nuclear spin states is absent in the HD molecule since the two nuclei are distinguishable. The rotational constant for HD is equal toBrot= 5.54 meV, which means that the l(0→ 1) transition is shifted down in energy by a factor of three-fourths compared to H2. The D2 molecule obeys Bose statistics in which the l= 0,2,4, . . . states correspond toortho-deuterium and thel= 1,3,5, . . . states correspond to para-deuterium. The rotational constant for D2 is Brot = 3.70 meV, meaning that the l(0→1) transition is shifted by a factor of one-half compared to H2.
6.3 Experimental methods
Inelastic neutron scattering experiments on the KC24(H2)xsystem were performed using the FANS instrument at NCNR [80], an indirect geometry spectrometer described in Sec. 3.2.4.
Sample synthesis, handling and setup were the same as described in Sec. 5.3. The mass of KC24 used for this experiment was 2.935 g. A cylindrical aluminum sample can was used without an annular insert, resulting in a larger sample thickness and consequently a significant amount of multiple scattering. Due to the lack of Q-resolution on the FANS instrument, and the qualitative nature of the measurements, this was considered acceptable.
The FANS instrument contains two types of focusing monochromators bracketed between two S¨oller collimators of 20 inch divergence. The PG(002) monochromator can measure energy transfers of 5 meV to 45 meV, while the Cu(220) monochromator can measure energy transfers of 35 meV to 100 meV. It is necessary to correct the spectra for a fast-background,
caused by neutrons reaching the detector with incident energies higher than the filter cut- off limit. This fast-background contribution is easily determined by placing a cadmium shield between the sample can and the detector bank and measuring the neutron counts.
Furthermore, the PG(002) monochromator suffers from some λ/2 contamination (due to higher order Bragg reflections), which can create spurious peaks at energies ofE/4 if there is strong scattering from the sample at high energies. These features are sharper than the resolution, and can easily be identified.
To simplify interpretation of the FANS spectra, p-H2 was used instead of normal H2. Thep-H2 was prepared from normal H2 by holding liquid hydrogen in a sample cell with a paramagnetic catalyst at about 10 K for at least 72 h prior to the experiment. To dispense the preparedp-H2, the temperature of the holding cell was slowly increased until a specific vapor pressure was reached. In this manner, small aliquots of p-H2 were introduced to the KC24sample until the desired loading was reached. Background measurements on bare KC24 were first performed, followed by measurements on several KC24(pH2)x compositions. Data were also collected on KC24(HD)0.5 and KC24(D2)0.5 compositions. Hydrogen was loaded at 60 K, and the sample was allowed to equilibrate for at least 20 min before lowering to base temperature. All spectra were collected at 4 K. To isolate scattering from the adsorbed H2, background scattering from bare KC24 was subtracted and the fast background was also subtracted.
Low energy-transfer measurements were performed on the DCS spectrometer. The setup was identical to that described in Sec. 5.3 in reference to the quasielastic measurements, with the exception of the incident neutron wavelength. For the current inelastic measurements, the DCS spectrometer was operated in low resolution mode with an incident neutron wave- length of 4.8 ˚A, a chopper speed ratio setting of 2/3, and a minimum sample-detector time
12
10
8
6
4
2
0
Neutron Intensity (arbitrary units)
2.0 1.5
1.0 0.5
Energy Loss (meV)
x = 0.25 x = 0.5 x = 0.75 x = 1 x = 1.25 x = 1.5 x = 1.75 I
II III
IV
V
Figure 6.3: Low-energy IINS spectra of KC24(H2)x as a function of increasing H2 concentration.
Scattering from bare KC24 has been subtracted. Spectra are vertically offset for clarity.
of 1500. These settings give a resolution of about 120µeV at the elastic line and a resolution of about 90µeV at an energy transfer of 1 meV. The maximum energy loss that can be mea- sured is roughly 2.79 meV. The momentum-transfer range is about 0.1 ˚A−1 to 2.5 ˚A−1 at the elastic line, and roughly 0.7 ˚A−1 to 1.8 ˚A−1 at the maximum energy transfer. The IINS spectra were reduced from theS(Q, ω) by summing over the complete momentum-transfer range and grouping the counts into energy bins of 0.01 meV width. For diffraction patterns, the S(Q, ω) was summed over the nearly-elastic interval −0.1 meV to 0.1 meV and binned into 0.008 ˚A−1 increments. Once again, scattering from H2 was isolated by subtracting the scattering from bare KC24. Normal H2 was used for all measurements on DCS.
5 4 3 2 1 0
2
1
0
Intensity (arb. units)
2.5 2.0
1.5 1.0
0.5
Energy loss (meV)
4 3 2 1
0 0.5 1.0 1.5 2.0 2.5
Energy loss (meV) 3
2
1 0
Intensity (arb. units)
4 3 2 1 0
Intensity (arb. units)
4 3 2 1 0
Intensity (arb. units)
6 5 4 3 2 1 0
x = 0.25 x = 0.5 x = 0.75 x = 1.0
x = 1.25 x = 1.5 x = 1.75
I
II
III I
I I
II
II
II III III
III IV
IV
I
I
I
II
II III
III
III IV
IV
IV
II V
Figure 6.4: Decomposition of the low-energy-transfer IINS spectra of KC24(H2)x into a sum of Gaussian curves (plus a flat background which is not pictured).
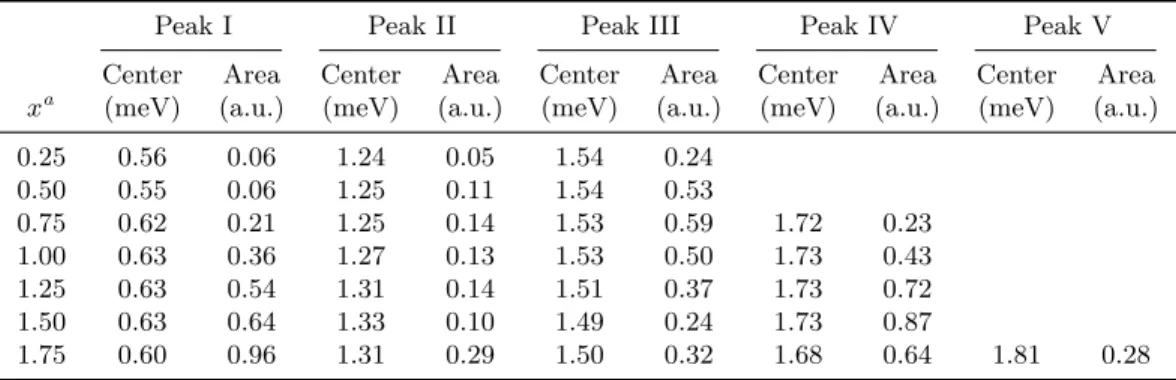
Table 6.1: Summary of peak positions and peak areas of the low-energy IINS spectra
Peak I Peak II Peak III Peak IV Peak V
Center Area Center Area Center Area Center Area Center Area xa (meV) (a.u.) (meV) (a.u.) (meV) (a.u.) (meV) (a.u.) (meV) (a.u.)
0.25 0.56 0.06 1.24 0.05 1.54 0.24
0.50 0.55 0.06 1.25 0.11 1.54 0.53
0.75 0.62 0.21 1.25 0.14 1.53 0.59 1.72 0.23
1.00 0.63 0.36 1.27 0.13 1.53 0.50 1.73 0.43
1.25 0.63 0.54 1.31 0.14 1.51 0.37 1.73 0.72
1.50 0.63 0.64 1.33 0.10 1.49 0.24 1.73 0.87
1.75 0.60 0.96 1.31 0.29 1.50 0.32 1.68 0.64 1.81 0.28
aDenotes the H2 composition of a KC24(H2)x sample
bErrors not listed for the fit parameters
6.4 Results
6.4.1 Low-energy IINS spectra
Low-energy-transfer IINS spectra of KC24(H2)x collected on DCS are shown in Fig. 6.3.
Background scattering from bare KC24 has been subtracted. The spectra contain at least five distinct peaks whose intensities vary with H2 concentration. To determine peak loca- tions and areas, the spectra were decomposed into a sum of Gaussian curves plus a flat background. The results of these fits are shown in Fig. 6.4. Even at the lowest hydrogen concentration, there are three distinct peaks. Peaks I and II appear to shift gradually to higher energy as the hydrogen concentration is increased. Due to the finite instrument reso- lution, though, it is not really possible to distinguish the fine structures of peaks containing features narrower than 90µeV. Interestingly, there is a fairly strong transfer of intensity from peak III to peak IV as the H2 loading is increased. At the highest hydrogen loadings, peak IV appears to split into peak IV and peak V. The presence of distinct low-energy peaks in the IINS spectrum are likely an indicator of distinct adsorption sites for H2 in KC24 as described in greater detail in the discussion section. Changes in the fine structure of peaks may be caused by increasing interactions between the H2 molecules as the concen-
6000
5000
4000
3000
2000
1000
0
Intensity (arb. units)
12 10 8 6 5 4 3
d-spacing (Å)
001 002 003
x = 0 x = 0.25 x = 0.5 x = 0.75 x = 1 x = 1.25 x = 1.5 x = 1.75
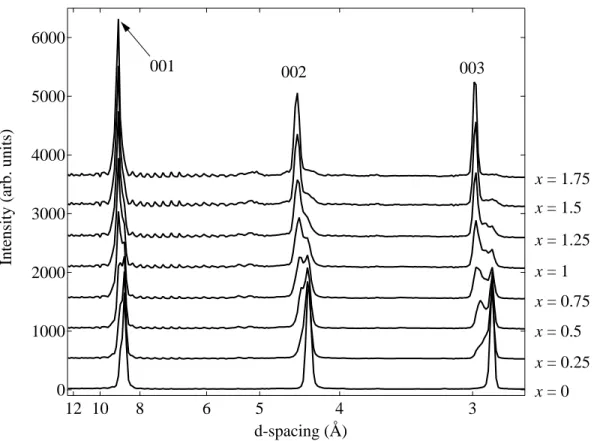
Figure 6.5: Diffraction pattern of KC24(H2)x measured on DCS at 4 K.
tration increases. However, the collapse of peak III, and associated growth of peak IV, may indicate a reconstruction of the in-plane KC24lattice. Similar behavior has been noted for the CsC24(H2)x system [112]. Peak positions and areas for the low-energy IINS spectra are summarized in Table 6.1.
6.4.2 Diffraction pattern from low-energy IINS spectra
The DCS instrument contains an angular array of detectors from which diffraction informa- tion can be obtained by the time-of-flight method. It should be emphasized that DCS isnot optimized as a diffractometer, and that the resolution in Q is quite coarse. Nevertheless, a qualitative diffraction pattern can be extracted from the measured S(Q, ω) by plotting the integrated intensity under the elastic peak as a function of momentum-transfer. The
diffraction pattern obtained from the low-energy IINS measured on DCS is illustrated in Fig. 6.5. For the x = 0 filling, the (001), (002), and (003) reflections have a d-spacing of 8.73 ˚A, 4.33 ˚A, and 2.90 ˚A, respectively. This translates to an average KC24interlayer spac- ing of 5.34 ˚A. As H2 is introduced to the sample, there is a gradual transfer of intensity to the second set of peaks with a slightly largerd-spacing. The fully hydrogenated sample has an interlayer spacing of 5.63 ˚A. In other words, the adsorption of H2 causes the KC24layers to expand by about 5%. These results are fully consistent with data reported in Ref. [64].
Given the lowQ-resolution of the instrument, a quantitative analysis of diffraction data is not appropriate. Nevertheless, the diffraction data verifies three things. First, the KC24 sample is not contaminated by stage-1 or stage-3 compounds. Second, hydrogen is being adsorbed between the layers of KC24 resulting in an expansion of the interlayer spacing.
Finally, the fact that there is a transfer of intensity between two distinct, co-existent peaks, rather than the shift of a single peak, implies that KC24(H2)x contains co-existent regions of the hydrogenated and pure KC24 phase.
6.4.3 Intermediate and high-energy IINS spectra
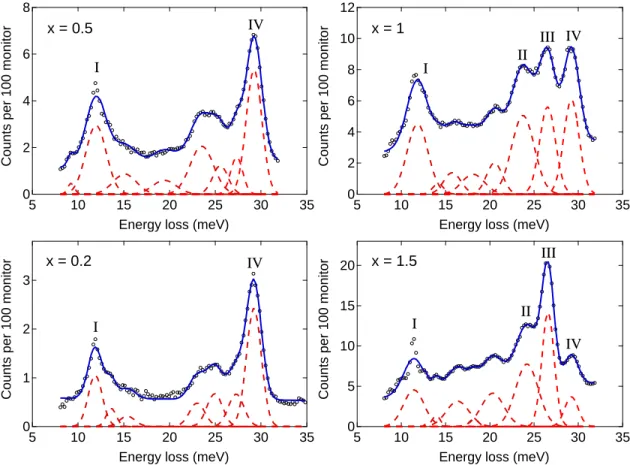
Intermediate-energy IINS spectra of KC24(pH2)x were measured as a function of hydrogen filling on the FANS instrument using the PG(002) monochromator. They are displayed in Fig. 6.6. As explained in the methods section, para-hydrogen was used instead of normal hydrogen to simplify the interpretation of spectral peaks. To determine peak positions and areas, the intermediate-energy spectra were fitted to a sum of Gaussian curves plus a flat background, and the fits are indicated in the figure. At the two lowest hydrogen fillings of x= 0.2 andx= 0.5, the spectra appear similar, except for the overall increase in intensity with hydrogen concentration. Peak I (11.9 meV) and Peak II (29.2 eV) are the dominant
3
2
1
0
Counts per 100 monitor
35 30 25 20 15 10 5
Energy loss (meV) 8
6
4
2
0
Counts per 100 monitor
35 30 25 20 15 10 5
Energy loss (meV)
12 10 8 6 4 2 0
Counts per 100 monitor
35 30 25 20 15 10 5
Energy loss (meV) 20
15 10 5 0
Counts per 100 monitor
35 30 25 20 15 10 5
Energy loss (meV) x = 0.2
x = 0.5 x = 1
x = 1.5
I
IV
III IV
I I I
II II IV
III
IV
Figure 6.6: Intermediate-energy IINS spectra of KC24(pH2)xas a function of hydrogen filling. Solid blue lines represent fits to a sum of Gaussian curves plus a flat background. Individual Gaussian curves are plotted as dashed red lines. Flat background is not shown. Data points below 8 meV and above 32 meV were removed prior to the nonlinear regression fit.
features. Nascent peaks at 23 meV and 25 meV are somewhat difficult to distinguish from the large background intensity. As hydrogen filling is increased to x = 1, two new peaks emerge at 23.7 meV (Peak II) and 26.5 meV (Peak III). As hydrogen composition is further increased to x= 1.5, there is a strong increase in Peak III, but little increase in the other peaks. The sharp feature that appears at Peak I at thex= 1.5 filling may be an instrument artifact fromλ/2 contamination of the incident beam, due to the large transition ca. 50 meV.
In all of the intermediate-energy spectra, there is a large background intensity which may be due to the overlap of closely-spaced peaks. With the modest energy resolution of FANS (i.e., 1.2 meV), however, individual peaks are often difficult to distinguish. Peak positions and areas for the intermediate-energy IINS are summarized in Table 6.2.
High-energy IINS spectra of KC24(pH2)xare plotted in Fig 6.7 as a function of hydrogen filling. Spectra were only measured forx= 0.5 andx= 1.0. The dominant feature in both spectra is Peak VII, which has a greater intensity than any other peak. It should be noted that the curves in Fig 6.7 are not artificially offset. The vertical offset is due to the large background intensity, which may indicate a large amount of H2 recoil associated with the scattering. At the higherx= 1.0 filling, upon closer examination, Peak VII appears to have a fine structure comprising two sub-peaks. The increase in intensity of the lower-energy sub- peak is what causes the apparent shift of the total peak from 50.9 meV atx= 0.5 to 49.4 meV atx= 1. Peak positions and areas for the high-energy IINS spectra are listed in Table 6.2.
6.4.4 IINS spectra of HD and D2 adsorbed in KC24
The richly-structured IINS spectra of KC24(pH2)x contain numerous overlapping peaks, making it difficult to accurately identify and interpret the origins of the spectral features.
One method of obtaining more information from the inelastic spectra is to substitute the
100
80
60
40
20
0
Counts per 100 monitor
110 100
90 80
70 60
50 40
30
Neutron Energy Loss (meV) VIIa
KC24(H2)0.5 KC24(H2)1
KC24 V
VI VII
VIII IX
Figure 6.7: High-energy IINS spectra of KC24(pH2)xmeasured with the Cu(022) monochromator.
Solid lines represent fits to a sum of Gaussian curves plus flat background. Individual curves are not manually offset.
Table 6.2: Summary of peak positions and peak areas of the intermediate and high-energy IINS spectra
x= 0.2 x= 0.5 x= 1.0 x= 1.5
Center Area Center Area Center Area Center Area Peak (meV) (a.u.) (meV) (a.u.) (meV) (a.u.) (meV) (a.u.)
I 11.9 2.02 11.8 5.84 11.8 13.4 11.4 13.2
II 23.7 16.2 24.2 24.8
III 26.5 12.7 26.6 24.6
IV 29.2 4.94 29.3 8.71 29.2 13.3 29.2 7.10
V 39.4 2.83 39.4 71.6
VI 43.0 21.1 43.5 71.3
VII 50.9 93.8 49.4 360.
VIII 58.5 7.76 59.1 33.2
IX 85.2 27.2 84.7 37.9
aPeak parameters were obtained from fitting the spectra to a sum of Gaussian curves plus a flat background.
bPeaks I–IV are from the PG(002) spectra (see Fig. 6.6), while peaks V–IX are from the Cu(220) spectra (see Fig. 6.7). The integrated areas from the two different spectra are not directly comparable.
H2 adsorbate with a hydrogen isotope containing a different mass, specifically HD and D2. Shifts in peak positions as a function of mass can sometimes reveal the rotational or vibrational origin of a spectral peak. For a pure rotational transition of a free diatomic molecule, energy is proportional to the inverse of the reduced mass (see Eq. 6.2). Relative to H2, the rotational transitions of HD will be reduced by a factor of 0.75, and for D2 they will be reduced by a factor of 0.5. For a whole-molecule vibrational mode (i.e., governed by a power-law potential V(x) =Ax2), the energy levels scale with mass as m−1/2. Relative to H2, the vibrational transitions of HD will be reduced by a factor of p
2/3 ≈ 0.82, and for D2 the transitions will be reduced by a factor ofp
1/2≈0.71.
IINS spectra were collected for HD and D2 samples.1 These spectra are compared with thep-H2 spectra in the three panels of Fig. 6.8. Ratios between the peak positions for the three isotopes are summarized in Table 6.3. Unfortunately, it is difficult to identify the peaks for each isotope which correspond to the same transition. This is especially true for HD, which contains a complex spectrum due to the absence of symmetry restrictions on the rotational and nuclear spin states. Figure 6.8 contains my best guess for the peaks which correspond to equivalent transitions. Peaks are labeled with either an “a”, “b” or
“c” depending on whether the isotope is H2, HD, or D2, respectively.
The only peak ratio which can be easily categorized is Peak I, which seems to follow the m−1/2 scaling expected for a pure vibrational transition. However, the cross-section ofp-H2 for a pure vibrational transition (with no change in the rotational level) is proportional to σcand is very small (see Sec. 6.2.4). Peaks originating from pure phonon excitations should not be visible in the spectrum of KC24(pH2)0.5. Since the cross-section for a one-phonon
1Due to the smaller scattering cross-section of deuterium, it was necessary to collect data for a consider- ably longer time period. Even with longer collection times, the error bars on the D2 spectra are much larger than those of the other samples.
6
4
2
0 10 20 30 40
Neutron Energy Loss (meV) 0.6
0.5 0.4 0.3 0.2 0.1 0.0 3.0 2.5 2.0 1.5 1.0 0.5 0.0
KC24(H2)0.5 KC2424(HD)0.5 KC24(D2)0.5
Counts per 100 monitorCounts per 100 monitorCounts per 100 monitor
Ia
IIa IIIa
IVa Va Ic
Ib
IIc
IIb IIIc
IIIb IVb
Vb VIb
VIIb VIIc
Figure 6.8: Intermediate-energy IINS spectra of D2, HD, and p-H2 adsorbed in KC24. Solid lines represent fits to a sum of Gaussian curves plus a flat background. The Gaussian curves are shown as dashed, red lines. Fit components not corresponding to a clear, discrete peak are not illustrated.
Peaks thought to correspond to the same transition are labeled with the same Roman numeral, with an “a”, “b” or “c” to identify the isotope.
Table 6.3: Peaks positions in the intermediate IINS spectra for different hydrogen isotopes
H2 HD HD/H2 D2 D2/H2
Peak Positiona Position Ratio Position Ratio
I 11.9 9.36 0.79 8.02 0.68
II 24.1 18.1 0.75 15.9 0.66
III 29.3 20.2 0.69 18.5 0.63
IV 39.9 25.8 0.65
V 43.8 28.0 0.64
VI 33.0
VII 43.0 35.1
aH2 peak positions were obtained from thep-H2spectra.
bPeak positions are reported in units of meV.
cComposition wasx= 0.5 for all isotopes.
5
4
3
2
1
00 10 20 30 40 50
Neutron Energy Loss (meV) 6
5 4 3 2
1 0
Counts per 100 monitor
50 40
30 20
10 0
Neutron Energy Loss (meV) KC24(HD)0.5
KC24(H2)0.5 Energy × 0.82
KC24(D2)0.5
KC24(H2)0.5 Energy × 0.5
KC24(H2)0.5 Energy × 0.71
KC24(H2)0.5 Energy × 0.75 I
III I II
HD D2 III
Figure 6.9: Comparison of the IINS spectra of the p-H2, HD, and D2 loaded samples. Thep-H2 spectra have been rescaled along the energy axis with theµ−1 factor (×0.75 for HD and ×0.5 for D2) of a pure rotational transition and them−1/2factor (×0.82 for HD and×0.71 for D2) of a pure phonon transition.
+ one-rotational multi-excitation in p-H2 contains the large incoherent scattering length, many of the spectra features may therefore be due to multi-excitation transitions.
Isotopic shifts in the IINS spectra are directly compared in Fig. 6.9. The p-H2 spectra are rescaled on the energy axis with the µ−1 factor of a pure rotational transition and the m−1/2 factor of a pure phonon transition. In this manner, peak positions for the isotopes can be directly compared to determine whether there are any good matches. Once again it is evident that none of the peaks (except for Peak I) follow the simple scaling relations expected for a pure phonon or rotational transition.
6.5 Hydrogen bound states studied by DFT
6.5.1 Computational details
To estimate the energy levels of H2 bound states in KC24, first-principles calculations were performed using density function theory (DFT), as implemented in the ViennaAb intioSim- ulation Package [113]. A plane-wave basis set was used with a projector-augmented-wave potential and a Perdew-Burke-Ernzerhof exchange-correlation functional in the generalized gradient approximation (GGA) [114]. Although GGA does not treat the correlations be- tween electron fluctuations which give rise to van der Waals interactions, it can still be used to calculate the electrostatic and orbital interactions. In general, GGA is known to underbind H2 in physisorption systems with significant van der Waals contributions.
The theoretical √ 7×√
7
R19.11°structure with chemical formula KC28was used for the in-plane potassium structure. A stacking sequence for the potassium layers was gener- ated by translating each layer 1.41 ˚A (i.e., equal to the C−C bond length) in the direction of thex-axis.2 This sequence of potassium layers repeats after 21 layers. The graphite stacking
2See the top panel of Fig. 6.13 for the orientation of thexandyaxes.
sequence follows the standard A|AB|BC|CA pattern (see Fig. 2.2a). Three-dimensional pe- riodic boundaries are applied to the unit cell. Thec-axis interlayer spacing of the KC28(H2)1 compound was optimized at 5.4 ˚A, but all other geometrical parameters were fixed at their theoretical values. To sample the Brillouin zone, a Gamma-centeredk-point grid was gen- erated. Based on convergence tests, it was found that a plane-wave basis set energy cutoff of 500 eV and a 8×8×6k-point grid was necessary to obtain an accuracy of 1 meV atom−1. Due to limited computational resources, however, a plane-wave cutoff of 300 meV was used in conjunction with a 4×4×3 k-point grid. Lattice parameters and atom positions were held fixed at their theoretical values for the √
7×√ 7
R19.11° structure. These calcula- tions must therefore be considered as qualitative rather than quantitative. The potential energy surface can still provide useful insights into bound states of the H2 molecule.
6.5.2 Results
Total ground state energies were calculated as a function of H2 center-of-mass position and molecular orientation. First, the potential energy surface of the KC28(H2)1 system was sampled over a grid of 58 positions within the unit cell, with the H2 molecule oriented perpendicular to the basal plane, and vertically centered in the gallery. The results are illustrated in Fig. 6.10. The contribution of both the graphite corrugation potential and the K–H2 interaction are evident from the results. Because the H2 molecule was oriented vertically, the repulsive interactions between the hydrogens and the carbons are substantial.
The local minima are located near the hexagon centers.
The general goal of these first-principles calculations is to determine the energy levels of bound center-of-mass H2 vibrational modes (i.e., phonons). Thus, a complete calcula- tion would involve the construction and diagonalization of the classical, three-dimensional
3.0
2.5
2.0
1.5
1.0
0.5
0.0
y
7 6
5 4
x 3.0
2.5
2.0
1.5
1.0
0.5
0.0
7 6
5 4
-210
-210 -220 -220
-220 -220
-230
-230
-230
-230 -240
-240
-240
-240 -240 -240
-240
-250 -250
-250
-250 -250
-250
-250
-250 -260
-260
-260 -260 -260
-260 -260
-270
-270 -270
-270
-270 Points
sampled
Figure 6.10: Top: Grid of 58 H2 center-of-mass positions within the KC28 unit cell for which the total ground state energy was calculated. Bottom: Potential energy surface constructed from the grid of calculated ground state total energies. The H2 molecule was oriented perpendicular to the graphite basal plane.
force-constant matrix for the H2 center-of-mass at the minimum in the PE surface. This calculation is quite computationally expensive for the large KC28(H1)1 unit cell. An ap- proximation of the phonon energy levels can be calculated from 1D slices through the center-of-mass PE surface.
As shown in Fig. 6.11, one-dimensional slices through the PE surface were calculated along the in-plane paths labeled “scan-1” and “scan-2.” Energies were also calculated along thez-axis (out-of-plane) through the point labeledEminin Fig. 6.11, but are not illustrated.
The H2 molecule was oriented perpendicular to the basal plane for all calculations. The energy minimum for all three scans occurs at point Emin, which has a K–H2 distance of about 2.7 ˚A. Neglecting all other degrees of freedom, the 1D Schr¨odinger equations were solved for the three calculated potential energy wells using the Fourier grid Hamiltonian method [115]. The quantum energy levels are displayed in Fig. 6.11 as dashed lines. For scan 1, the fundamental n(0→1) transition occurs at 8 meV, with an overtone at 26 meV.
For scan-2, the fundamental transition is at 12 meV, with an overtone at 25 meV. For out- of-plane translations, the fundamental transition occurs at 77 meV, well above the spectral peaks under consideration.
The total energy of the H2 molecule was calculated along scan-1 for three different orientations. Results are shown in Fig. 6.12. The ‘tee” and “aligned” orientations are both in-plane, while the “vertical” orientation is out-of-plane. Based on these results, it can be seen that the energy minimum is strongly coupled to the molecular orientation.
Having the H2 molecule aligned towards the potassium increases a repulsive interaction at short separations. This implies that there is a significant amount of rotational-translational coupling in the KC24-H2 system.
The rotational potential was calculated over an 18×24 grid of H2 orientations (θ,φ).
-1.0 -0.5 0.0 0.5 1.0 1.5 2.0 Distance from EminHÅL
0 50 100 150 200 250 300
EnergyHcm-1 L
scan-2
n=0 n=1 n=2
2.5 3.0 3.5 4.0 4.5 5.0 5.5 K-H2 DistanceHÅL
0 200 400 600 800
EnergyHcm-1 L
scan-1
n=0 n=1 n=2 n=3 n=4 scan-1
scan-2 Emin
Figure 6.11: Top: One-dimensional slices through the potential energy surface. The H2 molecule was oriented perpendicular to the basal plane for both scans. Middle: Potential energy well for scan-1. Bottom: Potential energy well for scan-2. Quantum energy levels are plotted as dashed lines. Note that energies are reported in units of cm−1.
2.5 3.0 3.5 4.0 4.5 5.0 5.5 K-H2DistanceHÅL
0 500 1000 1500 2000 2500
EnergyHcm-1 L
Vertical Tee
Aligned Aligned
Tee
Vertical
Figure 6.12: Top: Three different orientations of the H2 molecule as it is moved along the K−H2 axis indicated by the dashed line. Thetee and aligned orientations are both parallel to the basal plane (in-plane), while the vertical orientation is perpendicular to the basal plane (out-of-plane).
Bottom: Total energy of the H2 molecule as a function of K−H2distance for the three orientations of the molecule. Note that energy is reported in units of cm−1.
Figure 6.13: Top: Coordinate system which describes the H2-orientation. The x and y axes are both in-plane, while the z axis is out-of-plane. The H2 center-of-mass is fixed at the energy minimum. Bottom: Contour plot of the rotational potential mapped onto a sphere representing the H2 orientation (φ,θ). This coordinate system is consistent with the one depicted in the top panel.
We defineθ as the angle between the H2 molecular axis and the z-axis, andφas the angle between the x-axis and the projection of the H2 molecular axis along thex-y-plane. For all calculations the H2 center-of-mass was fixed at the minimum energy site roughly 2.7 ˚A from the potassium center and centered between the graphite planes. The calculated orientational potential is illustrated in the bottom panel of Fig. 6.13. The red color corresponds to the energy maximum while the blue color indicates the energy minimum. It is clear that the maximum energy occurs when the H2 molecule is pointed directly at the potassium in an
“aligned” formation. The minimum energy orientation occurs for either a “tee” or “vertical”
formation, with the H2 molecule facing the potassium side-on. The rotational potential is very well-described by a two-dimensional, anisotropic hindered rotor potential,
V (θ, φ) = a+bsin (2φ+c)
2 (1−cos 2θ), (6.11)
where a = 72.92 meV, b = −47.65 meV and c = −158.6°. The extra phase factor, c, does not affect the rotational energy levels of the system and is ignored in the remaining calculations. Hamiltonian matrix elements were calculated for a spherical harmonics basis set,{Y00, Y1−1, Y10, Y11, . . . , Y66}. The resulting 49×49 matrix has the form,3
Hˆ =
E0+hY00|V|Y00i hY00|V|Y1−1i . . . hY00|V|Y66i hY1−1|V|Y00i E1+hY1−1|V|Y1−1i . . . hY1−1|V|Y66i
... ... . .. ...
hY66|V|Y00i hY66|V|Y1−1i . . . E6+hY66|V|Y66i
(6.12)
3For slightly better numerical accuracy, a 64×64 matrix is recommended [116]. Due to the somewhat qualitative nature of the rotational potential, the current matrix size is probably sufficient for estimating the rotational energy levels.
20 40 60 80 100 120 aHmeVL
10 20 30 40 50 60
EnergyLevelsHmeVL
b=30 meV
l=1 l=2
20 40 60 80 100 120
aHmeVL 10
20 30 40 50 60
EnergyLevelsHmeVL
b=47.6 meV
l=1 l=2
20 40 60 80 100 120
aHmeVL 10
20 30 40 50 60
EnergyLevelsHmeVL
b=0 meV
l=1 l=2
20 40 60 80 100 120
aHmeVL 10
20 30 40 50 60
EnergyLevelsHmeVL
b=10 meV
l=1 l=2
Figure 6.14: Energy levels for a two-dimensional, anisotropic hindered rotor model relative to the ground l = 0 state. Energies are plotted as a function of the θ-based rotational barrier, a, and evalulated for four different values of theφ-based azimuthal rotational barrier,b.
whereEl =l(l+ 1)Brot, and the inner products are equal to
hYlm0 0|V|Ylmi= Z 2π
0
Z π 0
Ylm0 0(θ, φ)∗V(θ, φ)Ylm(θ, φ) sinθdθdφ. (6.13)
Eigenenergies were determined from an exact diagonalization of the matrix. In Fig. 6.14 the calculated rotational energy levels for the l= 1 and l= 2 states, relative to the l = 0 state, are plotted as a function of a for two different values of b. For b = 0 we recover the familiar one-dimensional hindered rotor model, in which the l, m(1,±1) energy levels are degenerate. For non-zero values of b this degeneracy is lifted. Transition energies for the calculated orientational potential (a= 72.92 meV, b =−47.65 meV) occur at 4.9 meV,
15.9 meV, 36.4 meV, 38.0 meV and 47.3 meV, consistent with the values reported in Ref. [64].
Unfortunately, these values are clearly inconsistent with the experimental peak positions.
Therefore, introducing a large φ-dependence into the orientation potential does not appear to be realistic. As described in the next section, a simple one-dimensional hindered rotor model, evaluated at three different barrier heights, does a much better job of describing the spectral peaks at both low energies and high energies. One possible explanation is that quantum delocalization of the H2 center-of-mass over the three minimum-energy sites (see Fig. 6.10) results in an effective potential that does not have aφ-dependence [64].
6.6 Discussion
The IINS data of KC24(H2)x contains a complex progression of spectral peaks. Based on previous studies of RbC24 and CsC24 [51, 64, 65, 117, 118], it is known that the low energy peaks (ca. 1 meV) and the high energy peaks (ca. 50 meV) originate from the splitting of the l(0 → 1) rotational transition in the presence of a strong anisotropic field. The one- dimensional hindered rotor model provides a reasonable description of the peak positions, but requires the presence of multiple barrier heights. Referring to Fig. 6.1, it can be verified that a rotational barrier height of 139 meV corresponds to peak positions at 0.56 meV and 52 meV, which does match experimental peak positions in the KC24(H2)0.5 spectrum. Bar- rier heights of 105 meV and 96 meV provide good matches to other peaks in the KC24(H2)0.5 and KC24(H2)1 spectra, as summarized in Table 6.4. These values also compare well with rotational barrier heights determined from first-principles calculations, which varied up to 121 meV for an H2 molecule fixed at the energy minimum in the center-of-mass PE surface.
The need for multiple rotational barrier heights is consistent with the existence of dif-
Table 6.4: Transition energies predicted by the one-dimensional hindered rotor model compared to experimental peak positions for the KC24(H2)0.5 and KC24(H2)1 samples
(a) 1D-type Potential (V2 >0)
KC24(H2)0.5 KC24(H2)1
Barrier Height ∆E1a ∆E2b Barrier Height ∆E1 ∆E2
(meV) (meV) (meV) (meV) (meV) (meV)
139 0.56 (0.55)c 52.0 (50.9) 133 0.63 (0.63) 50.3 (49.4) 105 1.25 (1.25) 42.1 (43.0) 105 1.24 (1.27) 42.1 (43.5) 96 1.55 (1.54) 39.3 (39.4) 96 1.55 (1.53) 39.3 (39.4) 91 1.75 (1.73) 37.7 (39.4) (b) 2D-type Potential (V2 <0)
KC24(H2)0.5 KC24(H2)1
Barrier Height ∆E1 ∆E2 Barrier Height ∆E1 ∆E2
(meV) (meV) (meV) (meV) (meV) (meV)
-49 29.2 (29.3) 10.7 (11.8) -29 23.1 (23.7) 11.8 (11.8) -49 29.2 (29.3) 10.7 (11.8)
a∆E1 refers to thel, m(0,0→1,0) transition.
b∆E2 refers to thel, m(0,0→1,±1) transition.
cExperimental peak positions are listed in parentheses.
ferent adsorption sites in KC24. At the dilute x = 0.25 composition, the three distinct low-energy peaks originate from the dominant H2-sorbent interaction, with little contri- bution from H2-H2 interactions. Each peak can be assigned to an adsorption site with a specific barrier to rotation. Simultaneous filling of these distinct sorption sites is indicated by the IINS data, as opposed to the preferential filling of the less-hindered sites.4 In the
√7×√ 7
R19.11° structure used for the first-principles calculations, there is only one type of sorption site. As described in Sec. 2.3, though, the relaxed close-packed structure illustrated in Fig. 2.3b is the most compelling structure model for KC24. For this structure there are a large number of sorption sites, each having a distinct crystal field symmetry. The filling of these sites would presumably produce multiple low-energy IINS peaks. However, many of these peaks may be experimentally indistinguishable due to the limited resolution
4Rotation barrier is not necessarily correlated to the adsorption enthalpy. It is not clear, therefore, whether the sites with a smaller rotational barrier would be energetically preferable.
of the spectrometer. The appearance of new peaks at large H2filling may indicate either the filling of energetically unfavorable sites, or the increasing contribution of H2-H2 interactions to the rotational potential.
Applying a simple hindered rotor model to a complex system has its limitations. For example, the model assumes a single, fixed adsorption site in an unchanging external crys- tal field, neglecting the effects of hydrogen-hydrogen interactions. The two-dimensional, anisotropic rotor model (with calculated rotational barriers) gives values that are clearly inconsistent with experiment. Furthermore, even the one-dimensional rotor model does not describe the intensities of observed peaks in a consistent manner. It pairs the weak 0.56 meV peak with the strong 52 meV peak, and pairs the strong 1.5 meV peak with the weak 39 meV peak. Moreover, it fails to explain the intermediate-energy spectral peaks between 10 meV and 30 meV. We can invoke a negative potential barrier of−29 meV which predicts transitions at 12 meV and 23 meV, in reasonable agreement with the observed data.
From the first-principles calculations, however, there is no strong evidence for the existence of a negative rotational barrier in which the H2 molecule tends to align parallel to the basal plane surface.
On the other hand, there is empirical evidence that the intermediate-energy peaks are somehow linked to the low-energy peaks. There is a strikingly similar pattern in the evo- lution of both the low-energy and intermediate-energy spectra as a function of H2 filling.
In the low-energy spectrum (see Fig. 6.4), Peak III begins to collapse at the x = 1.5 fill- ing, while Peak IV increases sharply in intensity. In the intermediate-energy spectrum (see Fig. 6.6), Peak IV collapses at a concentration of x = 1.5 in conjunction with the rapid growth in Peak III. Based on this observation, a case can be made that the intermediate- energy peaks originate from multiple-excitations of both rotational and phonon modes. In